Published online Feb 26, 2016. doi: 10.4331/wjbc.v7.i1.188
Peer-review started: July 16, 2015
First decision: September 17, 2015
Revised: October 30, 2015
Accepted: December 3, 2015
Article in press: December 4, 2015
Published online: February 26, 2016
Processing time: 243 Days and 22.6 Hours
AIM: To investigate epigenomic and gene expression alterations during cellular senescence induced by oncogenic Raf.
METHODS: Cellular senescence was induced into mouse embryonic fibroblasts (MEFs) by infecting retrovirus to express oncogenic Raf (RafV600E). RNA was collected from RafV600E cells as well as MEFs without infection and MEFs with mock infection, and a genome-wide gene expression analysis was performed using microarray. The epigenomic status for active H3K4me3 and repressive H3K27me3 histone marks was analyzed by chromatin immunoprecipitation-sequencing for RafV600E cells on day 7 and for MEFs without infection. These data for Raf-induced senescence were compared with data for Ras-induced senescence that were obtained in our previous study. Gene knockdown and overexpression were done by retrovirus infection.
RESULTS: Although the expression of some genes including secreted factors was specifically altered in either Ras- or Raf-induced senescence, many genes showed similar alteration pattern in Raf- and Ras-induced senescence. A total of 841 commonly upregulated 841 genes and 573 commonly downregulated genes showed a significant enrichment of genes related to signal and secreted proteins, suggesting the importance of alterations in secreted factors. Bmp2, a secreted protein to activate Bmp2-Smad signaling, was highly upregulated with gain of H3K4me3 and loss of H3K27me3 during Raf-induced senescence, as previously detected in Ras-induced senescence, and the knockdown of Bmp2 by shRNA lead to escape from Raf-induced senescence. Bmp2-Smad inhibitor Smad6 was strongly repressed with H3K4me3 loss in Raf-induced senescence, as detected in Ras-induced senescence, and senescence was also bypassed by Smad6 induction in Raf-activated cells. Different from Ras-induced senescence, however, gain of H3K27me3 did not occur in the Smad6 promoter region during Raf-induced senescence. When comparing genome-wide alteration between Ras- and Raf-induced senescence, genes showing loss of H3K27me3 during senescence significantly overlapped; genes showing H3K4me3 gain, or those showing H3K4me3 loss, also well-overlapped between Ras- and Raf-induced senescence. However, genes with gain of H3K27me3 overlapped significantly rarely, compared with those with H3K27me3 loss, with H3K4me3 gain, or with H3K4me3 loss.
CONCLUSION: Although epigenetic alterations are partly different, Bmp2 upregulation and Smad6 repression occur and contribute to Raf-induced senescence, as detected in Ras-induced senescence.
Core tip: By examining gene expressions and active and repressive histone marks on genome-wide scale, many genes were found to show common expression changes during Ras- and Raf-induced senescence, including genes related to secreted factors and cell cycle. Upregulation of Bmp2 and downregulation of Smad6 were detected and played a role in Raf-induced senescence as well as in Ras-induced senescence. Epigenetic alterations to regulate gene expression were also similar, including gain and loss of active histone mark H3K4me3 and loss of H3K27me3. But epigenetic changes are different in part, e.g., in gain of H3K27me3 in Smad6 promoter region.
- Citation: Fujimoto M, Mano Y, Anai M, Yamamoto S, Fukuyo M, Aburatani H, Kaneda A. Epigenetic alteration to activate Bmp2-Smad signaling in Raf-induced senescence. World J Biol Chem 2016; 7(1): 188-205
- URL: https://www.wjgnet.com/1949-8454/full/v7/i1/188.htm
- DOI: https://dx.doi.org/10.4331/wjbc.v7.i1.188
Cellular senescence is a phenomenon of permanent growth arrest after the limited cell division of primary culture cells[1]. Similar to replicative senescence of cells, the premature form of cellular senescence can be induced by activated oncogenes, oxidase stress, telomere shortening, and DNA damage[2,3]. It is assumed that premature senescence may function as barrier mechanism against cancer progression[4-7]; in fact, many premature senescent cells have been seen in premalignant tumors[8-10].
Similar to replicative senescence, premature senescence is identified by biomarkers of senescence, e.g., senescence-associated β-galactosidase (SA-β-gal). In addition to oncogenic Ras, premature senescence can also be induced by other oncogenes, e.g., Braf, AKT, E2F1, cyclin E, Mos, and Cdc6, and by the inactivation of tumor-suppressor genes including PTEN and NF1[11]. Some oncogenes induce senescence through DNA damage responses[12], or by hyper-replication of DNA caused by sustained oncogenic signals[13,14].
Oncogene-induced senescence and replicative senescence activate tumor suppressor cascades, including p16Ink4a-Rb and p19Arf (p14ARF in human)-TP53 signaling pathways[15,16]. Though the roles of RB and TP53 signals in senescence are undisputable, other factors are also known to be involved.
Senescent cells are observed to express a vast number of secreted proteins, e.g., transforming growth factor-β, insulin, Wnt, and interleukin signaling cascades protein. This phenotype was known as “senescence-associated secretory phenotype (SASP)” or “senescence-messaging secretome”[17,18]. The SASP includes many inflammatory cytokines and chemokines[17], providing a strong link between senescence and inflammation. SASP activation is largely mediated by the transcription factors nuclear factor -kB and CCAAT/enhancer-binding protein beta[19-21], and comprises a range of chemokines (chemoattractants and macrophage inflammatory proteins), proinflammatory cytokines (IL-1a, IL-1b, IL-6, and IL-8), growth factors (hepatocyte growth factor, TGFb, granulocyte-macrophage colony-stimulating factor)[22,23] and matrix-remodeling enzymes[19,20,24].
Epigenetic mechanisms are also involved in senescence. When human fibroblasts leads to cellular senescence, heterochromatic regions gather to form senescence-associated heterochromatic foci (SAHF), in which genomic regions with histone H3K9 trimethylation condense and are surrounded by histone H3K27 trimethylation (H3K27me3). These heterochromatin foci are colocalized with heterochromatin protein HP1, macroH2A and HMGA[25]. The p16 and ARF locus is regulated by Polycomb repressive complexes (PRCs), which repress transcription in proliferating cells. The H3K27me3 mark at the locus was lost during oncogene-induced senescence, which lead to expression of p16INK4A and ARF in senescence, and these molecular alterations were also observed in replicative senescence[26-29]. The histone demethylase for H3K27, Jmjd3, was reported to be critical for senescence, and knockdown of Jmjd3 sustained repression of p16 by H3K27me3, leading to escape from senescence[30,31].
We previously analyzed epigenetic and gene expression changes in Ras-induced senescence of mouse embryonic fibroblasts (MEFs) on genome-wide scale[22]. We showed that Bmp2-Smad signaling is important in Ras-induced senescence, and is regulated by coordinated dynamic alterations of the H3K4me3 and H3K27me3 marks. We further examined the downstream target genes of the signal genome-widely, and showed that dynamic epigenomic alteration disrupts negative feedback loop of the signal, and that continuously activated downstream targets contribute to growth arrest. These epigenetic alterations associated with Bmp2-Smad1 signal were found to occur specifically in Ras-activated cells, not in control cells with mock retrovirus infection[22]. In contrast, the epigenetic alteration at the Ink4a-Arf locus was commonly observed in Ras-activated cells and mock cells, i.e., both in cells under Ras-induced senescence and cells under replicative senescence[22]. It was suggested that there might be common epigenetic mechanisms in premature senescence and replicative senescence, and also different epigenetic regulation on specific signals between the two senescence programs. Within such molecular alterations specifically observed during premature senescence, there might be some common alterations and some different alterations in premature senescence induced by different stresses, but such analysis to compare different types of premature senescence has not been conducted in detail.
Here we analyzed genome-wide transcription and epigenetic changes during Raf-induced senescence by microarray and ChIP-seq. We found that the majority of genes that were altered during Ras- and Raf-induced senescence were similar, and that activation of Bmp2 and repression of Smad6 were also involved in Raf-induced senescence. However, epigenetic alterations might be somewhat different between Ras- and Raf-induced senescence, e.g., in gain of H3K27me3 mark at the Smad6 locus.
All of the experiments were approved by from the Ethics Committee for Animal Research Studies at the University of Tokyo. The animal protocol was designed to minimize any pain or discomfort to mice. The mice were acclimatized to laboratory conditions for two weeks prior to experiments, and were euthanized by carbon dioxide inhalation for tissue collection. MEF cells were established using 13.5-embryonic-day embryos of C57/B6 mice[23]. Embryos were minced with the head and red organs removed, and digested twice with trypsin/EDTA for 15 min at 37 °C. The cells were seeded onto 10-cm dishes and cultured in Dulbecco’s modified Eagle’s medium containing 100 UI/mL penicillin and 100 g/mL streptomycin sulfate, supplemented with 10% (V/V) fetal bovine serum at 37 °C in 50 mL/L CO2. When cells were passed twice, the MEF cells (MEFp2) underwent retrovirus infection for 48 h. Then the cells were seeded at a density of 1 × 10⁵ cells/6-cm dish (day 0), and total RNA was collected using TRIzol (Invitrogen, Carlsbad, CA), from MEFp2 and from virus-infected MEFs at the indicated time points.
To induce senescence in MEF, we cloned cDNA for wild type BRAF (RafWT) and mutated BRAF (RafV600E) into a CMV promoter driven expression vector pMX-neo that contains the neomycin-resistance gene (Cell Biolabs, San Diego, CA). Using FuGENE 6 Transfection Reagent (Roche, Germany), an empty pMX-neo vector (Mock), and vectors containing RafWT and RafV600E were transfected in plat-E packaging cells (kindly gifted from T. Kitamura, the Institute of Medical Science, the University of Tokyo, Tokyo, Japan) to prepare retroviruses. The infected cells were exposed to 700 μg/mL of G418 (Invitrogen) from days 0-10 for selection. It was confirmed that MEF cells without infection completely died under these conditions by day 5. When mock-infected cells were cultured with and without G418, they did not show a difference in cellular growth, indicating that the multiplicity of infection is nearly 100%. Smad6 cDNA with an N-terminal 6x Myc tag was cloned into pMX-puro vector in our previous study, and retroviruses were prepared using plat-E cells as above. The infected cells were exposed to 1 μg/mL of puromycin from days 0-3 for selection.
Using pSIREN-RetroQ Vector (Clontech, CA), a retrovirus vector to express small hairpin RNA (shRNA) against Bmp2 was constructed as previously reported[22]. The oligonucleotide sequences targeting Bmp2 is: GATCCG GGACACCAGGTTAGTGAAT TTCAAGAGA ATTCACTAACCTGGTGTCC CTTTTTTCTCGAGG, with the 19-mer target sense and antisense sequences underlined. Viral packaging for shRNA retrovirus vectors against Bmp2 (shBmp2) was also performed using plat-E cells and FuGENE 6 as above. To MEFp2, RafV600E and shRNA viruses were simultaneously infected for 48 h. The infected cells were exposed to 1 μg/mL of puromycin during days 0-3 for selection.
For genome-wide gene expression analysis, GeneChip Mouse Genome 430 2.0 Array (Affymetrix) was used. Data were collected by an Affymetrix GeneChip Scanner 3000 (Affymetrix). To obtain the signal value (GeneChip score) for each probe, the GeneChip data were analyzed using Affymetrix GeneChip Operating Software v1.3 by MAS5 algorithms. The average signal in an array was made equal to 100 for global normalization. Expression array data for Raf-induced senescence were collected, and array data for Ras-induced senescence was previously submitted to GEO (#GSE18125).
Gene annotation enrichment was analyzed for Gene Ontology (GO) (biological process, cellular component, and molecular function) and for Functional Categories (Swiss Prot PIR database keywords, and Uniprot Sequence Feature) using the Functional Annotation tool at DAVID Bioinformatics Resources (http://david.abcc.ncifcrf.gov/).
MEFp2 and infected cells at day 7 were cross-linked with 1% formaldehyde for 10 min, and chromatin immunoprecipitation (ChIP) using anti-H3K4me3 (Abcam ab8580, rabbit polyclonal) and H3K27me3 (Upstate 07-142, rabbit polyclonal) was performed. Briefly, cells were crosslinked with 1% formalin for 10 min, and the crosslinked cells were sonicated for fragmentation. The fragmented samples were incubated with antibodies bound to protein A-sepharose beads at 4 °C overnight. The beads were then washed eight times and eluted with elution buffer. The eluates were treated with pronase at 42 °C for 2 h and then underwent incubation at 65 °C overnight to reverse the crosslinks. The immunoprecipitated DNA was purified by the phenol/chloroform procedure and precipitated with LiCl and 70% ethanol.
Samples for ChIP-sequencing were prepared according to the manufacturer’s instructions by Illumina, and sequencing was performed using Solexa Genome Analyzer II. By using the Illumina pipeline software v1.4, 36-bp single-end sequence reads were mapped to the reference mouse genome NCBI Build #36 (UCSC mm8). The numbers of uniquely mapped reads were 10845082 (H3K4me3), 11519151 (H3K27me3), and 5688804 (Input) for MEFp2, and were 26339875 (H3K4me3), 27239707 (H3K27me3), and 6126206 (Input) for RafV600E cells. ChIP-seq data for Ras-induced senescence was previously submitted to GEO (#GSE18125).
To determine the distribution of immunoprecipitated DNA fragments in a certain region, we set a window in genomic DNA, within which we counted a number of uniquely mapped Solexa reads, as previously performed[22]. A window size of 300 bp was used in ChIP-seq of H3K4me3, and that of 500 bp for H3K27me3, because H3K4me3 was distributed in narrow DNA regions and 300 bp was wide enough for a window, but H3K27me3 is rather broad modification than H3K4me3, so a wider window, 500 bp, was necessary to detect read count. To express the modification status for the center position of the window, the number of mapped reads per 1000000 reads within a window was counted and calculated. Within ± 2 kb from the TSS of each gene, the maximum number of mapped reads per 1000000 reads in a window was adopted as the modification status of each gene. When the number was > 3.5 and < 3 for H3K4me3, the gene was regarded as H3K4me3(+) and (-), respectively. When the number was > 1.5 and < 1 for H3K27me3, the gene was regarded as H3K27me3(+) and (-), respectively.
MEFp2 and infected cells on days 3, 5, 7 and 10 underwent SA-β-gal staining[32]. Cells were washed with PBS twice, and incubated in fixation buffer [2% (w/v) formaldehyde, 0.2% (w/v) glutaraldehyde in PBS] for 5 min. The cells were washed with PBS twice again, then incubated in the SA-β-gal staining solution (40 mmol/L citric acid/sodium phosphate, pH 6.0, 150 mmol/L NaCl, 2.0 mmol/L MgCl2, 5 mM K4[Fe(CN)6], 5 mmol/L K3[Fe(CN)6], 1 mg/mL X-gal) overnight.
The infected cells were counted on days 3, 5, 7, and 10 using the Countess cell counter (Invitrogen). A growth curve was drawn by calculating mean number of three dishes.
For RT-PCR, the total RNA was treated with DNase I (Invitrogen), and cDNA was synthesized from 1 μg of total RNA using a Superscript III kit (Invitrogen). Real-time RT-PCR was performed using SYBR Green and iCycler Thermal Cycler (Bio-Rad Laboratories). The number of molecules of BRAF, Bmp2 and Smad6 in a sample was measured by comparing with the standard samples containing 101 to 106 copies of the genes. The quantity of mRNA of each gene was normalized to that of Ppib, and the relative expression levels compared to those in RafV600E were shown. The experiment was performed three times and the mean and standard error were calculated and shown. The following PCR primers were used. BRAF: CACCATCTCC ATATCATTGA GACCA and CGAGATTTCA CTGTAGCTAG ACCAA. Bmp2: TATCATGCCT TTTACTGCCA and ATTCACAGAG TTCACCAGAG TC. Smad6: ATCCCCAAGC CAGACAGTCC and TCCTTGAGCC TCTTGAGCAG C. Ppib: ATGTGGTACG GAAGGTGGAG A and AGCTGCTTAG AGGGATGAGG.
For ChIP-PCR, real-time PCR using SYBR Green and iCycler Thermal Cycler (Bio-Rad Laboratories) was performed to amplify ChIP samples, and they were quantified by comparing with the standard samples, i.e., 20, 2, 0.2, and 0.02 ng/μL of sonicated genomic DNA of MEF. The following PCR primers were used. Actb: TGAGGTACTA GCCACGAGAG AG and ACACCCGCCA CCAGGTAAGC A. Gcgr: TGCTGTCATG TCTGGTGAGT G and GGAGCTGTCA GCACTTGTGT A. Bmp2: CTTGGCTGGA GACTTCTTGA ACT and TGGAGGCGGC AAGACTGGAT. Smad6: CTGGGGTTTG GAATGCCTAA and CTAAAAGCTA TGTACCGACT GAGG.
Unsupervised two-way hierarchical clustering was performed using the Cluster 3.0 software (Stanford University, http://bonsai.ims.u-tokyo.ac.jp/~mdehoon/software/cluster/software.htm#ctv). A heat map was drawn by Java TreeView software (Alok, http://jtreeview.sourceforge.net/). Fisher’s exact test, Student’s t-test, Kolmogorov-Smirnov test, phi coefficient analysis, and log linear analysis were performed using R software (http://www.R-project.org/).
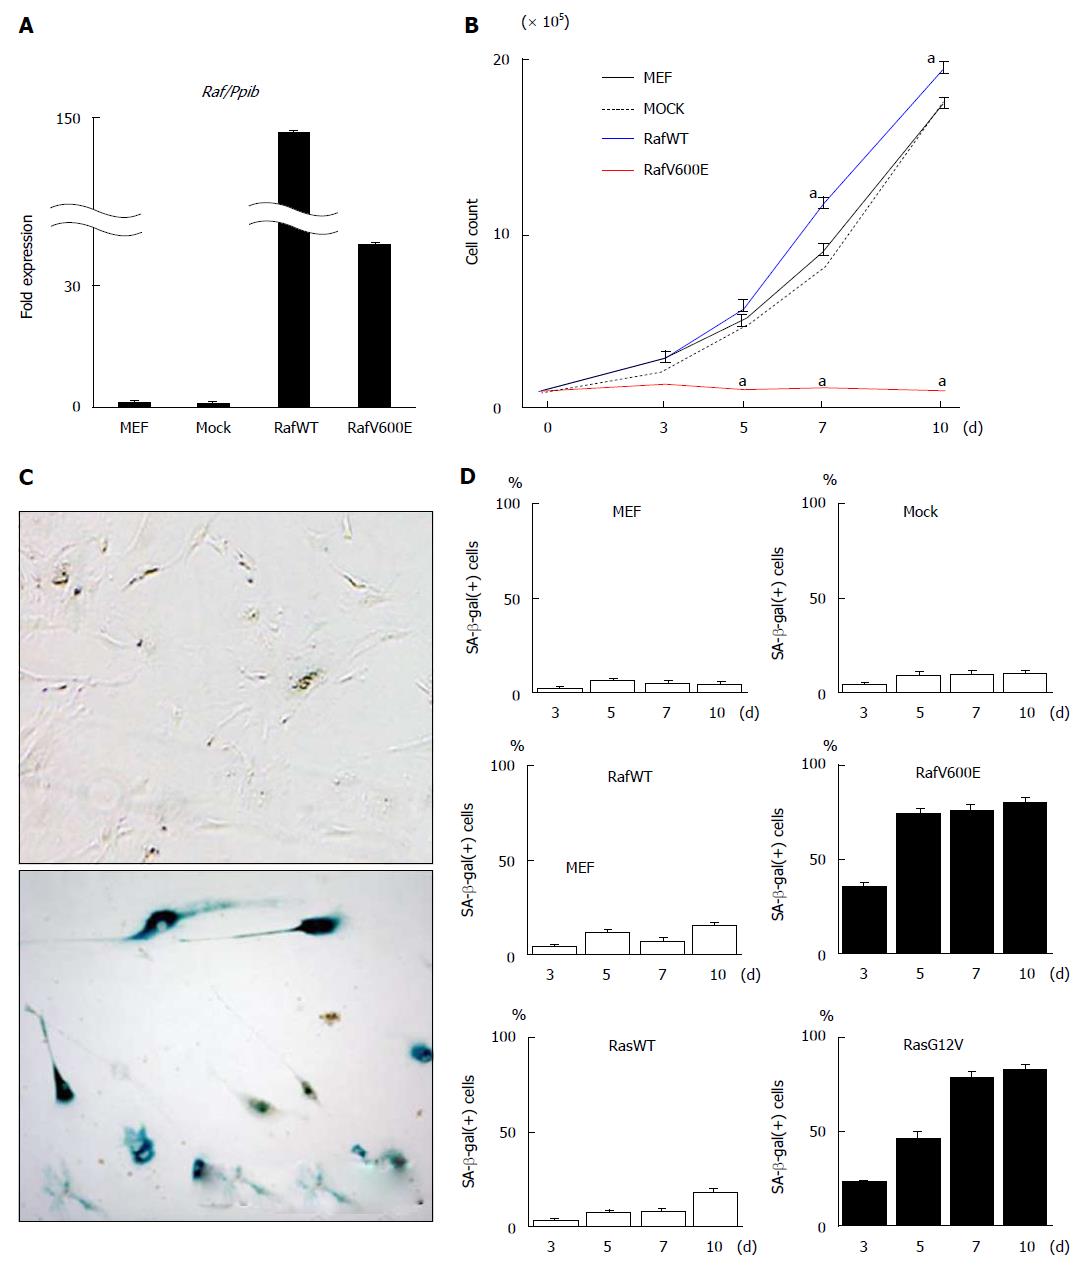
MEF cells after two passages (MEFp2) were infected with retrovirus of wild type Raf (RafWT) or oncogenic Raf (RafV600E), or mock retrovirus, and cultured through day 10 (Figure 1). While mock cells showed cellular growth similar to that of MEF cells without infection and RafWT cells showed slightly but significantly faster growth than those, RafV600E cells hardly showed cellular growth (Figure 1B).
SA-β-gal staining was performed on RafV600E cells on days 3, 5, 7, and 10, and the number of SA-β-gal(+) cells was counted and compared with those for MEF cells without retrovirus infection, mock cells and RafWT cells. RafV600E cells showed a marked increase in number of SA-β-gal(+) cells after day 5, but the number of mock cells and RafWT cells did not increase until day 10 (Figure 1C and D). When cells were infected with retrovirus of oncogenic Ras (RasG12V) and wild type Ras (RasWT) as previous study[22], RasG12V cells showed a marked increase of SA-β-gal(+) cells after day 7, while RasWT cells did not until day 10 (Figure 1D).
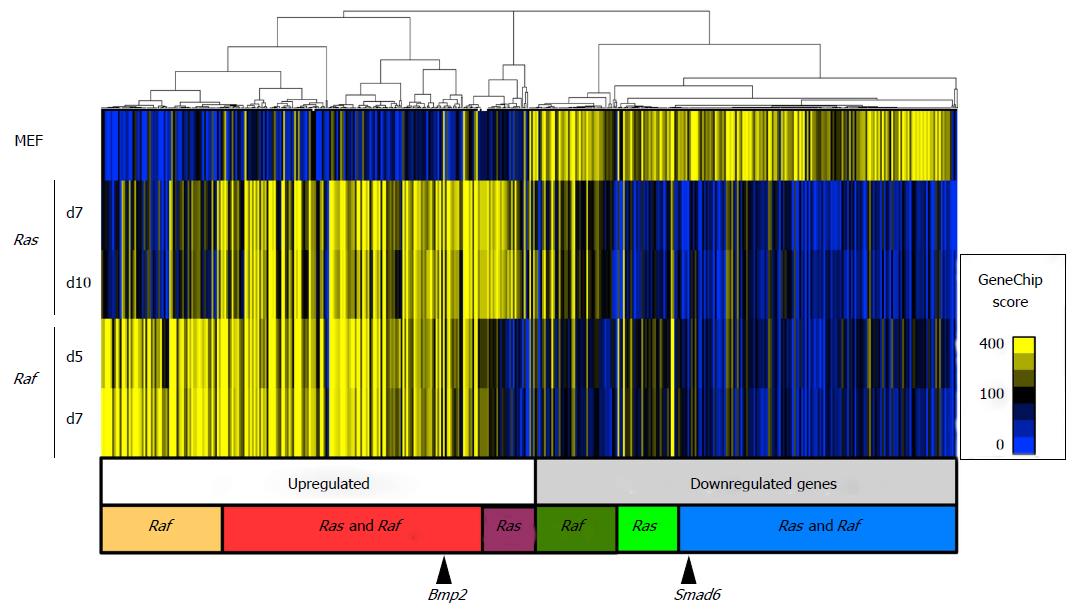
Gene expression analysis was performed on genome-wide scale using expression array, and gene expression changes in Raf-induced senescence were compared with those in Ras-induced senescence (Figure 2). A two-way hierarchical clustering analysis was performed for genes showing > 5-fold increase or < 0.2-fold decrease in any samples of Ras-induced senescence and Raf-induced senescence compared with MEFp2. The major cluster of upregulated genes contained three subgroups: Genes upregulated by Ras and Raf commonly, by Ras specifically, and by Raf specifically. Though it is less clear, the cluster of downregulated genes also showed three similar subgroups: Genes downregulated by Ras and Raf commonly, by Ras specifically, and by Raf specifically.
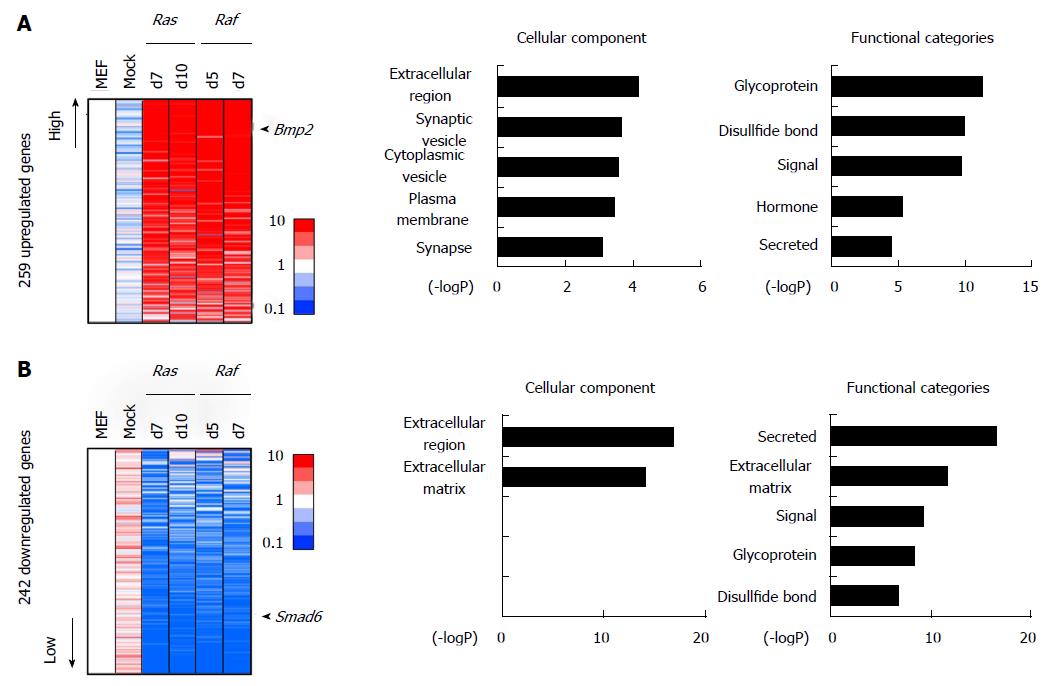
We previously reported that epigenetic activation of Bmp2 and repression of Smad6 is important in Ras-induced senescence. Bmp2 was included in the subgroup of genes upregulated by Ras and Raf commonly, and Smad6 was included among those that were downregulated by Ras and Raf commonly.
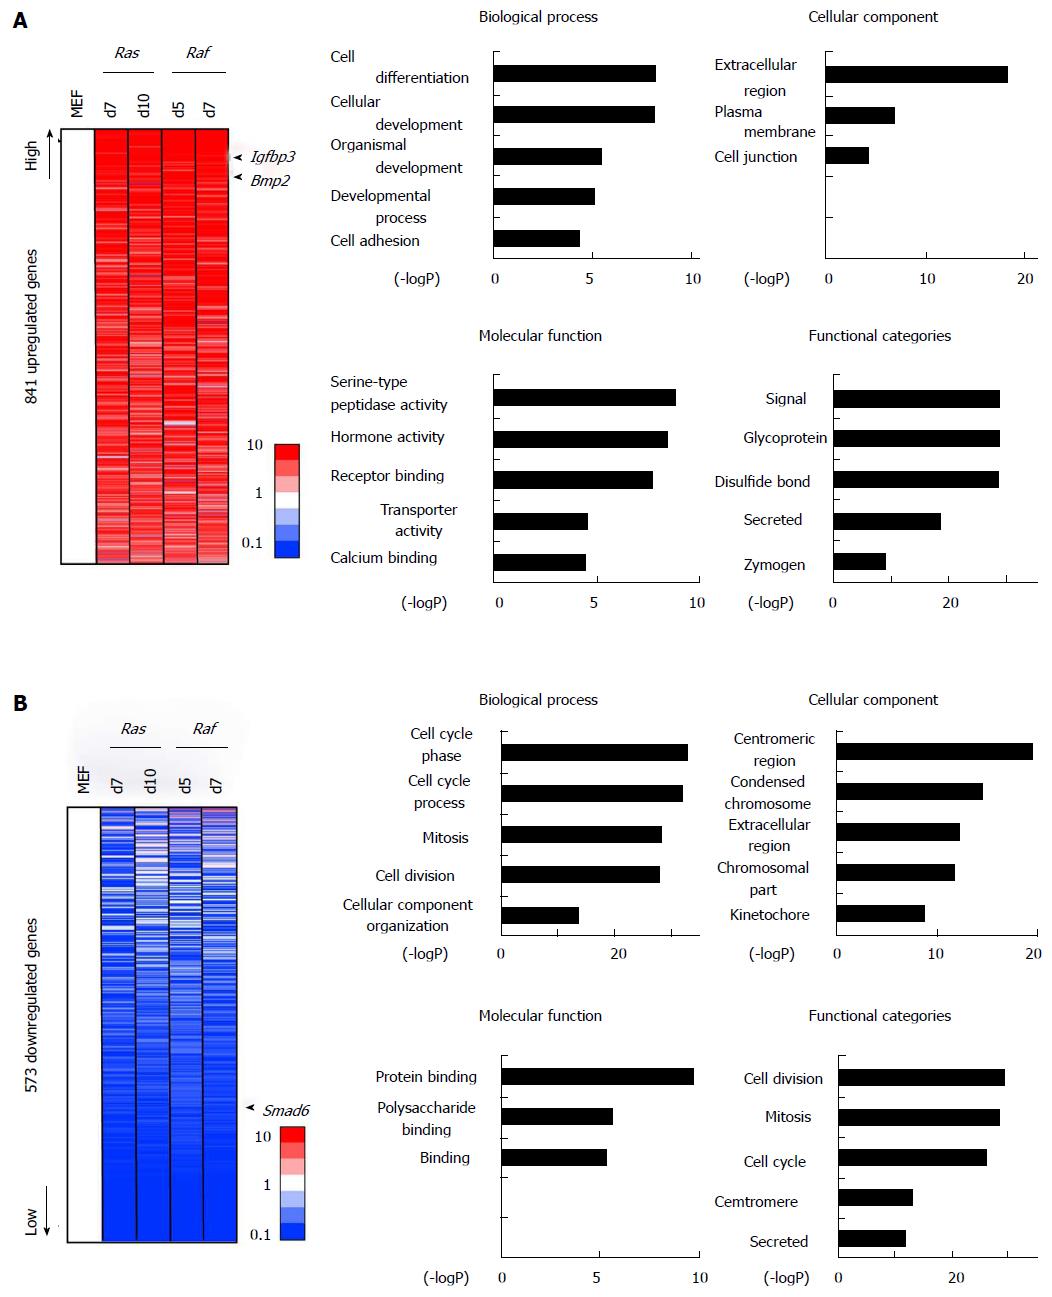
We performed GO enrichment analysis for 841 genes showing > 5-fold increase in RasV12 cells and RafV600E cells commonly (Figure 3A). Genes associated with signal/secreted proteins (P = 3.8 × 10⁻³⁰), extracellular regions (P = 5.3 × 10⁻¹⁹), and cell differentiation/development (P = 6.1 × 10⁻⁹) were upregulated, e.g., Bmp2 and Igfbp3, supporting the alteration of secreted factor expression during senescence, and these factors might play a common role in Ras- and Raf-induced senescence. The 573 genes showing < 0.2-fold decrease commonly RasV12 cells and RafV600E cells, showed genes related to cell cycle (P = 1.3 × 10⁻³³) such as Cdc6, in good agreement with growth arrest (Figure 3B). Genes related to secreted protein (P = 2.0 × 10⁻¹²) and extracellular region (P = 5.4 × 10⁻¹³), such as Cxcl5 and Wnt4, were also enriched, suggesting that the dynamic activation and repression of some secreted factors occur commonly during Ras- and Raf-induced senescence. The GO-term “protein binding” also showed significant enrichment, and Smad6 was included in this term.
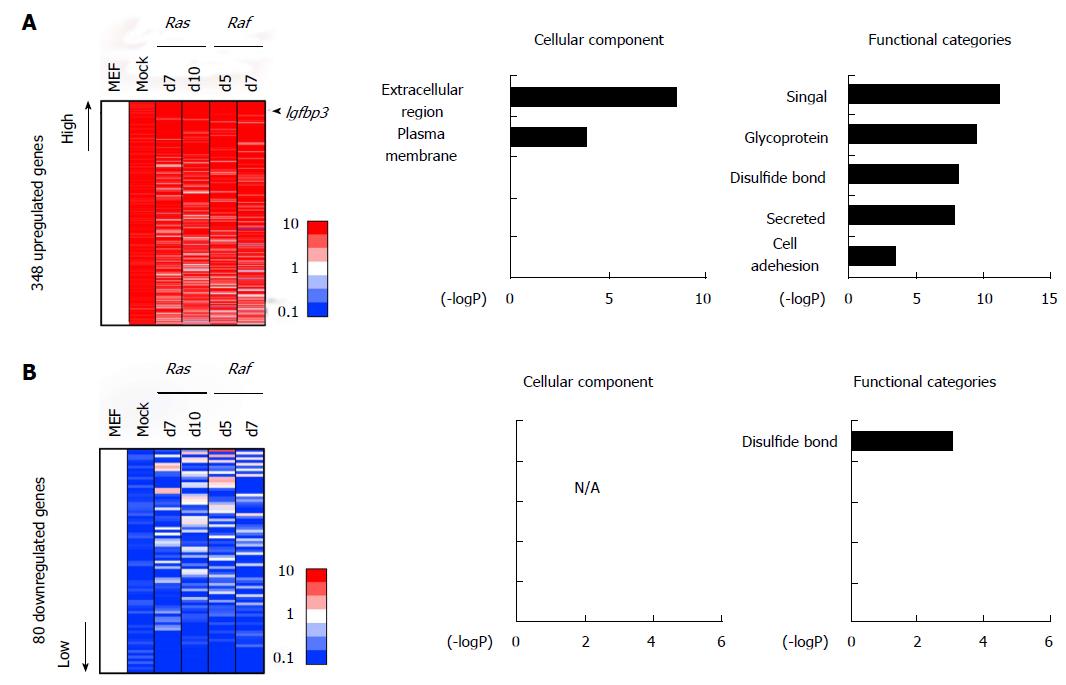
Among these genes altered commonly during Ras- and Raf-induced senescence, some genes showed similar alteration patterns in mock cells (Figure 4). There were 348 genes showing > 5-fold upregulation commonly in mock cells, RasG12V cells and RafV600E cells, compared with MEF. Genes associated with signal/secreted proteins proteins (P = 6.7 × 10⁻¹²) or extracellular regions (P = 3.3 × 10⁻⁹), e.g., Igfbp3 and Cd5l, were significantly enriched in these genes, suggesting the involvement of common secreted factors in both oncogene-induced senescence and replicative senescence (Figure 4A). Similarly, there were 80 genes, e.g., Cdc6 and Wnt4, showing < 0.2-fold downregulation commonly in mock cells, RasG12V cells and RafV600E cells, compared with MEF (Figure 4B).
In some genes, in contrast, the expression alterations commonly observed in Ras-/Raf-induced senescence did not occur in mock cells (Figure 5). There were 259 genes showing > 5-fold upregulation commonly in RasG12V cells and RafV600E cells, but not in mock cells. Genes associated with signal/secreted proteins (P = 1.8 × 10⁻¹⁰) or extracellular regions (P = 7.0 × 10⁻⁵), e.g., Bmp2, were also significantly enriched in these genes, suggesting involvement of some secreted factors specifically in oncogene-induced senescence, but not in replicative senescence (Figure 5A). Similarly there were 242 genes, e.g., Smad6, showing < 0.2-fold downregulation commonly in RasG12V cells and RafV600E cells, but not in mock cells. Genes associated with signal/secreted protein (P = 2.3 × 10⁻¹⁷) or extracellular region (P = 1.3 × 10⁻¹⁷) were also significantly enriched in these genes, e.g., Cxcl5 (Figure 5B). Interestingly, these GO terms were not enriched in genes commonly downregulated in mock, RasG12V, and RafV600E cells (Figure 4B), suggesting that repression of secreted factors occur more dynamically during Ras- and Raf-induced senescence, than in replicative senescence.
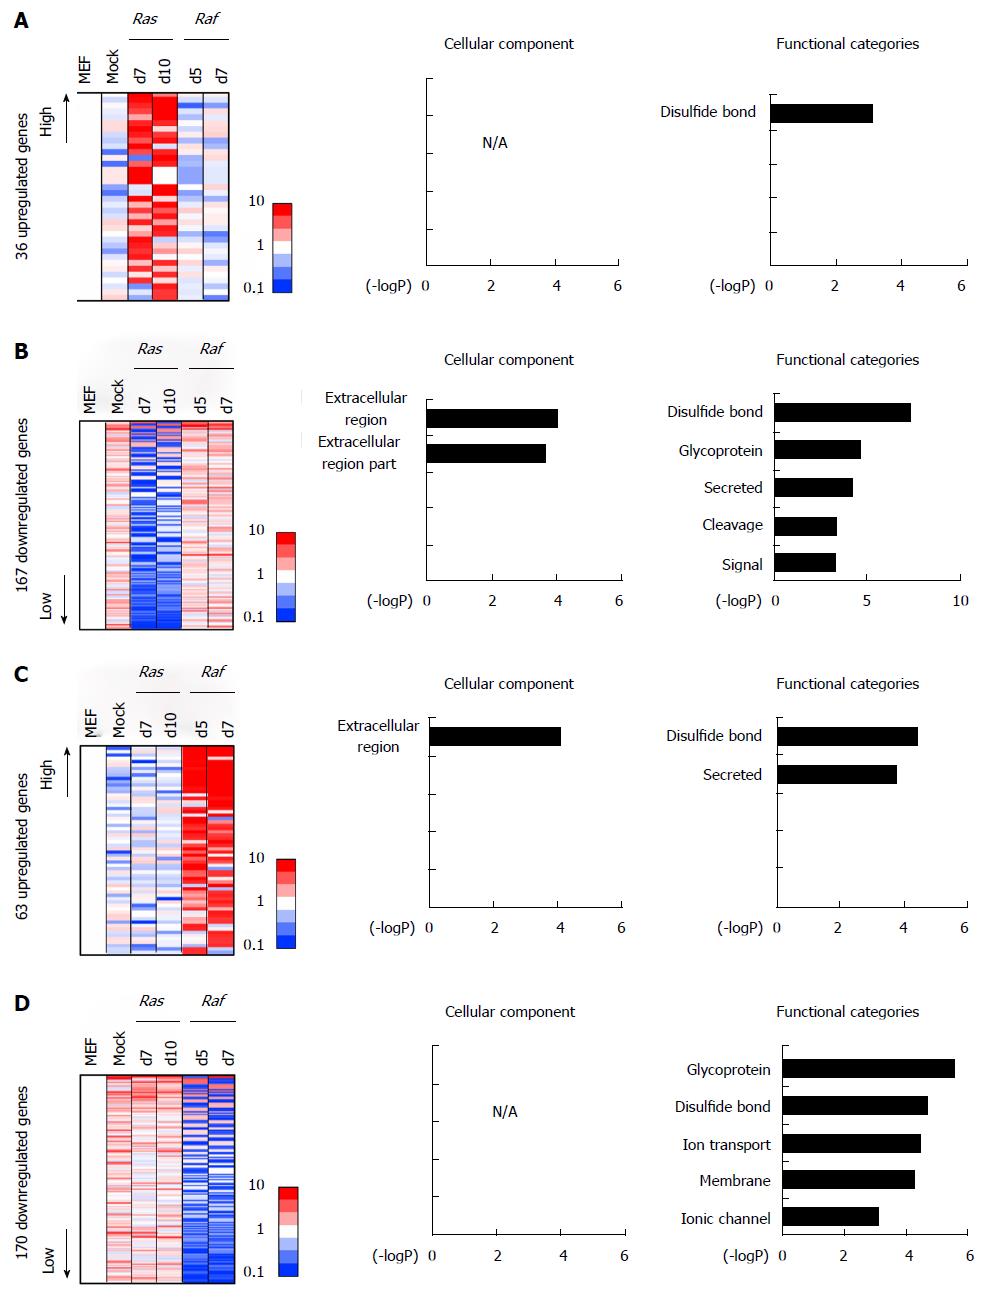
Some genes altered specifically in RasG12V cells, but not in mock cells and RafV600E cells, including 36 upregulated and 167 downregulated genes. The 167 downregulated genes showed a significant enrichment of genes associated with signal/secreted proteins, e.g., Wnt2 (Figure 6A and B). Similarly, some genes altered specifically in RafV600E, but not in mock cells and RasG12V cells, including 63 upregulated and 170 downregulated genes. These genes showed significant enrichment of GO-terms such as “secreted” and “membrane”, e.g., Cd40 in upregulated genes and Mcam in downregulated genes (Figure 6C and D). These results suggested that some environment of secreted proteins might be specifically induced by Ras- or Raf-induced senescence.
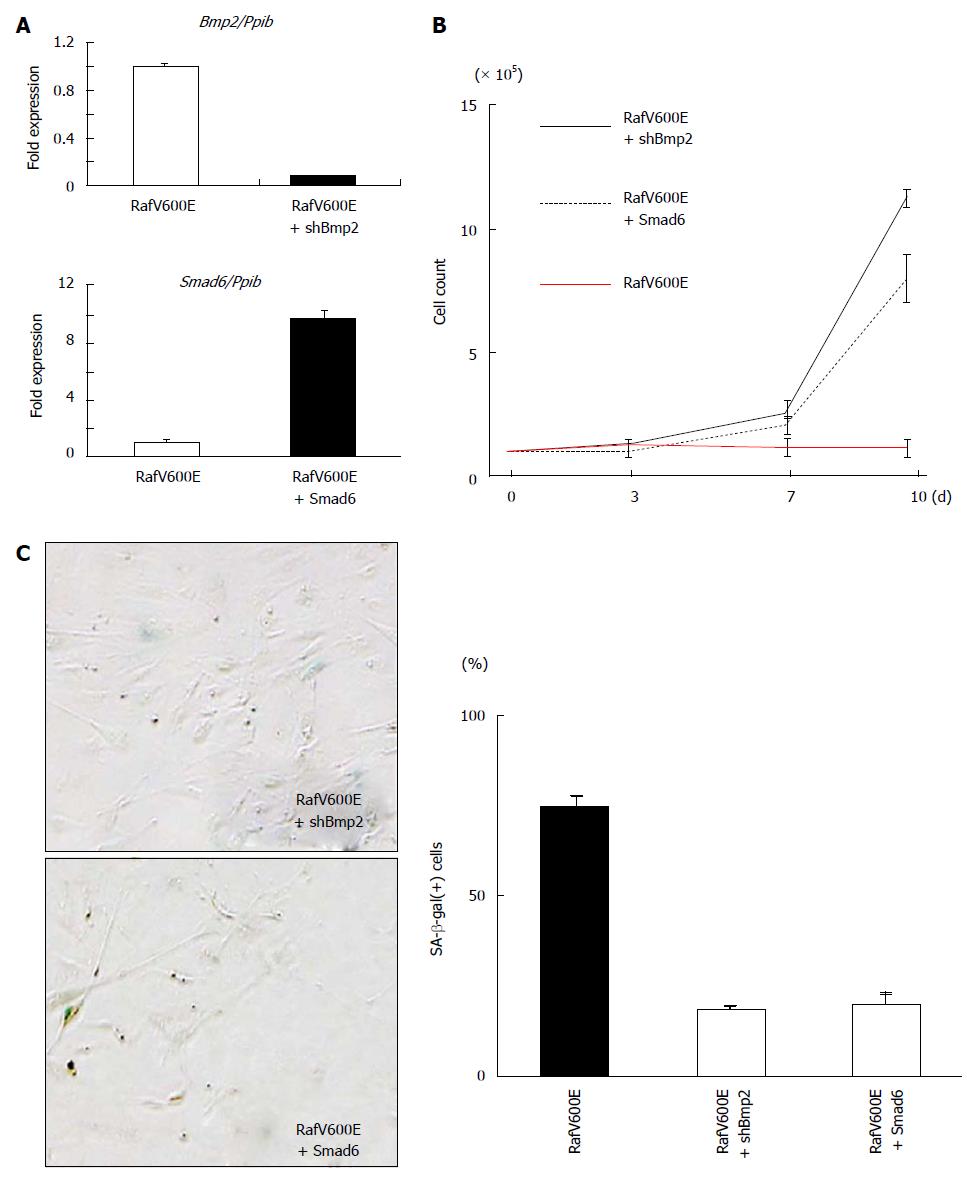
We previously reported that the activation of Bmp2-Smad signaling by the harmonized epigenetic activation of Bmp2 and repression of Smad6 contributes to Ras-induced senescence[22]. In the present study, Bmp2 and Smad6 were found to be altered commonly in Ras- and Raf-induced senescence, but not in mock cells (Figure 5). In our recent targeted exon sequencing analysis in colorectal tumors, mutation of genes in BMP signaling, e.g., BMPR2, BMP2, and SMAD4, were significantlydetected in BRAF-mutation(+) colorectal cancer[33]. It was thus suggested that activation of Bmp2-Smad signalling might be also critical in Raf-induced senescence and disruption of the signaling may play a role in tumorigenesis of BRAF-mutation(+) colorectal cancer. To examine whether an increase of Bmp2 and decrease of Smad6 contributed to Raf-induced senescence, a retrovirus to express shRNA against Bmp2 (shBmp2) or retrovirus to express Smad6 was infected together with RafV600E infection (Figure 7A). When Bmp2 was knocked down, RafV600E cells showed escape from senescence with number of SA-β-gal(+) cells decreased (Figure 7B and C). Smad6 expression also caused escape from senescence with number of SA-β-gal(+) cells decreased (Figure 7B and D). These indicated that increase of Bmp2 and decrease of Smad6 also play an important role in Raf-induced senescence, as well as Ras-induced senescence.
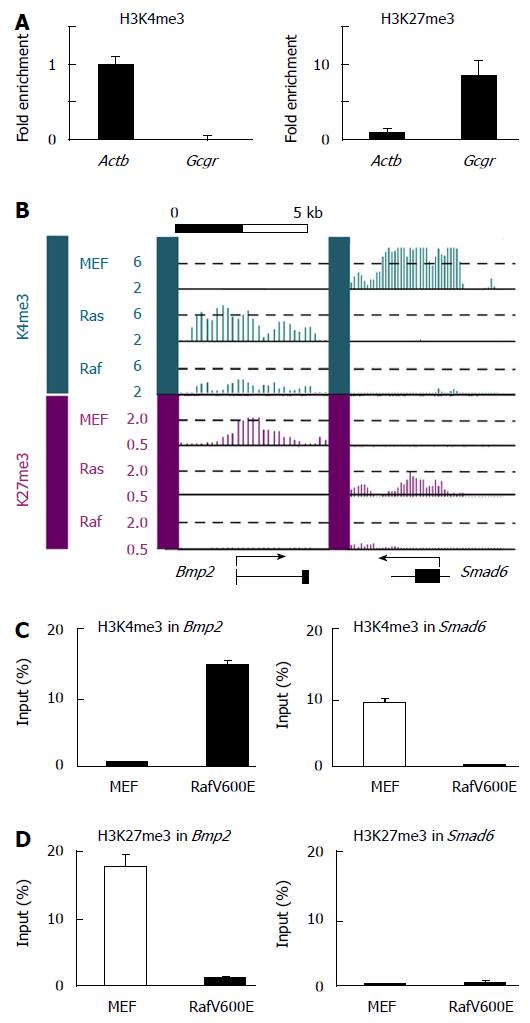
In Ras-induced senescence, while the Bmp2 promoter region gained H3K4me3 mark and lost H3K27me3 mark, the Smad6 promoter region gained H3K27me3 mark and lost H3K4me3 mark in opposite manner. To examine epigenomic alteration of these histone modifications in Raf-induced senescence, ChIP analysis for H3K4me3 and H3K27me3 was performed for RafV600E cells (Figure 8). In the Bmp2 promoter, gain of H3K4me3 and loss of H3K27me3 were detected in Raf-induced senescence as well as in Ras-induced senescence. In the Smad6 promoter, however, loss of H3K4me3 was detected in Raf-induced senescence while de novo H3K27me3 induction was not detected. These results indicated that decrease of Smad6 involved loss of H3K4me3, but did not involve PRC2 recruitment to the promoter region, and suggested that epigenetic alteration might be somewhat different between Ras- and Raf-induced senescence.
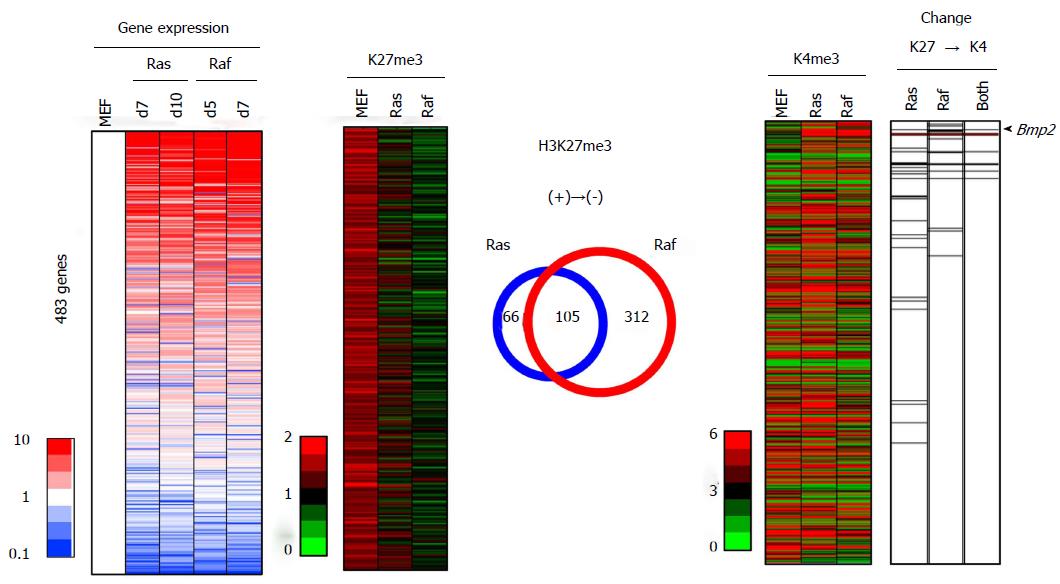
To compare histone modification alterations between Ras- and Raf-induced senescence on genome-wide scale, we performed integrated analyses of epigenetic and expression alterations (Figure 9). Among the analyzed 20232 genes with epigenetic alteration, 15653 genes were also analyzed for expression on microarray, and for integrated analyses. For epigenetic status of H3K27me3, 483 genes showed > 1.5 reads per 1000000 reads in MEFp2, but decreased to < 1.0 reads per 1000000 reads in both or either of Ras- and Raf-induced senescence. Among these 483 genes losing H3K27me3 in senescence, 27 genes in Ras-induced senescence and 18 genes in Raf-induced senescence showed a simultaneous loss of H3K27me3 and gain of H3K4me3 (with increase from < 3.0 reads in MEFp2 to > 3.5 reads in senescence), and 9 genes, including Bmp2, showed simultaneous H3K27me3 loss and H3K4me3 gain in both senescence mechanisms. These genes showed significant enrichment in upregulated genes among the 483 genes (P = 1 × 10⁻⁵ in Ras-induced senescence, P = 2 × 10⁻⁹ in Raf-induced senescence, and P = 2 × 10⁻⁸ in both senescence, Kolmogorov-Smirnov test, Figure 9).
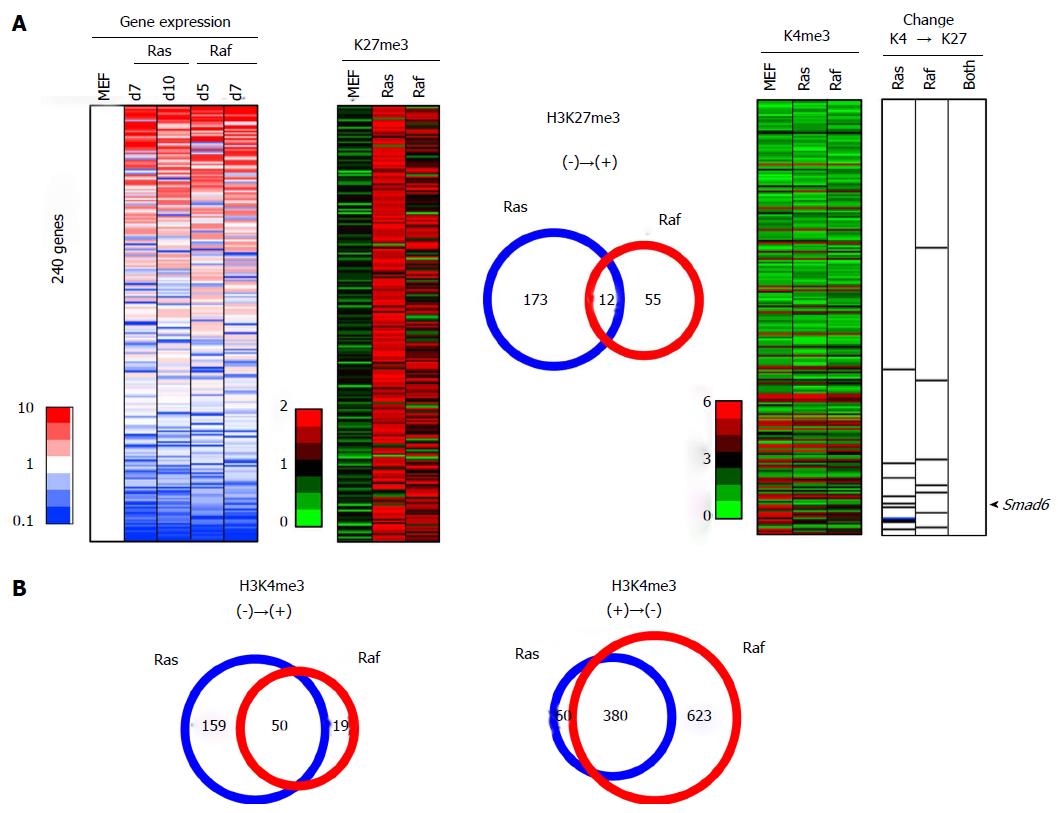
In contrast, 240 genes showed < 1.0 reads per 1000000 reads in MEFp2, but increased to > 1.5 reads per 1000000 reads in both or either Ras- and Raf-induced senescence (Figure 10A). Among these 240 genes acquiring de novo H3K27me3 in senescence, 10 genes in Ras-induced senescence (like Smad6) and 7 genes in Raf-induced senescence showed simultaneous gain of H3K27me3 and loss of H3K4me3, and these genes showed significant enrichment in downregulated genes among the 240 genes (P = 4 × 10⁻⁶ in Ras-induced senescence, P = 0.02 in Raf-induced senescence, Kolmogorov-Smirnov test, Figure 10A). However, the 10 genes and 7 genes did not overlap at all, including Smad6.
Regarding the overlap of H3K27me3 alterations, 171 genes with H3K27me3 loss in Ras-induced senescence and 417 genes with H3K27me3 loss in Raf-induced senescence showed significant overlap (105 genes, P < 1 × 10-15, phi coefficient = 0.386). However, 185 genes with H3K27me3 gain in Ras-induced senescence and 67 genes with H3K27me3 gain in Raf-induced senescence showed limited overlap (12 genes only, phi coefficient = 0.103), and the latter overlap in H3K27me3 gain was markedly rare compared with the former overlap in H3K27me3 loss (P < 1 × 10-15, log linear analysis).
Regarding the overlap of H3K4me3 alterations, genes with H3K4me3 gain in Ras- and Raf induced senescence showed a significant overlap (50 genes, P < 1 × 10-15, phi coefficient = 0.413), and also genes with H3K4me3 loss in Ras- and Raf-induced senescence showed a significant overlap (380 genes, P < 1 × 10-15, phi coefficient = 0.559) (Figure 10B). The overlap in H3K27me3 gain was again markedly rare, when compared with the overlap in H3K4me3 gain (P = 2 × 10⁻⁹, log linear analysis) or with that in H3K4me3 loss (P < 1 × 10-15, log linear analysis).
In this study, we examined epigenomic and gene expression alterations during Raf-induced senescence, comparing them with alterations during Ras-induced senescence. The expression of many genes was commonly altered between Ras- and Raf- induced senescence, including genes related to secreted proteins and cell cycle. Bmp2 upregulation and Smad6 downregulation were observed and played a role in Raf-induced senescence as well as Ras-induced senescence. But there were clusters of genes showing expression altered specifically in either Ras- or Raf-induced senescence, and epigenetic alteration might also be somewhat different, e.g., in gain of H3K27me3.
Ras- and Raf-induced senescence share several features. SAHF formation was observed in the cellular senescence of human fibroblasts, by both Ras- and Raf-activation[34,35]. Growth arrest induced by Ras and Raf is accompanied by accumulation of TP53 and p16, and was reported to be phenotypically indistinguishable from replicative senescence[2,36-38]. Regarding SASP, while cytokines e.g., IL-6 and IL-8 are upregulated and secreted by senescent cells in a paracrine fashion in Ras-induced senescence[24], IL-6 and IL-8 are also secreted and play a role in Raf-induced senescence[19]. In Ras- and Raf-induced senescence in primary melanocytes, pigment epithelium-derived factor and Microphthalmia-associated transcription factor were commonly downregulated[39].
In this study, genes related to secreted factors, including Igfbp3 and Cd5l, were commonly upregulated in Ras- and Raf-induced senescence, and also in mock cells (Figure 4A). In ageing cells, Igfbp3 and Cd5l were reported to be upregulated and contribute to cellular senescence. Genes downregulated commonly in Ras- and Raf-induced senescence and in mock cells (Figure 4B) also included interesting genes. Cdc6 suppresses p16INK4a function, and the knockdown of Cdc6 induces senescence in cancer cells. Downregulation of Wnt4 expression and activation of repressor pathways to suppress β-catenin dependent signaling were reported to play a role in the initiation of age-related senescence of thymic epithelial cells[40]. Alteration of these genes may play a role in both Ras- and Raf-induced senescence.
Some genes showed expression alteration commonly in Ras- and Raf-induced senescence, but not in mock cells. Sox2 regulates Atg10 expression and induces cellular senescence through autophagy phenomenon[41]. Upregulation of Bmp2 and downregulation of Smad6 were found in Ras-induced senescence in our previous study, and will be discussed in detail below. Alteration of these factors may play a role in both Ras- and Raf-induced senescence, but not in replicative senescence.
Although there are not so many genes, genes showing expression changes specifically in either Ras- or Raf-induced senescence also include interesting genes. Wnt2 and Hey1 were downregulated specifically in Ras-induced senescence, but not in Raf-induced senescence or mock cells (Figure 6). Wnt2 is repressed in Ras-induced senescence, and the knockdown of Wnt2 increases amount of SAHF and HIRA foci[42]. Targeting Maml1 in melanoma cells was reported to suppress the downstream transcriptional repressor Hey1, resulting in senescence differentiation of melanoma cells, and increased melanin production[43].
Cd40 was upregulated, and Mcam and Nfia were downregulated specifically in Raf-induced senescence, but not in Ras-induced senescence or mock cells (Figure 6). Cd40 was upregulated in senescence by histone deacetylase inhibitors[44]. The knockdown of Mcam in human mesenchymal stromal cells caused positive SA-β-gal staining[45]. Nfia promoted proliferation of glioma cells, and knockdown of Nfia by shRNA inhibited their proliferation[46]. Raf-specific alteration of these genes may play a specific role in Raf-induced senescence.
Among the genes showing expression alteration commonly or specifically in Ras- and Raf-induced senescence, we focused on an increase of Bmp2 and decrease of Smad6. These alterations were commonly observed in Ras- and Raf-induced senescence, but not in mock cells. In our previous study, the coordinated epigenetic regulation of these changes was found to be critical in Ras-induced senescence[22]. In this study, knockdown of Bmp2 by shRNA and induction of Smad6 in Raf-activated cells showed escape from senescence, indicating that increase of Bmp2 and decrease of Smad6 are also important in Raf-induced senescence as well as Ras-induced senescence. In colorectal cancer, disruption of Bmp2-Smad signaling has been suggested to be important. While the expression of BMP2 was observed in mature colonic epithelium, promoting differentiation and inhibiting proliferation, the expression of BMP2 was lost in adenoma of familial adenomatous polyposis[47]. In sporadic colorectal cancer, BMPR2, BMPR1A, and SMAD4 were frequently inactivated, correlating with loss of Smad1 phosphorylation[48]. The germline mutation of genes in BMP signaling causes Juvenile polyposis syndrome, a hereditary disease with increased risk of colorectal cancer[49,50]. Recently, we performed targeted exon sequencing analysis in colorectal tumors, and BRAF-mutation(+) high-methylation colorectal cancer showed the frequent mutation of genes in BMP signaling, e.g., BMPR2, BMP2, and SMAD4[33]. Disruption of Bmp2-Smad signaling by mutation may play an important role in escaping from Raf-induced senescence and establish Raf-mutation(+) cancer.
The epigenetic alterations to regulate these upregulated and downregulated genes were mostly similar. Gain and loss of H3K4me3, and loss of H3K27me3 showed a significant overlap between Ras- and Raf-induced senescence. These epigenetic changes in Bmp2 and Smad6 promoter regions were commonly observed in Ras- and Raf-induced senescence. However, gain of H3K27me3 was quite different between Ras- and Raf-induced senescence on genome-wide scale. For Smad6, it was repressed by loss of H3K4me3 and gain of H3K27me3 in Ras-induced senescence, but by only loss of H3K4me3 without gain of H3K27me3 in Raf-induced senescence.
Although the mechanism to program epigenetic regulations is largely unknown, non-coding RNA might be involved[51,52]. PRC2 is known to be recruited to target genes in trans through an association with HOTAIR, a non-coding RNA at the HOXC locus[53]. Antisense non-coding RNA in the INK4 locus, ANRIL, binds to PRC1 and PRC2, and represses genes within INK4b/ARF/INK4a locus in cis, but ANRIL was downregulated when Ras was activated and these genes were upregulated[54,55]. It might be interesting to analyze whether PRC is recruited to the Smad6 or Bmp2 region by any non-coding RNAs in cis or trans, and the similarities and differences in epigenetic alterations in these gene regions during Ras- and Raf-induced senescence is caused by an expression alteration of non-coding RNAs.
While the epigenetic regulation of the Smad6 locus was somewhat different between Ras- and Raf-induced senescence, some other genes showing expression changes specifically in either of Ras- and Raf-induced senescence, were accompanied by different epigenomic alterations. Nfia was downregulated specifically in Raf-induced senescence, with H3K4me3 lost specifically in Raf-induced senescence. The difference in epigenetic alteration may cause difference in gene expression patterns, at least in part, and may result in difference in genesis for senescence.
In summary, while gene expression changes are mostly similar between Ras- and Raf-induced senescence, the upregulation of Bmp2 and repression of Smad6 were also important in Raf-induced senescence, and epigenetic alterations might be somewhat different, e.g., in gain of H3K27me3 marks.
The authors would like to thank Takanori Fujita, Kyoko Fujinaka, Hiroko Meguro and Kaori Shiina for technical assistance.
When an oncogene is activated, cells lead to cellular senescence, i.e., irreversible growth arrest as a barrier against malignant transformation. In the authors previous studies, the authors performed a comprehensive analysis of aberrant DNA methylation in colorectal cancer, and reported three subtypes of colorectal cancer with distinct DNA methylation epigenotypes. Different patterns of aberrant methylation accumulation significantly correlated with distinct oncogene mutations, suggesting that the accumulation of aberrant methylation might be a requested phenotype for oncogenic transformation by inactivation of critical factors for oncogene-induced senescence. To gain insight into critical gene inactivation in oncogene-mutation(+) cancer, the authors previously analyzed epigenomic and gene expression alterations in Ras-induced senescence in normal cells, and found a critical role of Bmp2-Smad signaling in Ras-induced senescence and its regulation by coordinated epigenetic alteration.
The author aimed to investigate critical genes in Raf-induced senescence, and any difference between Ras- and Raf-induced senescence, to gain insight into critical gene inactivation in Ras-mutation(+) and Raf-mutation(+) colorectal cancer.
This study demonstrates that while some genes including those related to secreted factors showed expression changes specifically in Ras- or Raf-induced senescence, expression of many genes was commonly altered in Ras- and Raf-induced senescence. These changes include an increase of Bmp2 and decrease of Smad6, and play a role in Raf-induced senescence as well as Ras-induced senescence. Epigenetic changes are also similar, but somewhat different, e.g., gain of H3K27me3 in the Smad6 promoter region.
The authors hypothesize that critical gene expression changes in oncogene-induced senescence should be disrupted in oncogene-mutation(+) cancer, to escape from growth arrest. DNA methylation and target exon sequencing are under analysis for colorectal cancer. An integrated analysis of these data will reveal different genesis of colorectal cancer with mutation of different oncogene.
Comprehensive genomic and epigenomic data can stratify cancer into several subtypes. Colorectal cancer is stratified into BRAF-mutation(+) cancer, KRAS-mutation(+) cancer, and oncogene-mutation(-) cancer. These subgroups show different tumor morphologies, and accompany different genetic and epigenetic alterations, suggesting that these subgroups of cancer may arise through different tumorigenic mechanisms.
In this study, the authors examined the expression changes induced by oncogenic RAF. Previously, the authors have conducted similar study on oncogenic Ras.
P- Reviewer: Bai G, Wang Y S- Editor: Qi Y L- Editor: A E- Editor: Jiao XK
| 1. | Hayflick L. The limited in vitro lifetime of human diploid cell strains. Exp Cell Res. 1965;37:614-636. [RCA] [PubMed] [DOI] [Full Text] [Cited by in Crossref: 4095] [Cited by in RCA: 4011] [Article Influence: 66.9] [Reference Citation Analysis (0)] |
| 2. | Serrano M, Lin AW, McCurrach ME, Beach D, Lowe SW. Oncogenic ras provokes premature cell senescence associated with accumulation of p53 and p16INK4a. Cell. 1997;88:593-602. [RCA] [PubMed] [DOI] [Full Text] [Cited by in Crossref: 3633] [Cited by in RCA: 3757] [Article Influence: 134.2] [Reference Citation Analysis (0)] |
| 3. | Kuilman T, Michaloglou C, Mooi WJ, Peeper DS. The essence of senescence. Genes Dev. 2010;24:2463-2479. [RCA] [PubMed] [DOI] [Full Text] [Cited by in Crossref: 1416] [Cited by in RCA: 1600] [Article Influence: 106.7] [Reference Citation Analysis (0)] |
| 4. | Campisi J. Senescent cells, tumor suppression, and organismal aging: good citizens, bad neighbors. Cell. 2005;120:513-522. [RCA] [PubMed] [DOI] [Full Text] [Cited by in Crossref: 1650] [Cited by in RCA: 1700] [Article Influence: 85.0] [Reference Citation Analysis (0)] |
| 5. | Narita M, Lowe SW. Senescence comes of age. Nat Med. 2005;11:920-922. [RCA] [PubMed] [DOI] [Full Text] [Cited by in Crossref: 119] [Cited by in RCA: 120] [Article Influence: 6.0] [Reference Citation Analysis (0)] |
| 6. | Prieur A, Peeper DS. Cellular senescence in vivo: a barrier to tumorigenesis. Curr Opin Cell Biol. 2008;20:150-155. [RCA] [PubMed] [DOI] [Full Text] [Cited by in Crossref: 182] [Cited by in RCA: 190] [Article Influence: 11.2] [Reference Citation Analysis (0)] |
| 7. | Ivanov A, Adams PD. A damage limitation exercise. Nat Cell Biol. 2011;13:193-195. [RCA] [PubMed] [DOI] [Full Text] [Cited by in Crossref: 9] [Cited by in RCA: 9] [Article Influence: 0.6] [Reference Citation Analysis (0)] |
| 8. | Lowe SW, Cepero E, Evan G. Intrinsic tumour suppression. Nature. 2004;432:307-315. [RCA] [PubMed] [DOI] [Full Text] [Cited by in Crossref: 936] [Cited by in RCA: 954] [Article Influence: 45.4] [Reference Citation Analysis (0)] |
| 9. | Ohtani N, Hara E. Roles and mechanisms of cellular senescence in regulation of tissue homeostasis. Cancer Sci. 2013;104:525-530. [RCA] [PubMed] [DOI] [Full Text] [Cited by in Crossref: 75] [Cited by in RCA: 78] [Article Influence: 6.5] [Reference Citation Analysis (0)] |
| 10. | Rodier F, Campisi J. Four faces of cellular senescence. J Cell Biol. 2011;192:547-556. [RCA] [PubMed] [DOI] [Full Text] [Full Text (PDF)] [Cited by in Crossref: 1319] [Cited by in RCA: 1490] [Article Influence: 106.4] [Reference Citation Analysis (0)] |
| 11. | Courtois-Cox S, Jones SL, Cichowski K. Many roads lead to oncogene-induced senescence. Oncogene. 2008;27:2801-2809. [RCA] [PubMed] [DOI] [Full Text] [Cited by in Crossref: 259] [Cited by in RCA: 302] [Article Influence: 17.8] [Reference Citation Analysis (0)] |
| 12. | Lee AC, Fenster BE, Ito H, Takeda K, Bae NS, Hirai T, Yu ZX, Ferrans VJ, Howard BH, Finkel T. Ras proteins induce senescence by altering the intracellular levels of reactive oxygen species. J Biol Chem. 1999;274:7936-7940. [RCA] [PubMed] [DOI] [Full Text] [Cited by in Crossref: 508] [Cited by in RCA: 485] [Article Influence: 18.7] [Reference Citation Analysis (0)] |
| 13. | Bartkova J, Rezaei N, Liontos M, Karakaidos P, Kletsas D, Issaeva N, Vassiliou LV, Kolettas E, Niforou K, Zoumpourlis VC. Oncogene-induced senescence is part of the tumorigenesis barrier imposed by DNA damage checkpoints. Nature. 2006;444:633-637. [RCA] [PubMed] [DOI] [Full Text] [Cited by in Crossref: 1412] [Cited by in RCA: 1512] [Article Influence: 84.0] [Reference Citation Analysis (0)] |
| 14. | Di Micco R, Fumagalli M, Cicalese A, Piccinin S, Gasparini P, Luise C, Schurra C, Garre’ M, Nuciforo PG, Bensimon A. Oncogene-induced senescence is a DNA damage response triggered by DNA hyper-replication. Nature. 2006;444:638-642. [RCA] [PubMed] [DOI] [Full Text] [Cited by in Crossref: 1280] [Cited by in RCA: 1368] [Article Influence: 76.0] [Reference Citation Analysis (0)] |
| 15. | Sharpless NE, DePinho RA. Cancer: crime and punishment. Nature. 2005;436:636-637. [RCA] [PubMed] [DOI] [Full Text] [Cited by in Crossref: 123] [Cited by in RCA: 125] [Article Influence: 6.3] [Reference Citation Analysis (0)] |
| 16. | Gil J, Peters G. Regulation of the INK4b-ARF-INK4a tumour suppressor locus: all for one or one for all. Nat Rev Mol Cell Biol. 2006;7:667-677. [RCA] [PubMed] [DOI] [Full Text] [Cited by in Crossref: 598] [Cited by in RCA: 632] [Article Influence: 33.3] [Reference Citation Analysis (0)] |
| 17. | Rodier F, Coppé JP, Patil CK, Hoeijmakers WA, Muñoz DP, Raza SR, Freund A, Campeau E, Davalos AR, Campisi J. Persistent DNA damage signalling triggers senescence-associated inflammatory cytokine secretion. Nat Cell Biol. 2009;11:973-979. [RCA] [PubMed] [DOI] [Full Text] [Full Text (PDF)] [Cited by in Crossref: 1369] [Cited by in RCA: 1629] [Article Influence: 101.8] [Reference Citation Analysis (0)] |
| 18. | Coppé JP, Desprez PY, Krtolica A, Campisi J. The senescence-associated secretory phenotype: the dark side of tumor suppression. Annu Rev Pathol. 2010;5:99-118. [RCA] [PubMed] [DOI] [Full Text] [Cited by in Crossref: 2577] [Cited by in RCA: 3596] [Article Influence: 239.7] [Reference Citation Analysis (0)] |
| 19. | Kuilman T, Michaloglou C, Vredeveld LC, Douma S, van Doorn R, Desmet CJ, Aarden LA, Mooi WJ, Peeper DS. Oncogene-induced senescence relayed by an interleukin-dependent inflammatory network. Cell. 2008;133:1019-1031. [RCA] [PubMed] [DOI] [Full Text] [Cited by in Crossref: 1328] [Cited by in RCA: 1523] [Article Influence: 89.6] [Reference Citation Analysis (0)] |
| 20. | Acosta JC, O’Loghlen A, Banito A, Guijarro MV, Augert A, Raguz S, Fumagalli M, Da Costa M, Brown C, Popov N. Chemokine signaling via the CXCR2 receptor reinforces senescence. Cell. 2008;133:1006-1018. [RCA] [PubMed] [DOI] [Full Text] [Cited by in Crossref: 1207] [Cited by in RCA: 1308] [Article Influence: 76.9] [Reference Citation Analysis (0)] |
| 21. | Chien Y, Scuoppo C, Wang X, Fang X, Balgley B, Bolden JE, Premsrirut P, Luo W, Chicas A, Lee CS. Control of the senescence-associated secretory phenotype by NF-κB promotes senescence and enhances chemosensitivity. Genes Dev. 2011;25:2125-2136. [RCA] [PubMed] [DOI] [Full Text] [Cited by in Crossref: 578] [Cited by in RCA: 723] [Article Influence: 51.6] [Reference Citation Analysis (0)] |
| 22. | Kaneda A, Fujita T, Anai M, Yamamoto S, Nagae G, Morikawa M, Tsuji S, Oshima M, Miyazono K, Aburatani H. Activation of Bmp2-Smad1 signal and its regulation by coordinated alteration of H3K27 trimethylation in Ras-induced senescence. PLoS Genet. 2011;7:e1002359. [RCA] [PubMed] [DOI] [Full Text] [Full Text (PDF)] [Cited by in Crossref: 49] [Cited by in RCA: 57] [Article Influence: 4.1] [Reference Citation Analysis (0)] |
| 23. | Kaneda A, Wang CJ, Cheong R, Timp W, Onyango P, Wen B, Iacobuzio-Donahue CA, Ohlsson R, Andraos R, Pearson MA. Enhanced sensitivity to IGF-II signaling links loss of imprinting of IGF2 to increased cell proliferation and tumor risk. Proc Natl Acad Sci USA. 2007;104:20926-20931. [RCA] [PubMed] [DOI] [Full Text] [Cited by in Crossref: 77] [Cited by in RCA: 80] [Article Influence: 4.4] [Reference Citation Analysis (0)] |
| 24. | Coppé JP, Patil CK, Rodier F, Sun Y, Muñoz DP, Goldstein J, Nelson PS, Desprez PY, Campisi J. Senescence-associated secretory phenotypes reveal cell-nonautonomous functions of oncogenic RAS and the p53 tumor suppressor. PLoS Biol. 2008;6:2853-2868. [RCA] [PubMed] [DOI] [Full Text] [Full Text (PDF)] [Cited by in Crossref: 2346] [Cited by in RCA: 2929] [Article Influence: 183.1] [Reference Citation Analysis (0)] |
| 25. | Narita M, Nũnez S, Heard E, Narita M, Lin AW, Hearn SA, Spector DL, Hannon GJ, Lowe SW. Rb-mediated heterochromatin formation and silencing of E2F target genes during cellular senescence. Cell. 2003;113:703-716. [RCA] [PubMed] [DOI] [Full Text] [Cited by in Crossref: 1626] [Cited by in RCA: 1681] [Article Influence: 76.4] [Reference Citation Analysis (0)] |
| 26. | Parrinello S, Samper E, Krtolica A, Goldstein J, Melov S, Campisi J. Oxygen sensitivity severely limits the replicative lifespan of murine fibroblasts. Nat Cell Biol. 2003;5:741-747. [RCA] [PubMed] [DOI] [Full Text] [Cited by in Crossref: 842] [Cited by in RCA: 847] [Article Influence: 38.5] [Reference Citation Analysis (0)] |
| 27. | Jacobs JJ, Kieboom K, Marino S, DePinho RA, van Lohuizen M. The oncogene and Polycomb-group gene bmi-1 regulates cell proliferation and senescence through the ink4a locus. Nature. 1999;397:164-168. [RCA] [PubMed] [DOI] [Full Text] [Cited by in Crossref: 1208] [Cited by in RCA: 1239] [Article Influence: 47.7] [Reference Citation Analysis (0)] |
| 28. | Bracken AP, Kleine-Kohlbrecher D, Dietrich N, Pasini D, Gargiulo G, Beekman C, Theilgaard-Mönch K, Minucci S, Porse BT, Marine JC. The Polycomb group proteins bind throughout the INK4A-ARF locus and are disassociated in senescent cells. Genes Dev. 2007;21:525-530. [RCA] [PubMed] [DOI] [Full Text] [Cited by in Crossref: 689] [Cited by in RCA: 695] [Article Influence: 38.6] [Reference Citation Analysis (0)] |
| 29. | Kotake Y, Cao R, Viatour P, Sage J, Zhang Y, Xiong Y. pRB family proteins are required for H3K27 trimethylation and Polycomb repression complexes binding to and silencing p16INK4alpha tumor suppressor gene. Genes Dev. 2007;21:49-54. [RCA] [PubMed] [DOI] [Full Text] [Cited by in Crossref: 245] [Cited by in RCA: 253] [Article Influence: 14.1] [Reference Citation Analysis (0)] |
| 30. | Agger K, Cloos PA, Rudkjaer L, Williams K, Andersen G, Christensen J, Helin K. The H3K27me3 demethylase JMJD3 contributes to the activation of the INK4A-ARF locus in response to oncogene- and stress-induced senescence. Genes Dev. 2009;23:1171-1176. [RCA] [PubMed] [DOI] [Full Text] [Cited by in Crossref: 331] [Cited by in RCA: 343] [Article Influence: 21.4] [Reference Citation Analysis (0)] |
| 31. | Barradas M, Anderton E, Acosta JC, Li S, Banito A, Rodriguez-Niedenführ M, Maertens G, Banck M, Zhou MM, Walsh MJ. Histone demethylase JMJD3 contributes to epigenetic control of INK4a/ARF by oncogenic RAS. Genes Dev. 2009;23:1177-1182. [RCA] [PubMed] [DOI] [Full Text] [Cited by in Crossref: 269] [Cited by in RCA: 277] [Article Influence: 17.3] [Reference Citation Analysis (0)] |
| 32. | Dimri GP, Lee X, Basile G, Acosta M, Scott G, Roskelley C, Medrano EE, Linskens M, Rubelj I, Pereira-Smith O. A biomarker that identifies senescent human cells in culture and in aging skin in vivo. Proc Natl Acad Sci USA. 1995;92:9363-9367. [PubMed] |
| 33. | Sakai E, Fukuyo M, Ohata K, Matsusaka K, Doi N, Mano Y, Takane K, Abe H, Yagi K, Matsuhashi N. Genetic and epigenetic aberrations occurring in colorectal tumors associated with serrated pathway. Int J Cancer. 2016;138:1634-1644. [RCA] [PubMed] [DOI] [Full Text] [Full Text (PDF)] [Cited by in Crossref: 39] [Cited by in RCA: 40] [Article Influence: 4.0] [Reference Citation Analysis (0)] |
| 34. | Narita M, Narita M, Krizhanovsky V, Nuñez S, Chicas A, Hearn SA, Myers MP, Lowe SW. A novel role for high-mobility group a proteins in cellular senescence and heterochromatin formation. Cell. 2006;126:503-514. [RCA] [PubMed] [DOI] [Full Text] [Cited by in Crossref: 430] [Cited by in RCA: 453] [Article Influence: 23.8] [Reference Citation Analysis (0)] |
| 35. | Jeanblanc M, Ragu S, Gey C, Contrepois K, Courbeyrette R, Thuret JY, Mann C. Parallel pathways in RAF-induced senescence and conditions for its reversion. Oncogene. 2012;31:3072-3085. [RCA] [PubMed] [DOI] [Full Text] [Cited by in Crossref: 46] [Cited by in RCA: 46] [Article Influence: 3.3] [Reference Citation Analysis (0)] |
| 36. | Collado M, Gil J, Efeyan A, Guerra C, Schuhmacher AJ, Barradas M, Benguría A, Zaballos A, Flores JM, Barbacid M. Tumour biology: senescence in premalignant tumours. Nature. 2005;436:642. [PubMed] |
| 37. | Zhu J, Woods D, McMahon M, Bishop JM. Senescence of human fibroblasts induced by oncogenic Raf. Genes Dev. 1998;12:2997-3007. [RCA] [PubMed] [DOI] [Full Text] [Cited by in Crossref: 601] [Cited by in RCA: 595] [Article Influence: 22.0] [Reference Citation Analysis (0)] |
| 38. | Michaloglou C, Vredeveld LC, Soengas MS, Denoyelle C, Kuilman T, van der Horst CM, Majoor DM, Shay JW, Mooi WJ, Peeper DS. BRAFE600-associated senescence-like cell cycle arrest of human naevi. Nature. 2005;436:720-724. [RCA] [PubMed] [DOI] [Full Text] [Cited by in Crossref: 1563] [Cited by in RCA: 1671] [Article Influence: 83.6] [Reference Citation Analysis (0)] |
| 39. | Fernández-Barral A, Orgaz JL, Baquero P, Ali Z, Moreno A, Tiana M, Gómez V, Riveiro-Falkenbach E, Cañadas C, Zazo S. Regulatory and functional connection of microphthalmia-associated transcription factor and anti-metastatic pigment epithelium derived factor in melanoma. Neoplasia. 2014;16:529-542. [RCA] [PubMed] [DOI] [Full Text] [Full Text (PDF)] [Cited by in Crossref: 21] [Cited by in RCA: 26] [Article Influence: 2.4] [Reference Citation Analysis (0)] |
| 40. | Varecza Z, Kvell K, Talabér G, Miskei G, Csongei V, Bartis D, Anderson G, Jenkinson EJ, Pongracz JE. Multiple suppression pathways of canonical Wnt signalling control thymic epithelial senescence. Mech Ageing Dev. 2011;132:249-256. [RCA] [PubMed] [DOI] [Full Text] [Cited by in Crossref: 27] [Cited by in RCA: 25] [Article Influence: 1.8] [Reference Citation Analysis (0)] |
| 41. | Cho YY, Kim DJ, Lee HS, Jeong CH, Cho EJ, Kim MO, Byun S, Lee KY, Yao K, Carper A. Autophagy and cellular senescence mediated by Sox2 suppress malignancy of cancer cells. PLoS One. 2013;8:e57172. [RCA] [PubMed] [DOI] [Full Text] [Full Text (PDF)] [Cited by in Crossref: 30] [Cited by in RCA: 42] [Article Influence: 3.5] [Reference Citation Analysis (0)] |
| 42. | Kuilman T, Peeper DS. Senescence-messaging secretome: SMS-ing cellular stress. Nat Rev Cancer. 2009;9:81-94. [RCA] [PubMed] [DOI] [Full Text] [Cited by in Crossref: 652] [Cited by in RCA: 676] [Article Influence: 42.3] [Reference Citation Analysis (0)] |
| 43. | Kang S, Xie J, Miao J, Li R, Liao W, Luo R. A knockdown of Maml1 that results in melanoma cell senescence promotes an innate and adaptive immune response. Cancer Immunol Immunother. 2013;62:183-190. [RCA] [PubMed] [DOI] [Full Text] [Cited by in Crossref: 10] [Cited by in RCA: 13] [Article Influence: 1.1] [Reference Citation Analysis (0)] |
| 44. | Gregorie CJ, Wiesen JL, Magner WJ, Lin AW, Tomasi TB. Restoration of immune response gene induction in trophoblast tumor cells associated with cellular senescence. J Reprod Immunol. 2009;81:25-33. [RCA] [PubMed] [DOI] [Full Text] [Cited by in Crossref: 8] [Cited by in RCA: 8] [Article Influence: 0.5] [Reference Citation Analysis (0)] |
| 45. | Stopp S, Bornhäuser M, Ugarte F, Wobus M, Kuhn M, Brenner S, Thieme S. Expression of the melanoma cell adhesion molecule in human mesenchymal stromal cells regulates proliferation, differentiation, and maintenance of hematopoietic stem and progenitor cells. Haematologica. 2013;98:505-513. [RCA] [PubMed] [DOI] [Full Text] [Cited by in Crossref: 23] [Cited by in RCA: 27] [Article Influence: 2.1] [Reference Citation Analysis (0)] |
| 46. | Lee JS, Xiao J, Patel P, Schade J, Wang J, Deneen B, Erdreich-Epstein A, Song HR. A novel tumor-promoting role for nuclear factor IA in glioblastomas is mediated through negative regulation of p53, p21, and PAI1. Neuro Oncol. 2014;16:191-203. [RCA] [PubMed] [DOI] [Full Text] [Cited by in Crossref: 38] [Cited by in RCA: 41] [Article Influence: 3.4] [Reference Citation Analysis (0)] |
| 47. | Hardwick JC, Van Den Brink GR, Bleuming SA, Ballester I, Van Den Brande JM, Keller JJ, Offerhaus GJ, Van Deventer SJ, Peppelenbosch MP. Bone morphogenetic protein 2 is expressed by, and acts upon, mature epithelial cells in the colon. Gastroenterology. 2004;126:111-121. [RCA] [PubMed] [DOI] [Full Text] [Cited by in Crossref: 199] [Cited by in RCA: 199] [Article Influence: 9.5] [Reference Citation Analysis (0)] |
| 48. | Kodach LL, Wiercinska E, de Miranda NF, Bleuming SA, Musler AR, Peppelenbosch MP, Dekker E, van den Brink GR, van Noesel CJ, Morreau H. The bone morphogenetic protein pathway is inactivated in the majority of sporadic colorectal cancers. Gastroenterology. 2008;134:1332-1341. [PubMed] |
| 49. | Haramis AP, Begthel H, van den Born M, van Es J, Jonkheer S, Offerhaus GJ, Clevers H. De novo crypt formation and juvenile polyposis on BMP inhibition in mouse intestine. Science. 2004;303:1684-1686. [RCA] [PubMed] [DOI] [Full Text] [Cited by in Crossref: 563] [Cited by in RCA: 565] [Article Influence: 26.9] [Reference Citation Analysis (0)] |
| 50. | Howe JR, Bair JL, Sayed MG, Anderson ME, Mitros FA, Petersen GM, Velculescu VE, Traverso G, Vogelstein B. Germline mutations of the gene encoding bone morphogenetic protein receptor 1A in juvenile polyposis. Nat Genet. 2001;28:184-187. [RCA] [PubMed] [DOI] [Full Text] [Cited by in Crossref: 463] [Cited by in RCA: 442] [Article Influence: 18.4] [Reference Citation Analysis (0)] |
| 51. | Zhao J, Sun BK, Erwin JA, Song JJ, Lee JT. Polycomb proteins targeted by a short repeat RNA to the mouse X chromosome. Science. 2008;322:750-756. [PubMed] |
| 52. | Hirota K, Miyoshi T, Kugou K, Hoffman CS, Shibata T, Ohta K. Stepwise chromatin remodelling by a cascade of transcription initiation of non-coding RNAs. Nature. 2008;456:130-134. [RCA] [PubMed] [DOI] [Full Text] [Cited by in Crossref: 200] [Cited by in RCA: 215] [Article Influence: 12.6] [Reference Citation Analysis (0)] |
| 53. | Rinn JL, Kertesz M, Wang JK, Squazzo SL, Xu X, Brugmann SA, Goodnough LH, Helms JA, Farnham PJ, Segal E. Functional demarcation of active and silent chromatin domains in human HOX loci by noncoding RNAs. Cell. 2007;129:1311-1323. [RCA] [PubMed] [DOI] [Full Text] [Cited by in Crossref: 3230] [Cited by in RCA: 3368] [Article Influence: 187.1] [Reference Citation Analysis (0)] |
| 54. | Yap KL, Li S, Muñoz-Cabello AM, Raguz S, Zeng L, Mujtaba S, Gil J, Walsh MJ, Zhou MM. Molecular interplay of the noncoding RNA ANRIL and methylated histone H3 lysine 27 by polycomb CBX7 in transcriptional silencing of INK4a. Mol Cell. 2010;38:662-674. [RCA] [PubMed] [DOI] [Full Text] [Cited by in Crossref: 1037] [Cited by in RCA: 1074] [Article Influence: 71.6] [Reference Citation Analysis (0)] |
| 55. | Kotake Y, Nakagawa T, Kitagawa K, Suzuki S, Liu N, Kitagawa M, Xiong Y. Long non-coding RNA ANRIL is required for the PRC2 recruitment to and silencing of p15(INK4B) tumor suppressor gene. Oncogene. 2011;30:1956-1962. [RCA] [PubMed] [DOI] [Full Text] [Cited by in Crossref: 744] [Cited by in RCA: 803] [Article Influence: 53.5] [Reference Citation Analysis (0)] |


