Copyright
©The Author(s) 2016.
World J Biol Chem. Feb 26, 2016; 7(1): 188-205
Published online Feb 26, 2016. doi: 10.4331/wjbc.v7.i1.188
Published online Feb 26, 2016. doi: 10.4331/wjbc.v7.i1.188
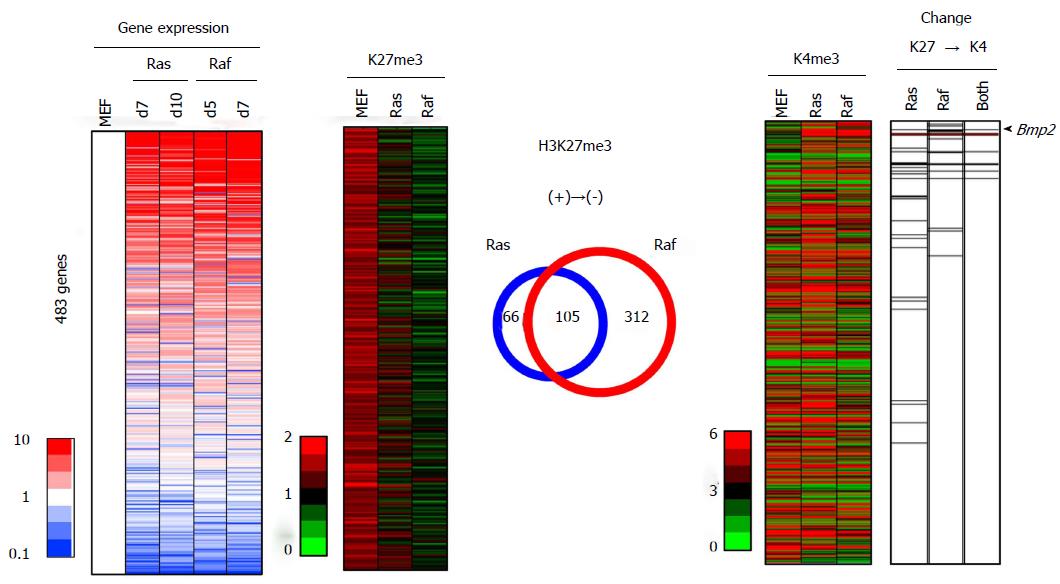
Figure 9 Integrated analysis of epigenetic and expression changes for genes losing H3K27me3.
A total of 483 genes showed > 1.5 reads per 1000000 reads in MEF, but decreased to < 1.0 in both or either Ras- and Raf-induced senescence, and were sorted by the fold expression change between MEF and mean of RasG12V cells and RafV600E cells (left). Among these 483 genes losing H3K27me3 in senescence, 27 genes in Ras-induced senescence and 18 genes in Raf-induced senescence showed loss of H3K27me3 and gain of H3K4me3 (with increase from < 3.0 reads in MEF to > 3.5 reads in senescence) simultaneously, and 9 genes showed a simultaneous H3K27me3 loss and H3K4me3 gain in both Ras- and Raf-induced senescence (right). These genes showed a significant enrichment in upregulated genes among the 483 genes (P = 1 × 10⁻⁵ in Ras-induced senescence, P = 2 × 10⁻⁹ in Raf-induced senescence, and P = 2 × 10⁻⁸ in both senescence, Kolmogorov-Smirnov test), and included Bmp2 (arrow head). Regarding the overlap of H3K27me3 alterations (center), 171 genes with H3K27me3 loss in Ras-induced senescence and 417 genes with H3K27me3 loss in Raf-induced senescence overlapped well (105 genes, P < 1 × 10-15, phi coefficient = 0.386).
- Citation: Fujimoto M, Mano Y, Anai M, Yamamoto S, Fukuyo M, Aburatani H, Kaneda A. Epigenetic alteration to activate Bmp2-Smad signaling in Raf-induced senescence. World J Biol Chem 2016; 7(1): 188-205
- URL: https://www.wjgnet.com/1949-8454/full/v7/i1/188.htm
- DOI: https://dx.doi.org/10.4331/wjbc.v7.i1.188


