Copyright
©The Author(s) 2016.
World J Biol Chem. Feb 26, 2016; 7(1): 188-205
Published online Feb 26, 2016. doi: 10.4331/wjbc.v7.i1.188
Published online Feb 26, 2016. doi: 10.4331/wjbc.v7.i1.188
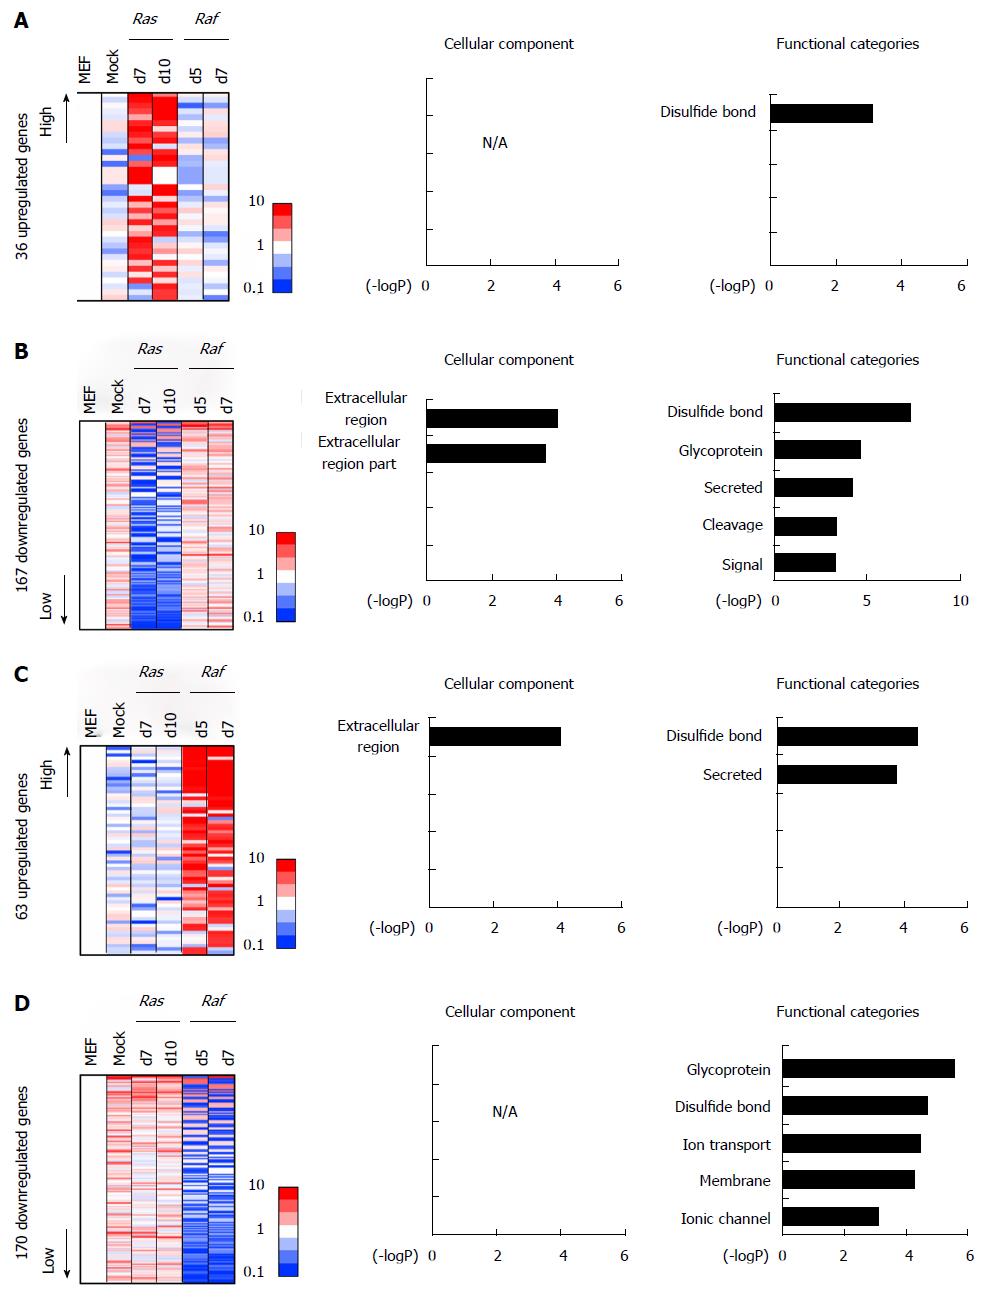
Figure 6 Gene annotation enrichment analysis for specifically altered genes.
A: Genes specifically upregulated in Ras-induced senescence. A total of 36 genes showed > 5-fold expression in either of the two RasG12V cells, but showed < 1.5-fold expression in both RafV600E cells and in mock cells, compared with MEF cells. Gene annotation enrichment analysis did not reveal any significant enrichment of GO-terms other than “disulfide bond”; B: Genes specifically downregulated in Ras-induced senescence. A total of 167 genes showed < 0.2-fold expression in either of the two RasG12V cells, but showed > 0.65-fold expression in both RafV600E cells and in mock cells, compared with MEF cells. Gene annotation enrichment was analyzed, showing a significant enrichment of genes associated with signal/secreted factors, e.g., Wnt; C: Genes specifically upregulated in Raf-induced senescence. A total of 63 genes showed > 5-fold expression in either of the two RafV600E cells, but showed < 1.5-fold expression in both RasG12V cells and in mock cells, compared with MEF cells. Gene annotation enrichment analysis showed significant enrichment of genes associated with secreted proteins, e.g., Cd40; D: Genes specifically downregulated in Raf-induced senescence. A total of 170 genes showed < 0.2-fold expression in either of the two RafV600E cells, but showed > 0.65-fold expression in both RasG12V cells and in mock cells, compared with MEF cells. Gene annotation enrichment analysis showed a significant enrichment of genes related to membrane, e.g., Mcam. MEF: Mouse embryonic fibroblast.
- Citation: Fujimoto M, Mano Y, Anai M, Yamamoto S, Fukuyo M, Aburatani H, Kaneda A. Epigenetic alteration to activate Bmp2-Smad signaling in Raf-induced senescence. World J Biol Chem 2016; 7(1): 188-205
- URL: https://www.wjgnet.com/1949-8454/full/v7/i1/188.htm
- DOI: https://dx.doi.org/10.4331/wjbc.v7.i1.188


