Copyright
©The Author(s) 2016.
World J Biol Chem. Feb 26, 2016; 7(1): 188-205
Published online Feb 26, 2016. doi: 10.4331/wjbc.v7.i1.188
Published online Feb 26, 2016. doi: 10.4331/wjbc.v7.i1.188
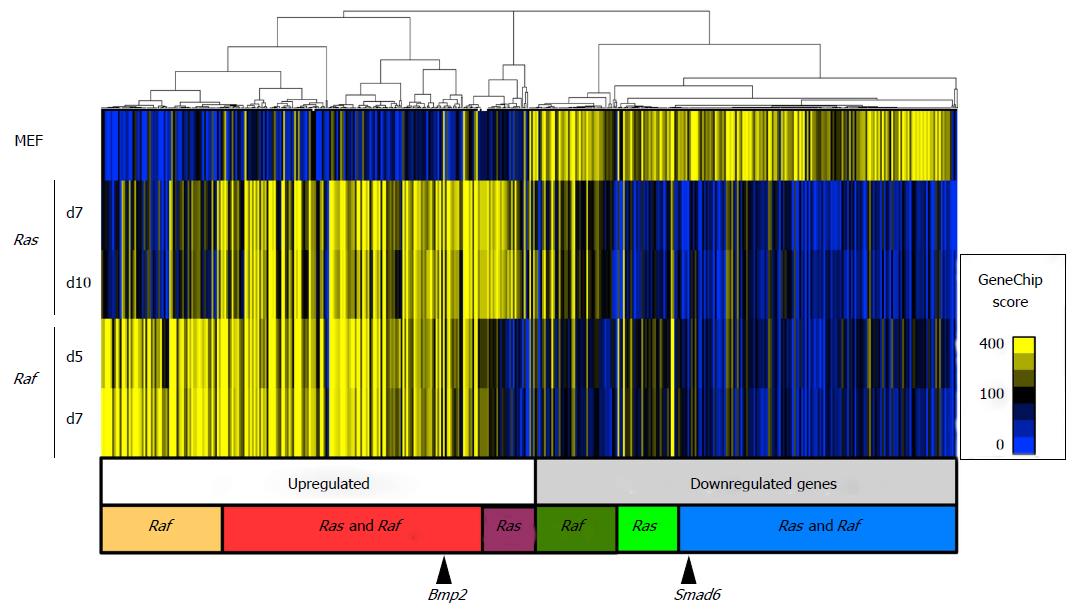
Figure 2 Hierarchical clustering analysis of genes altering expression levels during senescence.
Gene expression levels were analyzed for 15653 genes using microarray for MEF cells, and RafV600E cells on days 5 and 7. For senescence induced by oncogenic Ras (RasG12V), RasG12V cells on days 7 and 10 were analyzed in our previous study, and compared with Raf. A total of 729 probes showing an expression level higher than 100 in GeneChip score in any of the five samples, and showing either > 5-fold upregulation or > 0.2-fold downregulation in any RafV600E or RasG12V samples compared with MEF, were extracted for clustering analysis. The major cluster for upregulated genes consisted of three subclusters: Genes upregulated specifically in Raf-induced senescence, those commonly upregulated in Ras- and Raf-induced senescence, and those upregulated specifically in Ras-induced senescence. The other major cluster for downregulated genes also contained three subgroups of genes, albeit not very clear: Genes downregulated specifically in Raf-induced senescence or Ras-induced senescence, and those commonly downregulated in Ras- and Raf-induced senescence. Bmp2 was included in commonly upregulated genes and Smad6 was included in commonly downregulated genes (black arrows). MEF: Mouse embryonic fibroblast.
- Citation: Fujimoto M, Mano Y, Anai M, Yamamoto S, Fukuyo M, Aburatani H, Kaneda A. Epigenetic alteration to activate Bmp2-Smad signaling in Raf-induced senescence. World J Biol Chem 2016; 7(1): 188-205
- URL: https://www.wjgnet.com/1949-8454/full/v7/i1/188.htm
- DOI: https://dx.doi.org/10.4331/wjbc.v7.i1.188


