Copyright
©The Author(s) 2016.
World J Diabetes. Dec 15, 2016; 7(20): 572-598
Published online Dec 15, 2016. doi: 10.4239/wjd.v7.i20.572
Published online Dec 15, 2016. doi: 10.4239/wjd.v7.i20.572
Figure 1 Global overweight and obesity trends and projections.
If recent trends continue unabated, by 2030, 38% and 20% of the world’s adult population are projected to be overweight or obese respectively[8].
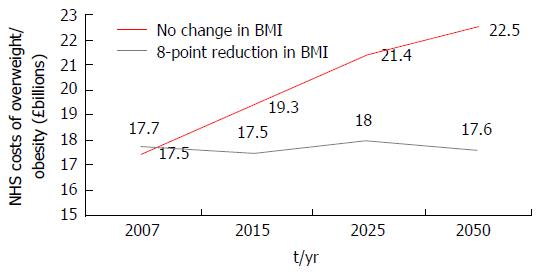
Figure 2 Projected trends in National Health Service costs from a micro-simulation model.
A computer based micro-simulation model[18] predicted the direct healthcare related costs of overweight and obesity in the United Kingdom at five time points from 2001 (2001, 2007, 2015, 2025 and 2050) should prevalence of overweight and obesity remain constant (red) or if an average of an 8-point BMI reduction was achieved in all those obese in 2001 (grey). BMI: Body mass index; NHS: National Health Service.
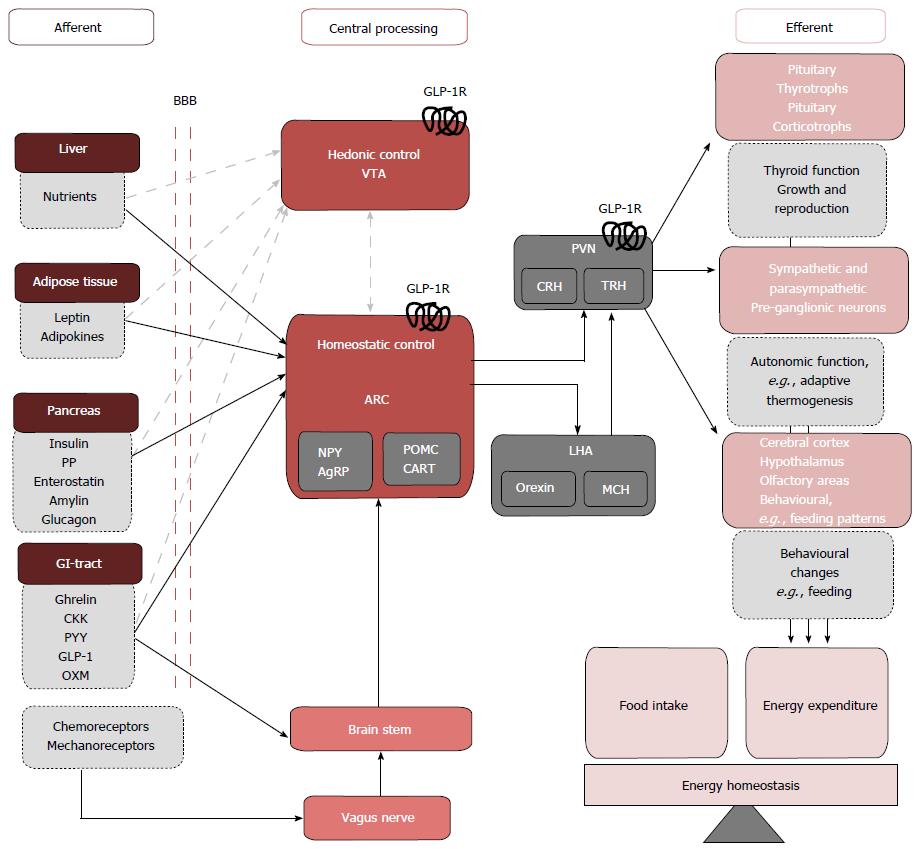
Figure 3 The hedonic and homeostatic controls of energy balance.
Peripheral signals from the Liver, adipose tissue pancreas, GI-tract cross the BBB to directly signal to neurons of the ARC of the hypothalamus. GI-tract enteroendocrine hormones and chemo- and mechanoreceptor neural afferents can also indirectly activate the ARC via the vagus nerve and brainstem. The net output of the ARC neurons is relayed to second order intrahypothalmic neurons in the PVN, and LHA that express the MC4R. GLP-1Rs have been localized pre-clinically in the ARC and PVN[50,51], stimulation of theses receptors inducing reductions in food intake and weight loss potentially through efferent pathways that involve the activation of TRH and CRH expressing neurons and pre-ganglionic sympathetic and parasympathetic neurons. Feeding and meal termination are also influenced by hedonic, reward-related factors centrally processed in the VTA. Though the interactions between peripheral nutrient signals and rewards neurocircuitry are not extensively defined (grey dashed arrows) GLP-1Rs have been localized pre-clinically in the VTA[52]. Previously considered as separate entities, severe cross-interactions exist between central homeostatic and hedonic control centres[53]. This communication may be mediated by central GLP-1 signalling[36,37,54]. GI-tract: Gastrointestinal tract; BBB: Blood-brain barrier; ARC: Arcuate nucleus; PVN: Paraventricular nucleus; LHA: Lateral hypothalamic area; MC4R: Melanocortin 4 receptor; TRH: Thyrotrophin releasing hormone; CRH: Corticotrophin releasing hormone; VTA: Ventral tegmental area; PP: Pancreatic polypeptide; CKK: Cholecystokinin; PYY: Polypeptide-YY; OXM: Oxymodulin.
Figure 4 Post-translational tissue specific processing of proglucagon[70-72].
The 160 amino acid pro-glucagon gene (GCG) encoded on chromosome 2 undergoes tissue specific post-translational cleavage by prohormone convertase (PC) 1/3 and PC2 in central and peripheral sites. This figure shows the major cleavage products of the GCG with numbers indicating the amino acids between which the hormone product lies and at which the PC enzymes act. In the pancreas, PC2 dominates and liberates glucagon. In the intestine PC 1/3 activity dominates and produces GLP-1, of note, the other products of proglucagon cleavage by PC1/3 are produced in a 1:1 ratio with GLP-1[73,74]. The PC responsible for cleaving GCG in the central nervous system is not well established; both PC1/3 and PC2 may play a role. GLP: Glucagon-like peptide; GRP1: Gastrin-releasing peptide 1; IP2: Intervening peptide 1/2.
Figure 5 Mechanisms of glucagon-like peptide 1 release from enteroendocrine L cell.
Glucagon-like peptide 1 (GLP-1) release from L-cells is regulated by direct nutrient sensing via receptors and channels on apical processes or indirectly via neuro-hormonal mechanisms[70,71,86,87]. A: Nutrient signals. Carbohydrates: Glucose derived from carbohydrate metabolism is the most potent stimuli for GLP-1 secretion. Glucose can trigger GLP-1 release by two mechanisms: (1) the sodium-glucose cotransporter-1 (SGLT-1) couples the transport of glucose with Na ions. Na = influx leads to membrane depolarization (ΔΨ) (red arrows); and (2) glucose metabolism generates adenosine triphosphate (ATP). Elevated intracellular ATP concentrations [ATP]i close KATP channels and leads to membrane depolarization (ΔΨ) (green arrows). Both routes to membrane depolarisation increase intracellular Ca levels ([Ca2+]i) by opening L-type Ca channels. Elevated [Ca2+]i triggers the exocytosis of GLP-1 secretory granules located at the basolateral surface of the enteroendocrine L cell (dashed lines). Fats: Fats are potent stimuli for GLP-1 secretion. Free fatty acids (FFA) (blue arrows) interact with G-protein coupled receptors (GPCRs) that trigger Ca2+ release from internal stores and also activate protein kinase C (PKC). FFA derivates (purple arrows) interact with GPCRs that activate second messenger systems involving adenylate cyclase (AC) and cyclic AMP (cAMP) which increases [Ca2+]i. Bile acids (orange arrows) and short chained fatty acids (not shown) also increase [Ca2+]i by GPCR interactions. Proteins: Protein is a weak stimulator of GLP-1 release when compared with sugars and lipids. Amino acids (AA) derived from protein breakdown are transported intracelluarly with Na+via Na+ dependent AA transporters. Na+ influx causes membrane depolarization and elevated [Ca2+]i with resultant GLP-1 exocytosis (pink arrows); B: Hormonal signals. Somatostatin inhibits GLP-1 release by blocking AC activation (light blue arrows). The peripheral adiposity signals leptin (yellow arrows) and insulin (brown arrows) are thought to stimulate GLP-1 release via activation of mitogen-activated protein kinase (MAPK) signalling pathway; C: Neural signals. Acetylcholine binding to muscarinic receptors (M1R, M2R) elevates [Ca2+]I stimulating GLP-1 release (grey arrows). GRP is though to stimulate GLP-1 release in association with the activation of mitogen activated protein kinase kinase (MAPKK) and subsequent phosphorylation and activation of MAPK (not shown).
Figure 6 Central and peripheral effects of glucagon-like peptide 1.
Ex vivo and in vivo studies in rodents, and observational and interventional studies in man have allowed the characterization of numerous central and peripheral effects of GLP-1. Peripheral effects of GLP-1 may be classed broadly as pancreatic or extra-pancreatic. Pancreatic effects of GLP-1 act to promote insulin secretion (incretin effect). Extra-pancreatic effects of GLP-1 include: (1) regulation of energy metabolism and nutrient storage (liver, muscle and fat); (2) efficient nutrient handling (stomach and GIT); and (3) others: Cardiovascular repair, blood pressure control, diuresis[86]. VLDL: Very low-density lipoproteins; GLP-1: Glucagon-like peptide 1; GIT: Gastrointestinal tract; CNS: Central nervous system.
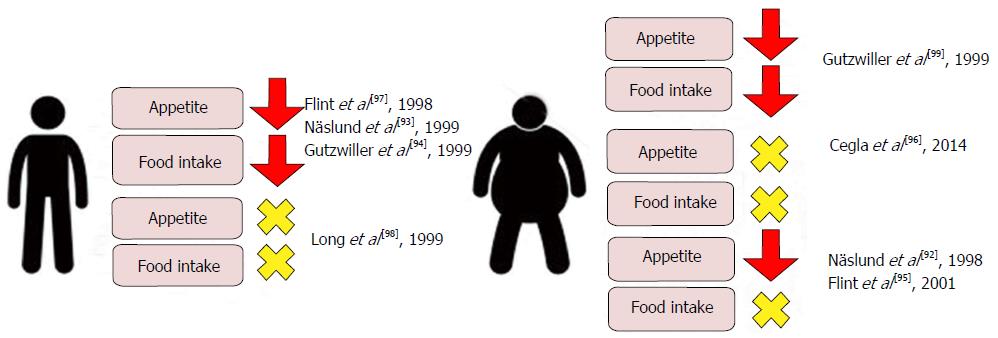
Figure 7 Effects on Visual Analogue Scale assessed appetite scores and ad libitum food intake in lean and obese subjects following physiological and supraphysiological[92-99] infusions of glucagon-like peptide 1.
Though individual studies report conflicting data, a meta-analysis of clinical studies evaluating the acute effects of GLP-1 infusion on food intake reports a mean 11.7% decrease when compared with saline control[100]. GLP-1: Glucagon-like peptide 1.
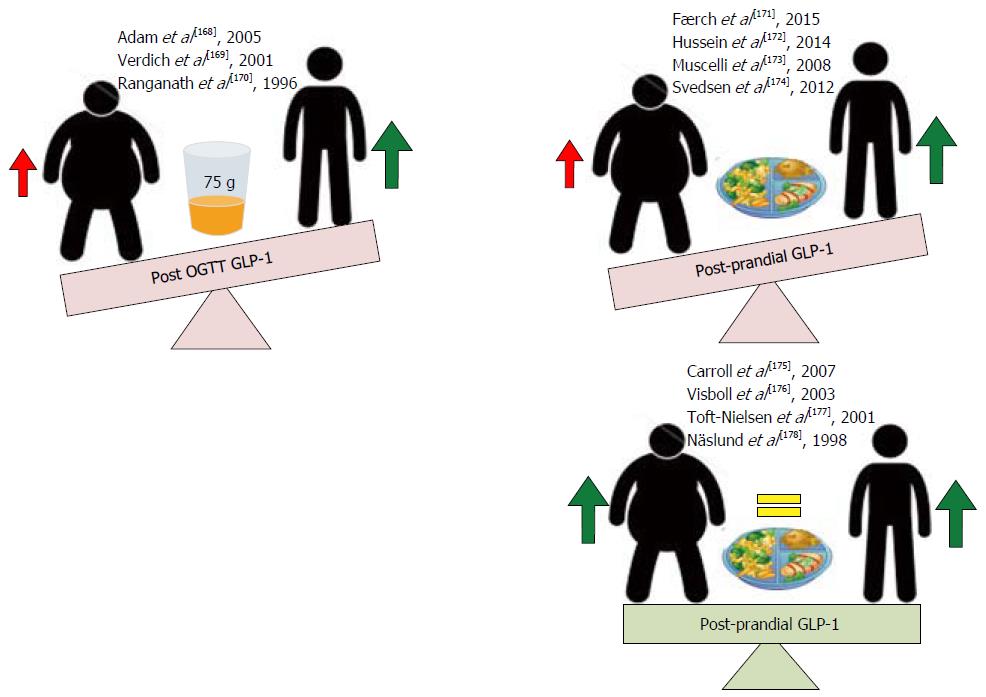
Figure 8 Effects of obesity on glucagon-like peptide 1 responses post oral glucose load and post-prandial.
Obese subjects consistently demonstrate reduced glucagon-like peptide 1 (GLP-1) secretory responses following a 75-g oral glucose load compared to lean controls. Post-prandial GLP-1 secretory responses in obese subjects are conflicting, with some studies observing significant reductions and others observing no change[168-178] when compared to lean controls.
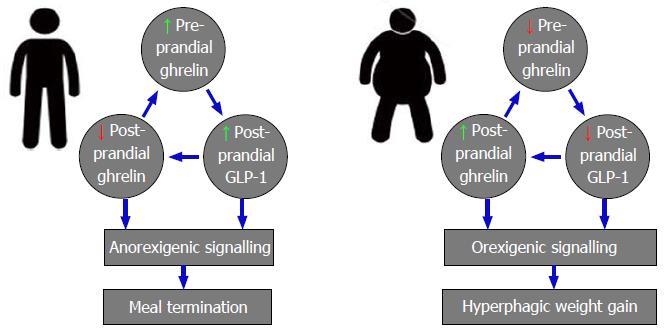
Figure 9 Physiological and pathophysiological interactions between orexigenic ghrelin and anorexigenic glucagon-like peptide 1 signalling in lean and obese individuals.
GLP-1: Glucagon-like peptide 1.
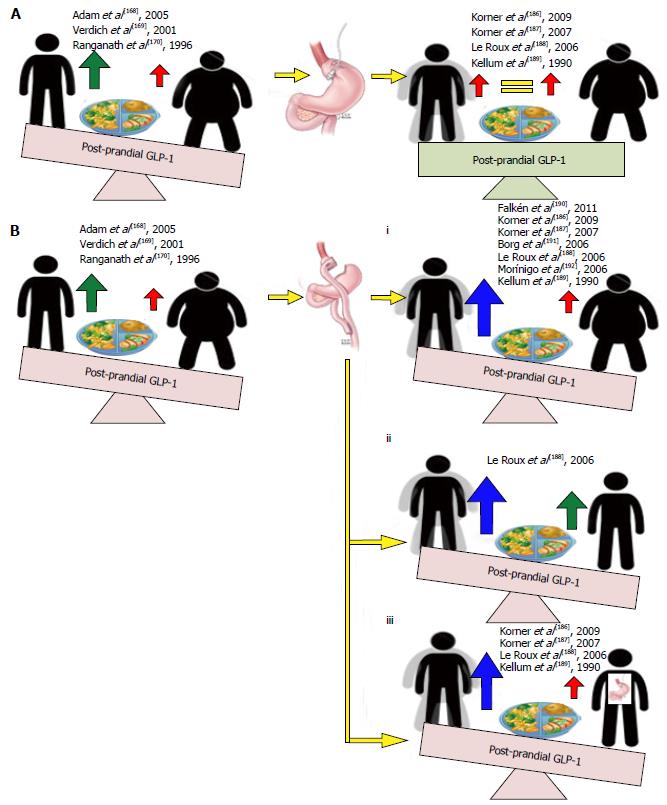
Figure 10 Effects of weight loss induced by gastric banding and Roux-en-Y gastric bypass on post-prandial glucagon-like peptide 1 secretion.
Weight loss following gastric banding induces no changes in post-prandial glucagon-like peptide 1 (GLP-1) levels from pre-operative levels (A). All 7 studies assessing the effects of post-prandial GLP-1 secretion following weight loss with RYGB show significantly increased responses compared with pre-surgery responses and healthy obese controls (Bi), healthy lean controls (Bii) and following weight losses following gastric banding (Biii).
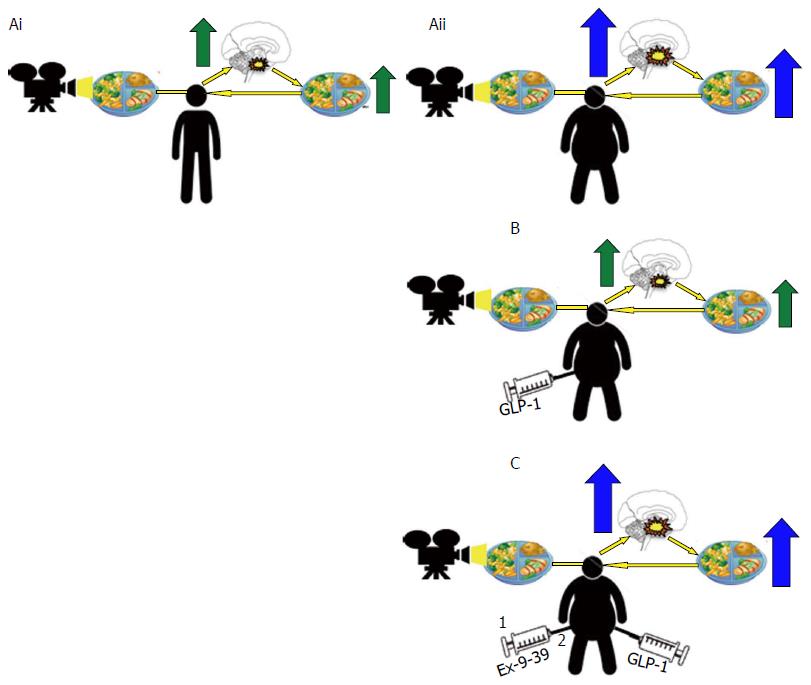
Figure 11 Altered central nervous system responses in brain regions involved in rewards in obese subjects is reversed upon glucagon-like peptide 1 receptor activation.
Central nervous system activity in regions involved in rewards processing show increased responses in obese subjects when exposed to food related images (Aii) associated with increased ad libitum food consumption when compared to healthy lean control (Ai). A response reversed upon administration of a GLP-1 analogue with concomitant reductions in ad libitum food intake (B), this effect antagonized by pre-treatment with GLP-1 antagonist Extendin 9-39 (EX9-39) (C). GLP-1: Glucagon-like peptide 1.
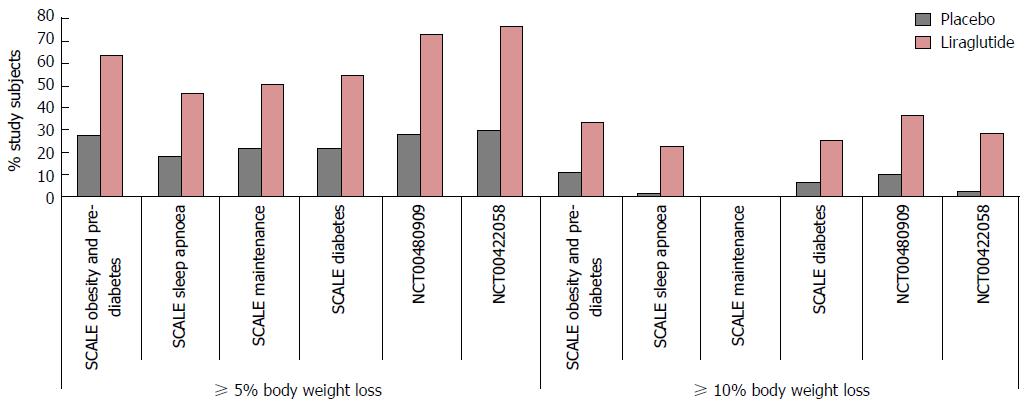
Figure 12 Significantly greater 5% and 10% weight loss achieved following 3 mg subcutaneous liraglutide compared to placebo and orlistat.
Five percent and 10% responder rates in NCT00480909 reported at 1 year (see text).
Figure 13 Body weight changes with liraglutide are treatment dependent.
Following the 56-wk treatment period a 12-wk follow-up (FUP) was conducted in SCALE maintenance, SCALE obesity and pre-diabeties and SCALE diabetes trials. Twelve weeks FUP was an off-treatment period in SCALE Maintenance and SCALE diabetes. In SCALE Obesity and pre-diabetes FUP period involved a re-randomisation to either 3 mg liraglutide (LIR/LIR) or placebo (LIR/Pl) and though weight gain occurred in all three groups weight gain was significantly higher following cessation of liraglutide. T2DM: Type 2 diabetes mellitus.
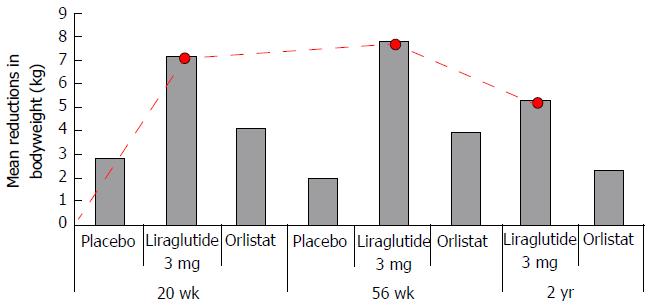
Figure 14 Liraglutide 3 mg shows greater, dose dependent, reductions in body weight compared to placebo and orlistat with maximal effect between 0-20 wk of treatment.
Red line dotted trace shows patters of weight loss from baseline in those subjects treated with 3 mg liraglutide. Greatest rate of weight loss was observed between 0-20 wk, reducing from 20-36 with a tendency toward weight gain from 36 wk and beyond.
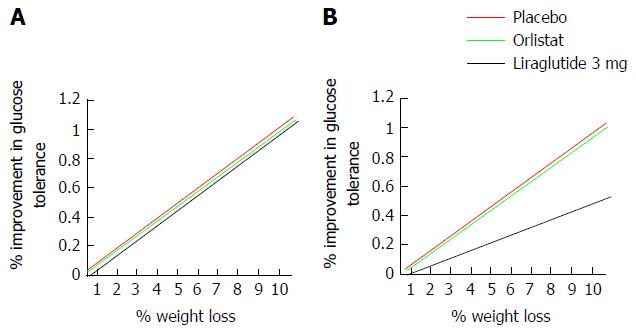
Figure 15 Theoretic model to assess glucose tolerance as a factor of weight.
Liraglutide 3 mg produces increased weight loss and increased improvements in glucose control compared to both placebo and control in non-diabetic obese and overweight subjects[41-43,205,206]. If the greater glucose sensitivity seen following treatment with liraglutide 3 mg is secondary to the greater weight loss achieved, the relationship between a given weight reduction and the percentage improvement in glucose tolerance should be the same in all treatment groups (A). If however, the relationship between a given weight loss and change in glucose tolerance is less strong (B) following treatment with liraglutide, findings would suggest that mechanisms beyond weight loss contribute to the greater improvements of glucose tolerance seen following GLP-1 agonism. One mechanism may be via activation of GLP-1R in the pancreas, where endogenous GLP-1 signalling has a well established incretin effect. GLP-1: Glucagon-like peptide 1.
Figure 16 Adverse drug reactions reported in ≥ 10% of liraglutide 3 mg recipients with a higher incidence than placebo stratified by system.
GI: Dyspepsia, abdominal pain, dry mouth, gastritis, gastroesophageal reflux disease, flatulence, eructation and abdominal distension were also more prevalent in liraglutide treated participants but occurred with incidence ≤ 10%, not shown; 6.2% with Saxenda vs 0.8% with placebo discontinued treatment as a result of gastrointestinal adverse reactions; CNS: Dizziness, malaise and fatigue occurred were more also prevalent in liraglutide treated participants but occurred with incidence ≤ 10%, not shown; Metabolic: Liraglutide reduces blood glucose and thus, there is a potential for hypoglycaemia to occur. In the SCALE diabetes trial severe hypoglycemia occurred in 3 (0.7%) of 422 Saxenda-treated patients and in none of the 212 placebo-treated patients. In clinical trials involving patients without T2DM[42,43,205,206] no systematic reporting of hypoglycemia occurred but spontaneously reported symptomatic episodes potentially hypoglycemic in cause were reported by 1.6% (46/2962) of liraglutide 3 mg and 1.1% of (19/1729) placebo treated non diabetic patients. T2DM: Type 2 diabetes mellitus; GI: Gastrointestinal; CNS: Central nervous system.
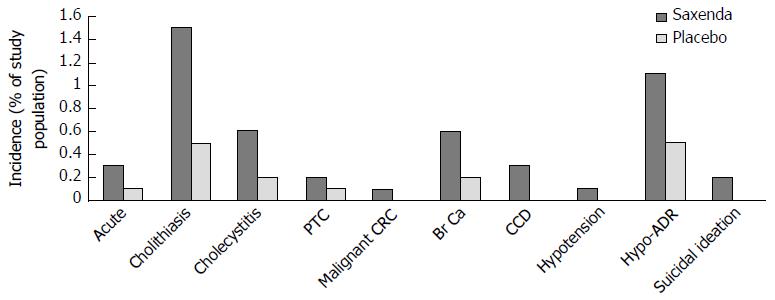
Figure 17 Reported incidences of serious medical conditions from pooled analyses of 5 double-blinded placebo controlled trials studying the safety and efficacy of 3 mg liraglutide (Saxenda) in 3384 overweight or obese subjects receiving liraglutide and 1941 placebo controls.
Hypotension associated adverse reactions (Hypo-ADR) refer to hypotension, orthostatic hypotension, circulatory collapse, and decreased blood pressure). One of the six (0.2%) liraglutide treated subjects reporting suicidal ideations attempted suicide. PTC: Papillary thyroid carcinoma; CRC: Colorectal carcinoma; Br Ca: Breast cancer; CCD: Cardiac conduction disorders.
- Citation: Anandhakrishnan A, Korbonits M. Glucagon-like peptide 1 in the pathophysiology and pharmacotherapy of clinical obesity. World J Diabetes 2016; 7(20): 572-598
- URL: https://www.wjgnet.com/1948-9358/full/v7/i20/572.htm
- DOI: https://dx.doi.org/10.4239/wjd.v7.i20.572


