
















Copyright: ©Author(s) 2026.
World J Diabetes. Nov 15, 2026; 17(11): 124042
Published online Nov 15, 2026. doi: 10.4239/wjd.124042
Published online Nov 15, 2026. doi: 10.4239/wjd.124042
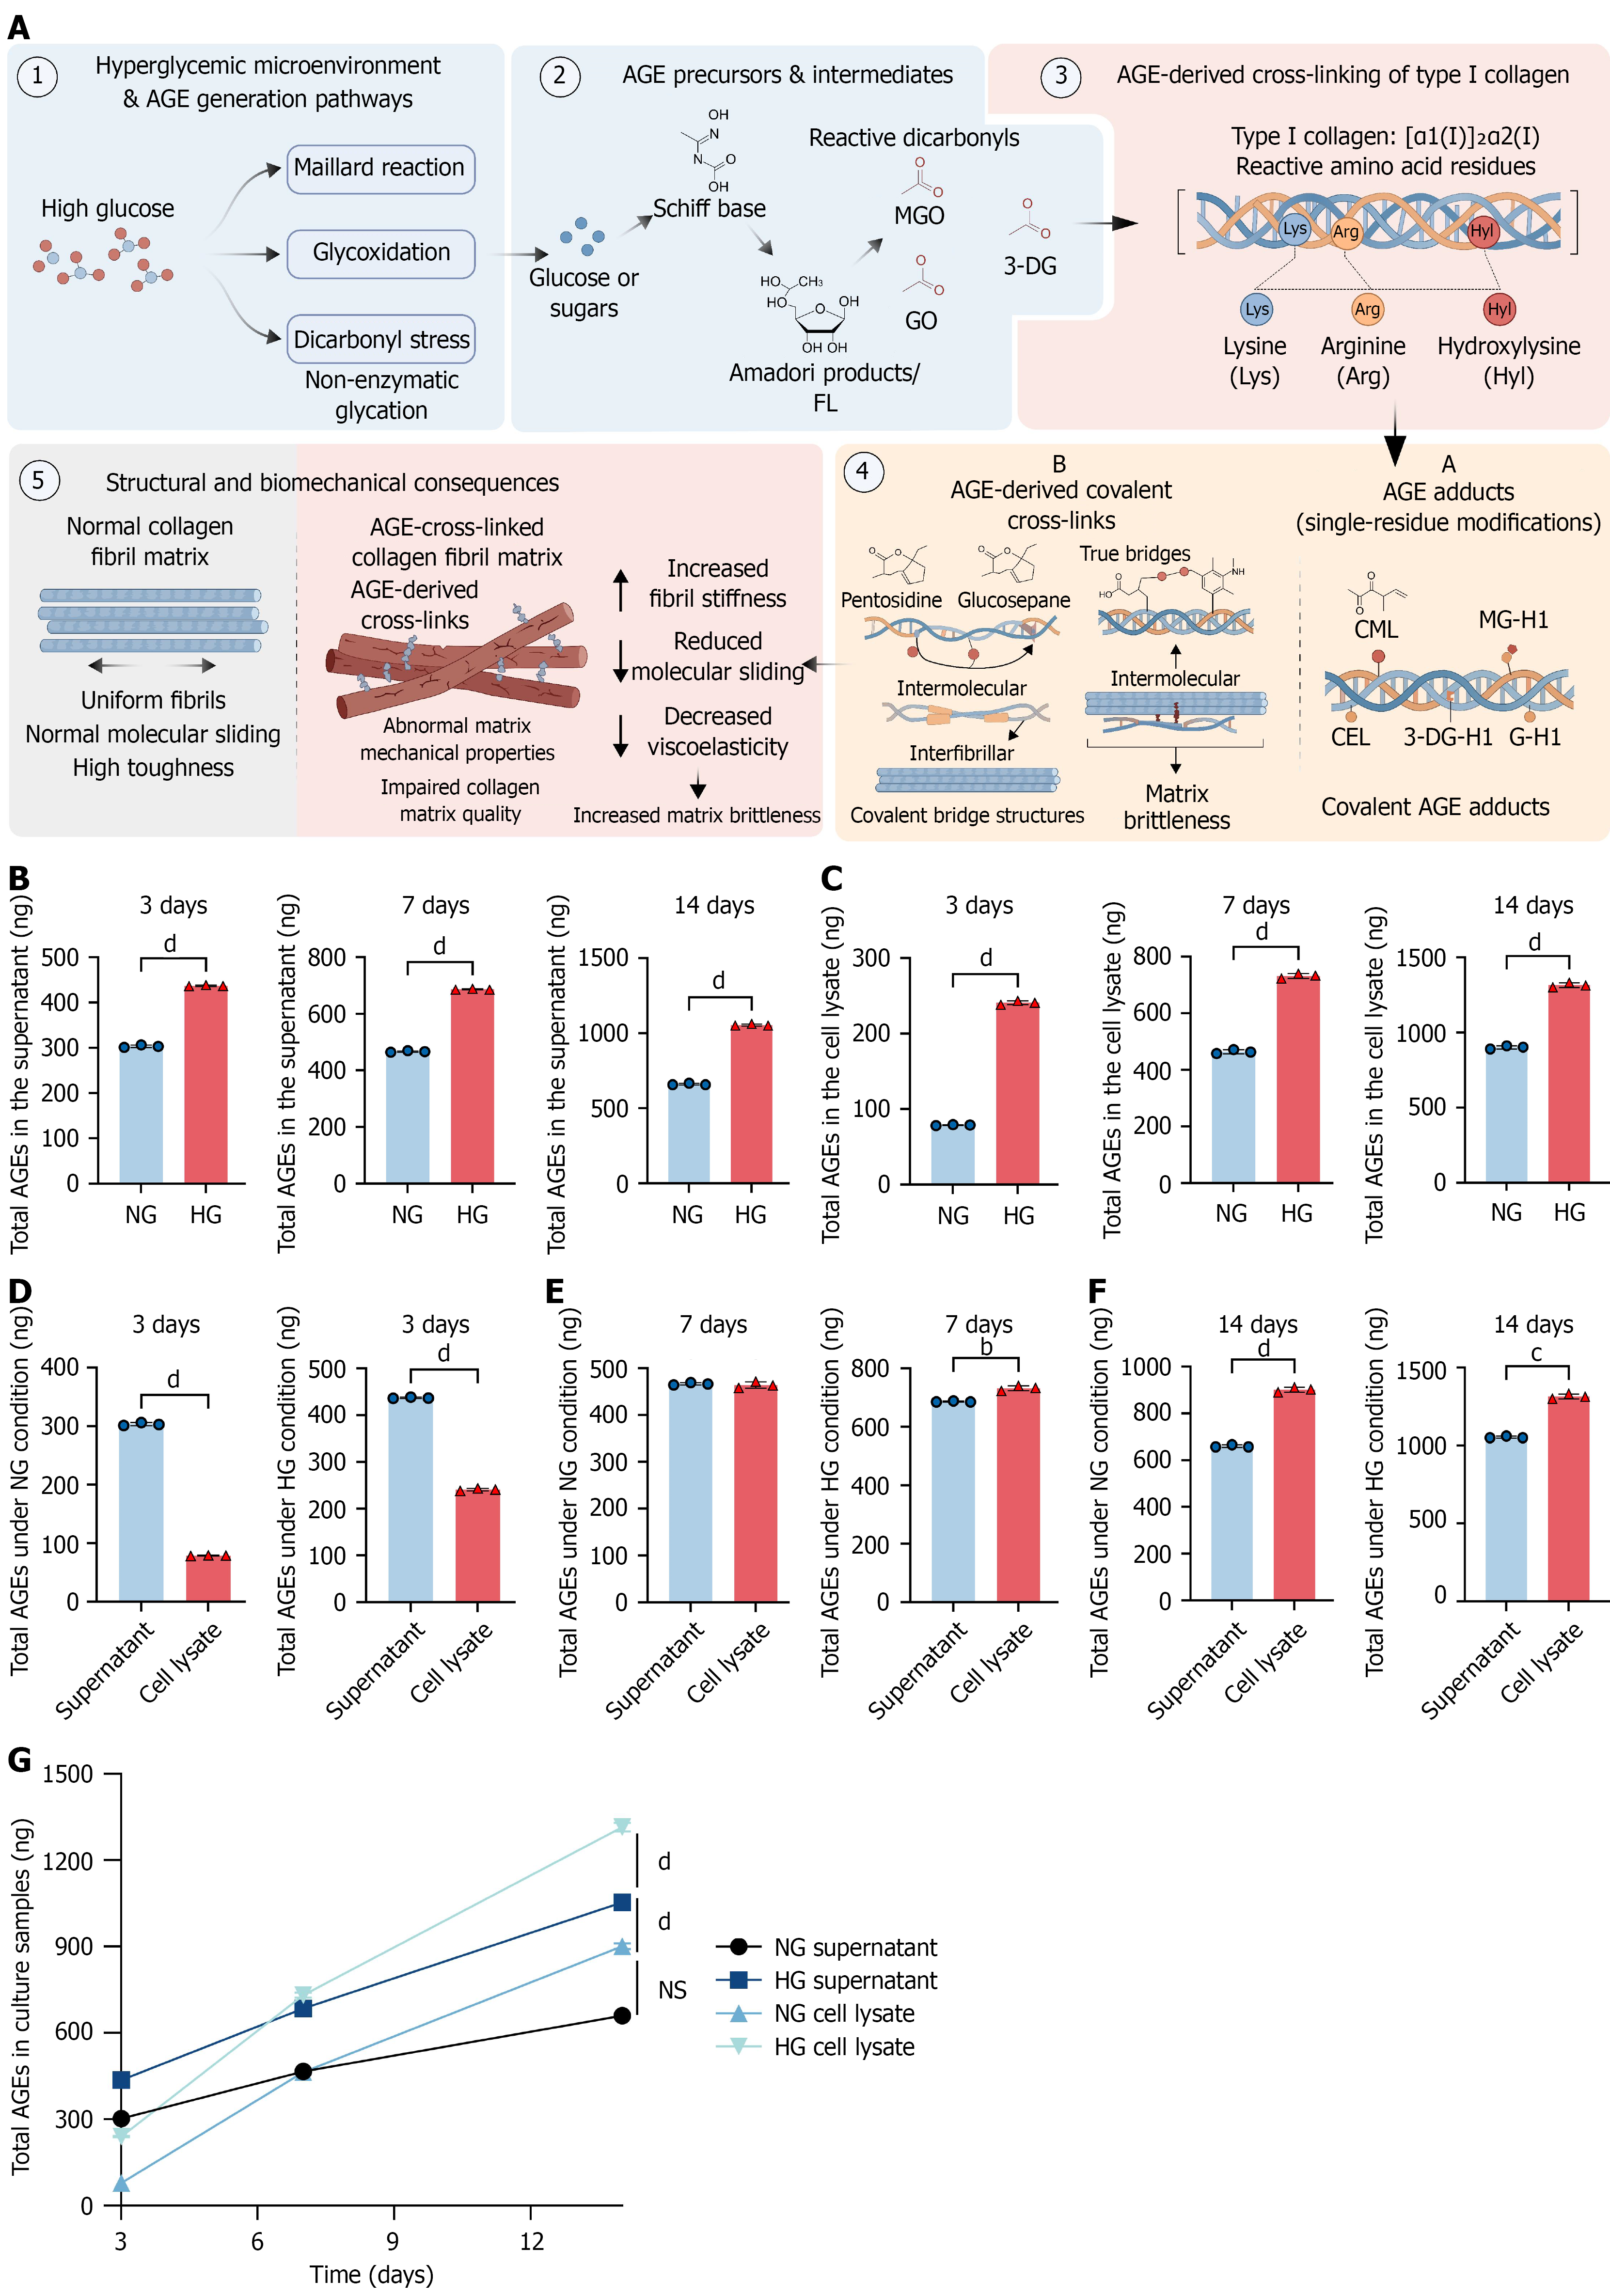
Figure 1 Advanced glycation end product levels under normal- and high-glucose culture conditions in MC3T3-E1 cells.
A: Conceptual schematic showing biochemical routes by which a high-glucose environment may favor advanced glycation end product (AGE) formation and type I collagen modification. Schiff bases, Amadori products, methylglyoxal, glyoxal, and 3-deoxyglucosone may modify collagen residues and generate AGE adducts or crosslinks. This panel presents conceptual background; specific collagen adducts and crosslinks were not measured in this study; B: AGE levels in culture supernatants from MC3T3-E1 cells cultured under normal-glucose (NG) (5.5 mmol/L) or high-glucose (HG) (25 mmol/L) conditions for 3 days, 7 days, or 14 days, measured by enzyme-linked immunosorbent assay; C: AGE levels in cell lysates under the corresponding conditions; D-F: Comparison of AGE levels between culture supernatants and cell lysates on days 3, 7, and 14, respectively; G: Time-course changes in AGE levels in NG supernatants, NG lysates, HG supernatants, and HG lysates. Cultures containing 25 mmol/L glucose showed higher measured AGE levels than cultures containing 5.5 mmol/L glucose. Because no mannitol or L-glucose osmotic control was included, these differences cannot be attributed specifically to glucose metabolism, and an osmotic contribution cannot be excluded. Data are presented as the mean ± SD from three independent biological experiments (n = 3). Two-group comparisons were performed using two-tailed Welch’s t test. Time-course data were analyzed using two-way analysis of variance followed by multiple-comparison adjustment. Non-significant comparisons are not labeled. aP < 0.05. bP < 0.01. cP < 0.001. dP < 0.0001. NS: Non-significant; AGE: Advanced glycation end product; MGO: Methylglyoxal; 3-DG: 3-Deoxyglucosone; GO: Glyoxal; FL: Fructosyllysine; CML: Nε-(carboxymethyl)lysine; CEL: Nε-(carboxyethyl)lysine; G-H1: Glyoxal-derived hydroimidazolone-1; 3-DG-H1: 3-Deoxyglucosone-derived hydroimidazolone-1; MG-H1: Methylglyoxal-derived hydroimidazolone-1; NG: Normal-glucose; HG: High-glucose.
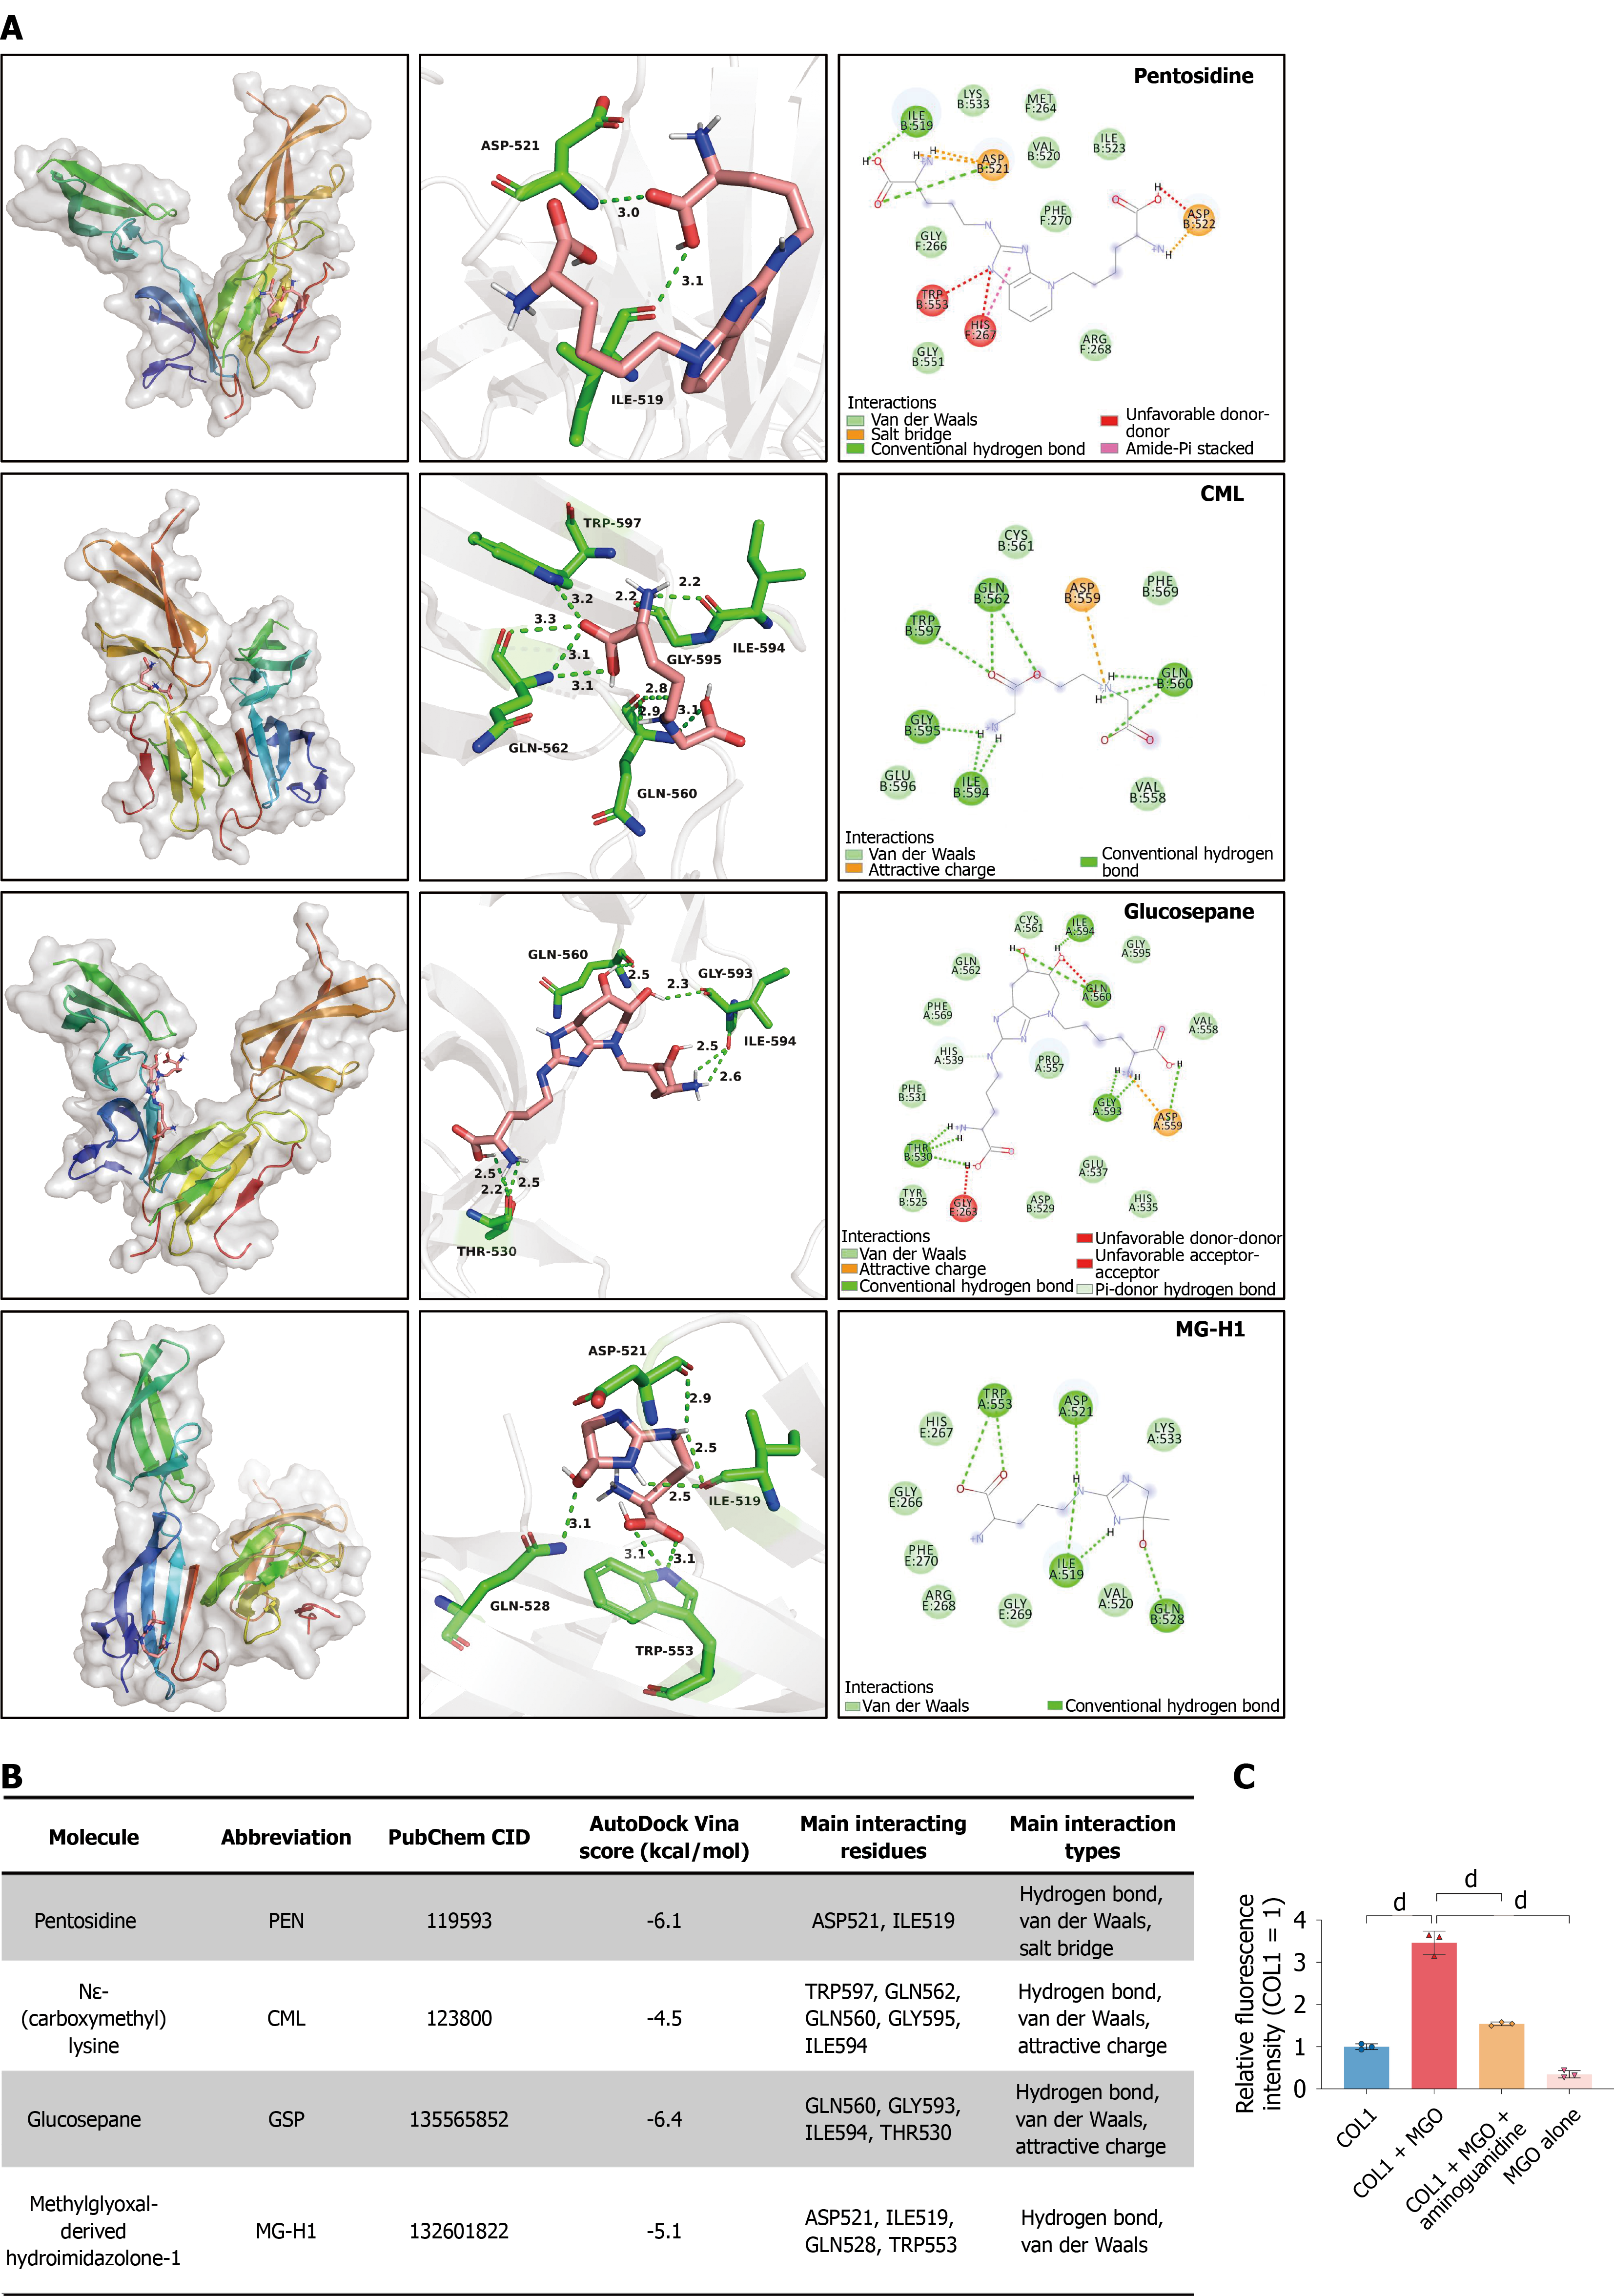
Figure 2 Exploratory non-covalent docking within a fibronectin-collagen peptide complex and methylglyoxal-induced collagen fluorescence.
A: Top-ranked docking poses of pentosidine, Nε-(carboxymethyl)lysine (CML), glucosepane, and methylglyoxal-derived hydroimidazolone-1 (MG-H1) within the crystal structure of a low-affinity collagen site in complex with fibronectin type I domains 8 and 9 (Protein Data Bank accession code: 3GXE). Each row shows the overall predicted pose, local three-dimensional contacts, and two-dimensional interaction diagram. The labeled contacts were predominantly located in fibronectin chains A and B. Specifically, pentosidine contacted aspartate (Asp) 521 and isoleucine (Ile) 519 in chain B; CML contacted tryptophan (Trp) 597, glutamine (Gln) 562, Gln560, glycine (Gly) 595, and Ile594 in chain B; glucosepane contacted Gln560, Gly593, and Ile594 in chain A and threonine 530 in chain B; and MG-H1 contacted Asp521, Ile519, and Trp553 in chain A and Gln528 in chain B. The receptor contained short collagen α1(I)-derived peptides but did not represent full-length fibrillar collagen I (COL1); B: Summary of the AutoDock Vina scores, PubChem identifiers, predicted contacts, and interaction types. More negative Vina scores were used only to rank poses within this model and were not interpreted as experimentally measured binding affinities. Each ligand underwent one docking run, and the nine generated poses were alternative solutions rather than independent replicates. Standard docking did not model glycation chemistry or covalent crosslink formation; C: Advanced glycation end product-related fluorescence in a cell-free COL1-methylglyoxal (MGO) system. Rat-tail COL1 gels (1 mg/mL; 50 μL/well) were overlaid with 100 μL phosphate-buffered saline containing 10 mmol/L MGO, with or without 20 mmol/L aminoguanidine, and incubated at 37 °C for 5 days. MGO increased COL1-associated fluorescence, whereas aminoguanidine reduced this increase. Fluorescence was measured at excitation and emission wavelengths of 370 nm and 440 nm and normalized to the COL1-only group. The MGO-only group controlled for background fluorescence. Data are presented as the mean ± SD from three reaction sets, each measured in three technical wells. Technical-well values were averaged within each reaction set. Multiple-group comparisons were performed using one-way analysis of variance followed by Tukey’s multiple-comparisons test. Ganagliflozin proline was not included in this experiment. The fluorescence assay did not identify specific glycation adducts, modified COL1 residues, or covalent crosslinks. dP < 0.0001. CML: Nε-(carboxymethyl)lysine; MG-H1: Methylglyoxal-derived hydroimidazolone-1; MGO: Methylglyoxal; COL1: Collagen I.
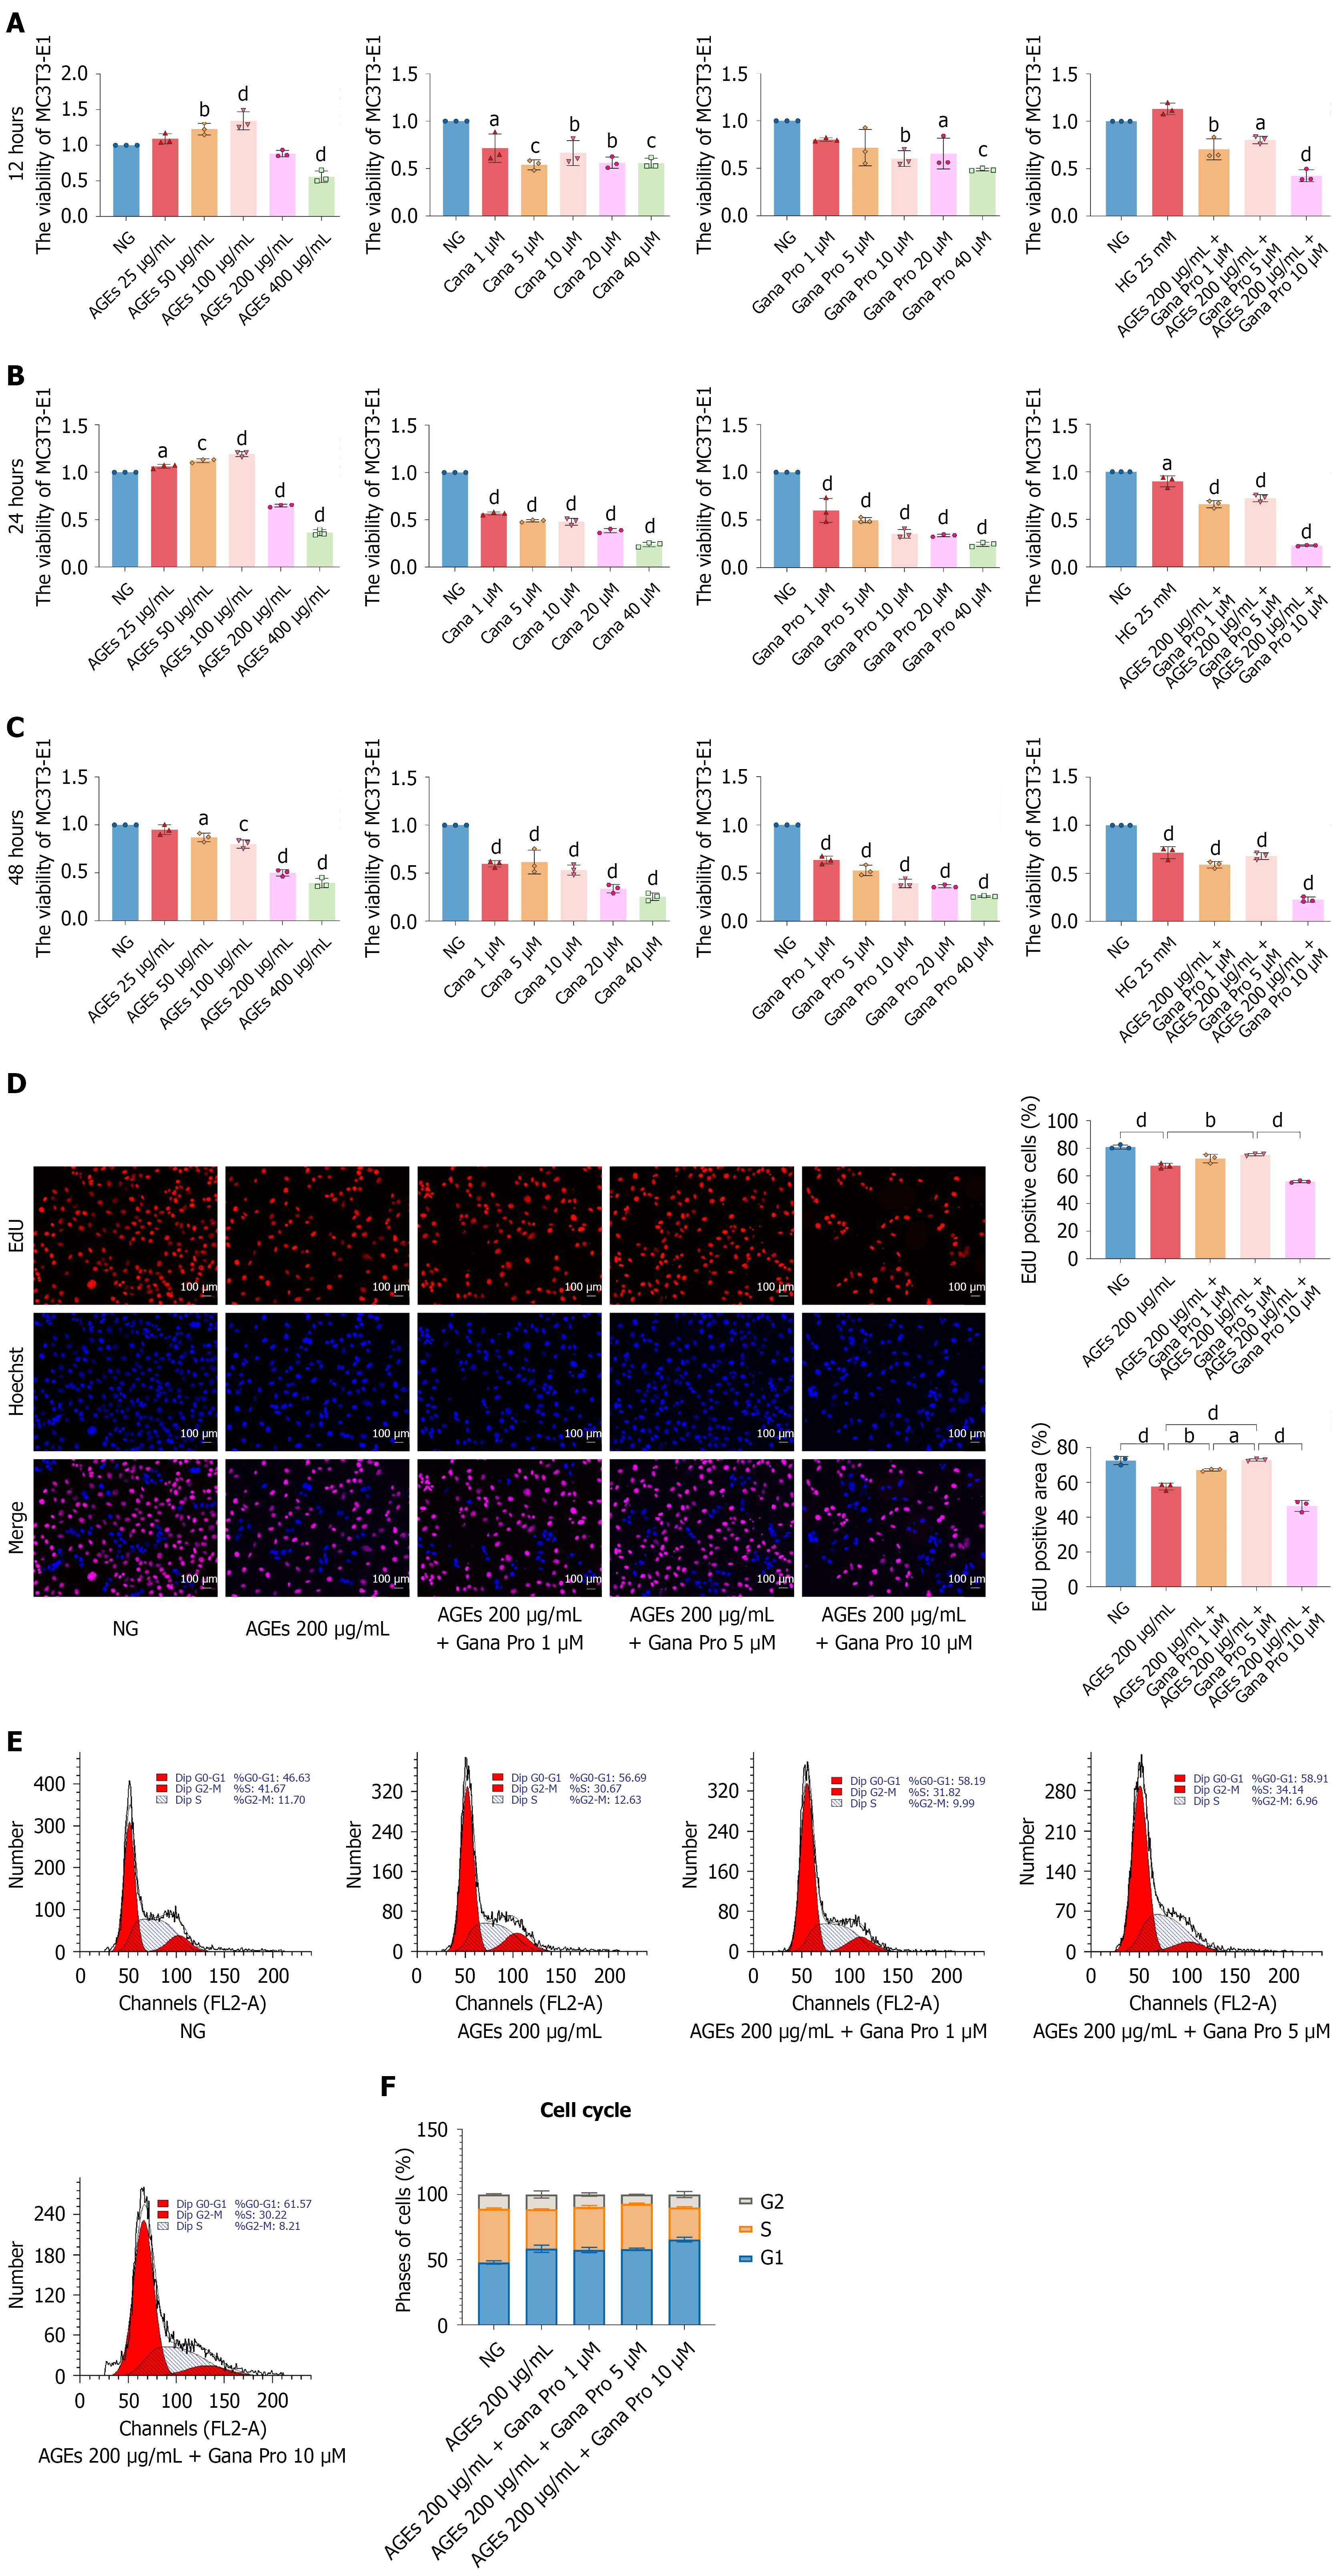
Figure 3 Concentration screening and proliferative responses to ganagliflozin proline during advanced glycation end product-modified bovine serum albumin exposure.
A-C: Cell counting kit-8 metabolic-activity measurements after 12 hours, 24 hours, and 48 hours, respectively. MC3T3-E1 cells were exposed to commercial advanced glycation end product-modified bovine serum albumin (AGE-BSA) (25-400 μg/mL total protein), canagliflozin (1-40 μmol/L), or ganagliflozin proline (Gana Pro) (1-40 μmol/L). Additional groups received 200 μg/mL AGE-BSA with 1 μmol/L, 5 μmol/L, or 10 μmol/L Gana Pro. The single-agent drug series evaluated concentration-associated effects on metabolic activity and did not constitute a comprehensive safety assessment. Based on the combined concentration-screening results, 5 μmol/L Gana Pro was selected as the working concentration for subsequent experiments; it was not defined as universally optimal; D: Representative 5-ethynyl-2’-deoxyuridine (EdU) images and quantification in the normal-glucose, AGE-BSA, AGE-BSA + 1 μmol/L Gana Pro, AGE-BSA + 5 μmol/L Gana Pro, and AGE-BSA + 10 μmol/L Gana Pro groups. EdU-positive nuclei are red, and Hoechst 33342-stained nuclei are blue. AGE-BSA exposure was associated with reduced EdU incorporation, whereas 5 μmol/L Gana Pro increased the EdU-positive proportion; E: Representative propidium iodide DNA-content histograms for the corresponding groups; F: Percentages of cells in the G0/G1, S, and G2/M phases. AGE-BSA exposure was associated with increased G0/G1-phase accumulation and reduced S-phase representation. Treatment with 5 μmol/L Gana Pro partially restored S-phase representation. Data are presented as the mean ± SD from three independent biological experiments (n = 3). Technical replicate wells were averaged within each experiment and were not treated as independent observations. Multiple-group comparisons were performed using one-way analysis of variance followed by Tukey’s multiple-comparisons test. The AGE-BSA preparation lacked a matched unmodified BSA control, and its endotoxin content was not analyzed. Gana Pro-only groups were included in the metabolic-activity screen but not in the downstream molecular and osteogenic assays. aP < 0.05. bP < 0.01. cP < 0.001. dP < 0.0001. For panels A-C, statistical comparisons were made against the corresponding normal-glucose group within each experimental series at the same time point. NG: Normal-glucose; HG: High-glucose; AGE: Advanced glycation end product; Cana: Canagliflozin; Gana Pro: Ganagliflozin proline; EdU: 5-ethynyl-2’-deoxyuridine.
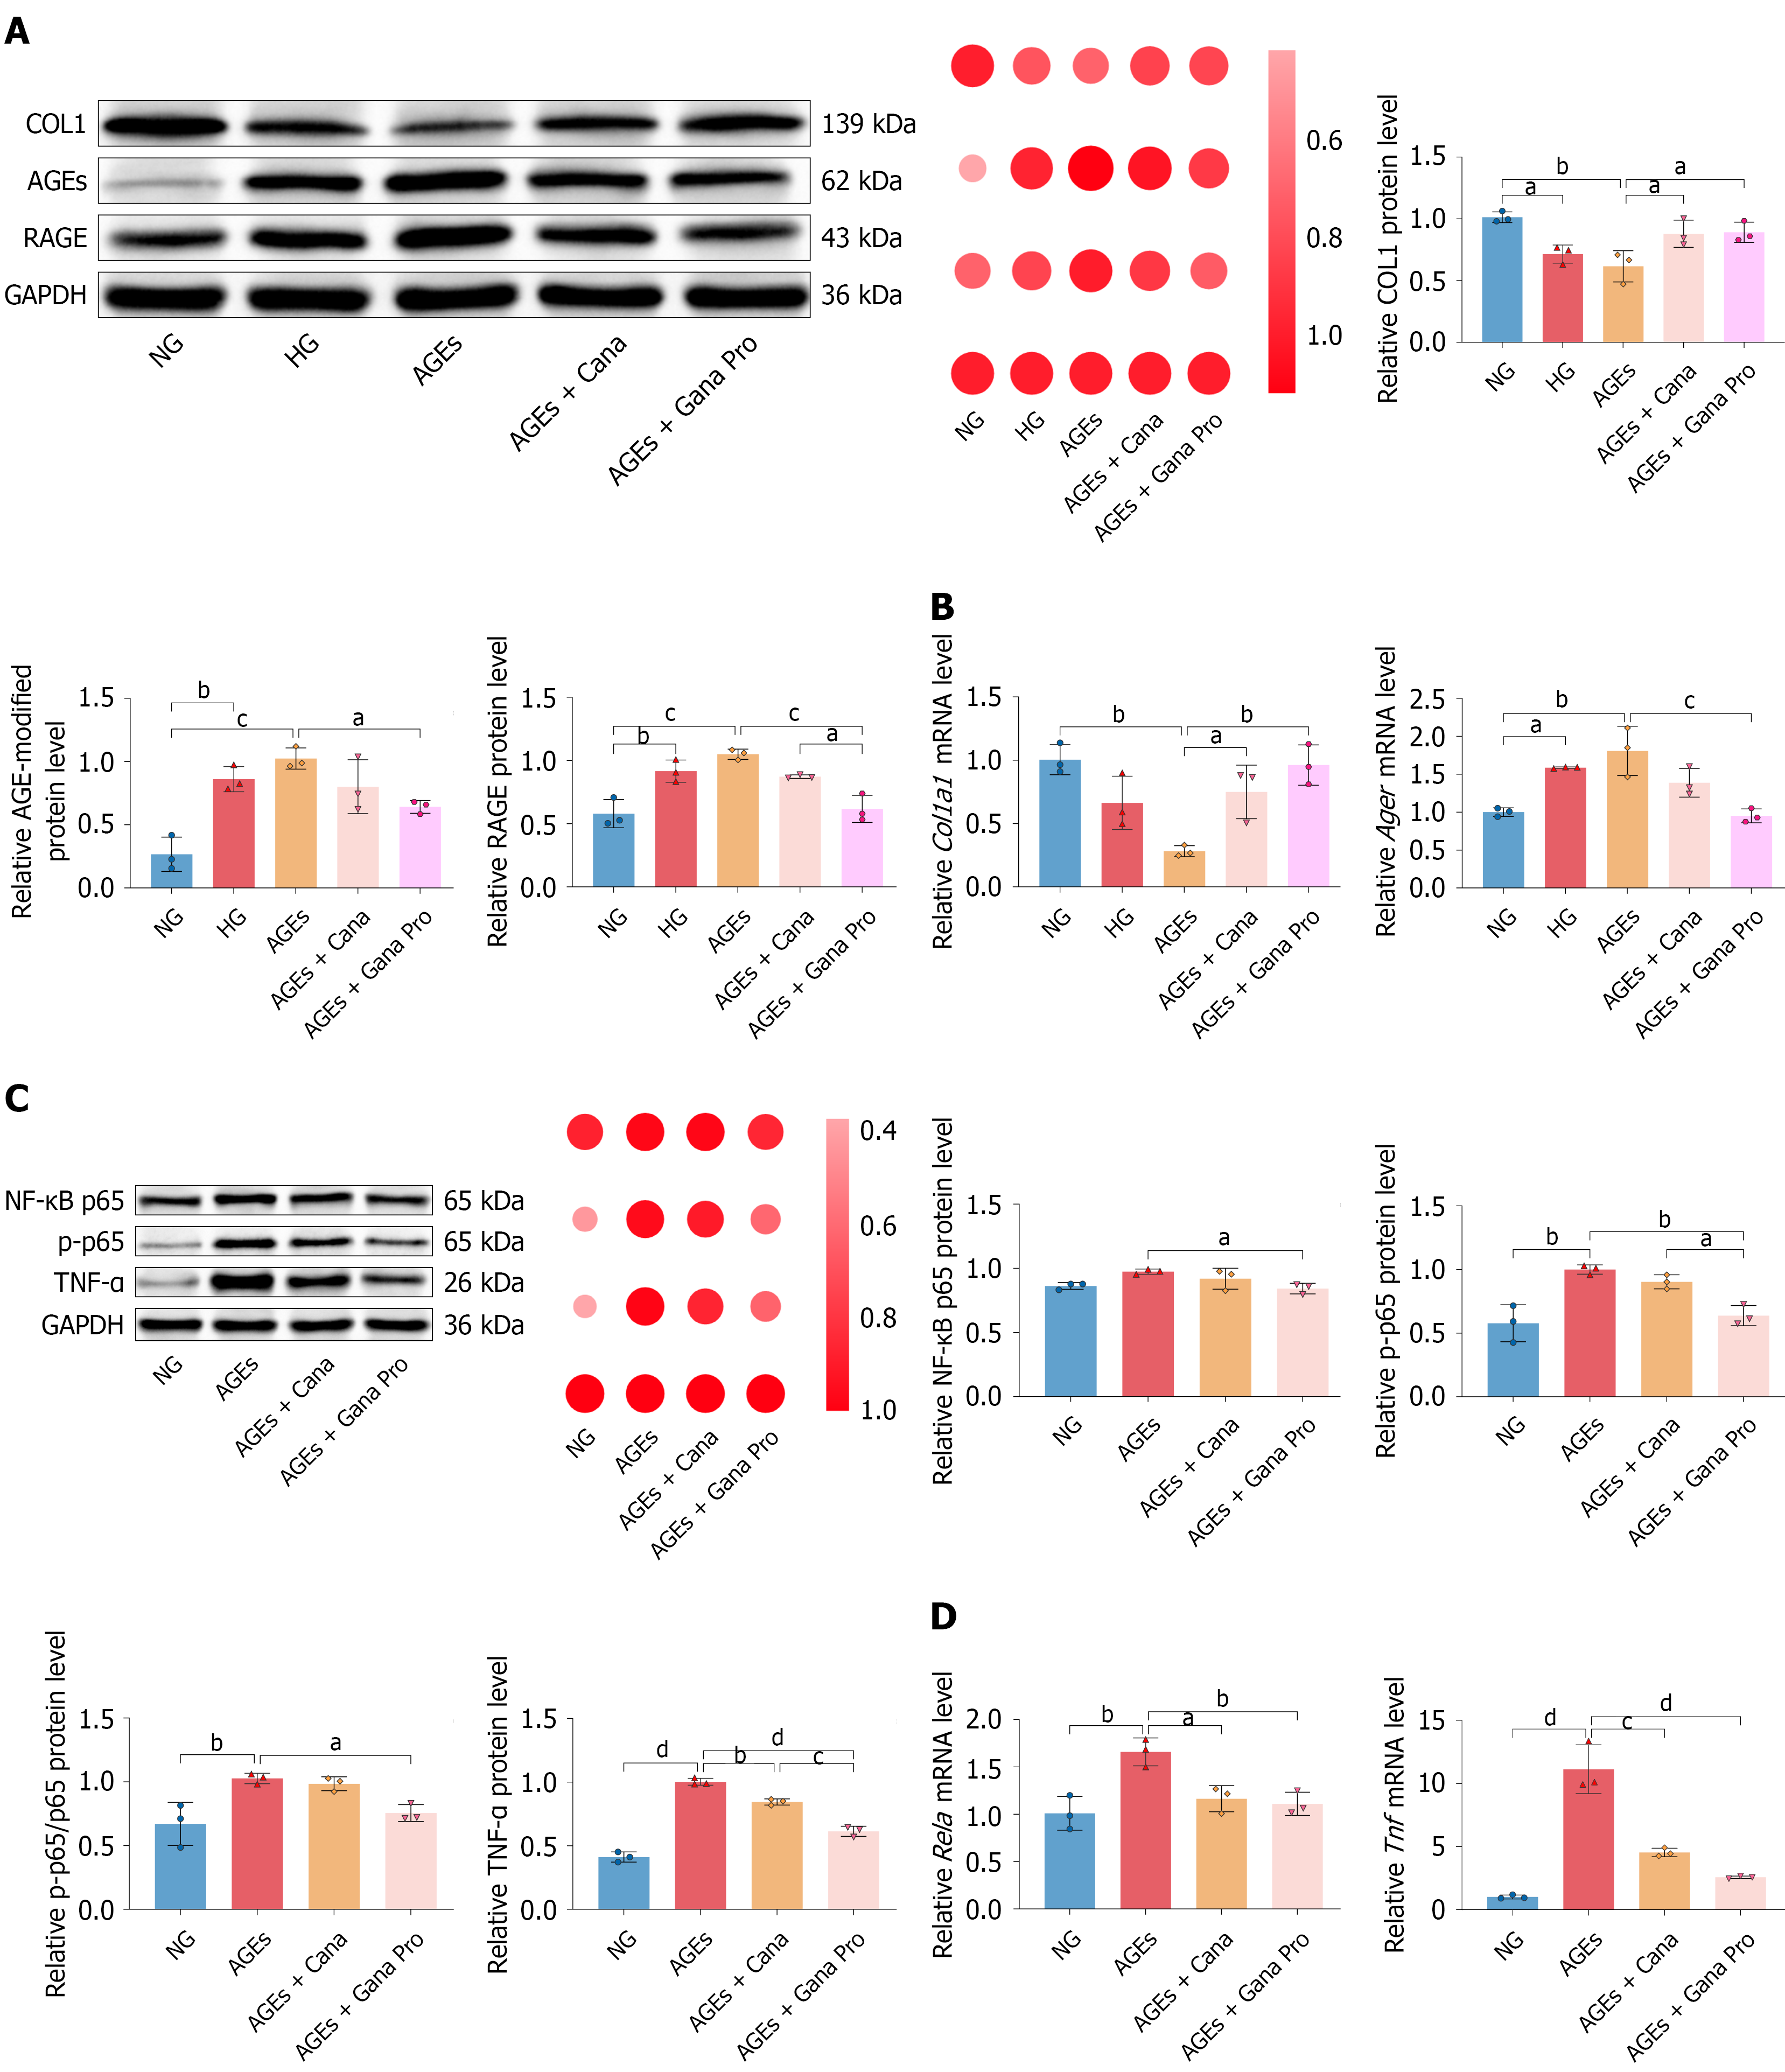
Figure 4 Ganagliflozin proline restores collagen I expression and reduces inflammatory readouts during advanced glycation end product-modified bovine serum albumin exposure.
A: Western blotting, relative-expression heatmap, and densitometric analysis of collagen I (COL1), advanced glycation end product (AGE)-modified protein immunoreactivity, and the receptor for advanced glycation end products (RAGE). MC3T3-E1 cells were cultured under normal-glucose, high-glucose, AGE-bovine serum albumin (BSA), AGE-BSA + canagliflozin (10 μmol/L), or AGE-BSA + ganagliflozin proline (Gana Pro) (5 μmol/L) conditions. Glyceraldehyde-3-phosphate dehydrogenase was the loading control. Compared with AGE-BSA alone, Gana Pro increased COL1 expression and reduced anti-AGE immunoreactivity and RAGE expression. The anti-AGE signal represents overall AGE-modified protein immunoreactivity and does not measure COL1-specific glycation or crosslinking; B: Quantitative polymerase chain reaction analysis of Col1a1 and Ager expression. Gana Pro increased Col1a1 expression and reduced Ager expression compared with AGE-BSA alone; C: Western blotting, heatmap, and densitometric analysis of nuclear factor kappa B (NF-κB) p65, phosphorylated p65 (p-p65), the p-p65/p65 ratio, and tumor necrosis factor alpha (TNF-α). Compared with AGE-BSA alone, Gana Pro reduced p-p65, the p-p65/p65 ratio, and TNF-α expression; D: Quantitative polymerase chain reaction analysis of Rela and Tnf expression. The high-glucose comparison lacked a mannitol or L-glucose osmotic control. The observed reductions in inflammatory readouts do not establish that RAGE/NF-κB signaling mediates the effects of Gana Pro. Uncropped Western blot source images are provided in the Supplementary material. Data are presented as the mean ± SD from three independent biological experiments (n = 3). Technical replicate measurements were averaged within each experiment. Multiple-group comparisons were performed using one-way analysis of variance followed by Tukey’s multiple-comparisons test. aP < 0.05. bP < 0.01. cP < 0.001. dP < 0.0001. COL1: Collagen I; AGE: Advanced glycation end product; RAGE: Receptor for advanced glycation end products; GAPDH: Glyceraldehyde-3-phosphate dehydrogenase; NG: Normal-glucose; HG: High-glucose; Cana: Canagliflozin; Gana Pro: Ganagliflozin proline; NF-κB: Nuclear factor kappa B; p-p65: Phosphorylated p65; TNF-α: Tumor necrosis factor alpha; mRNA: Messenger RNA.
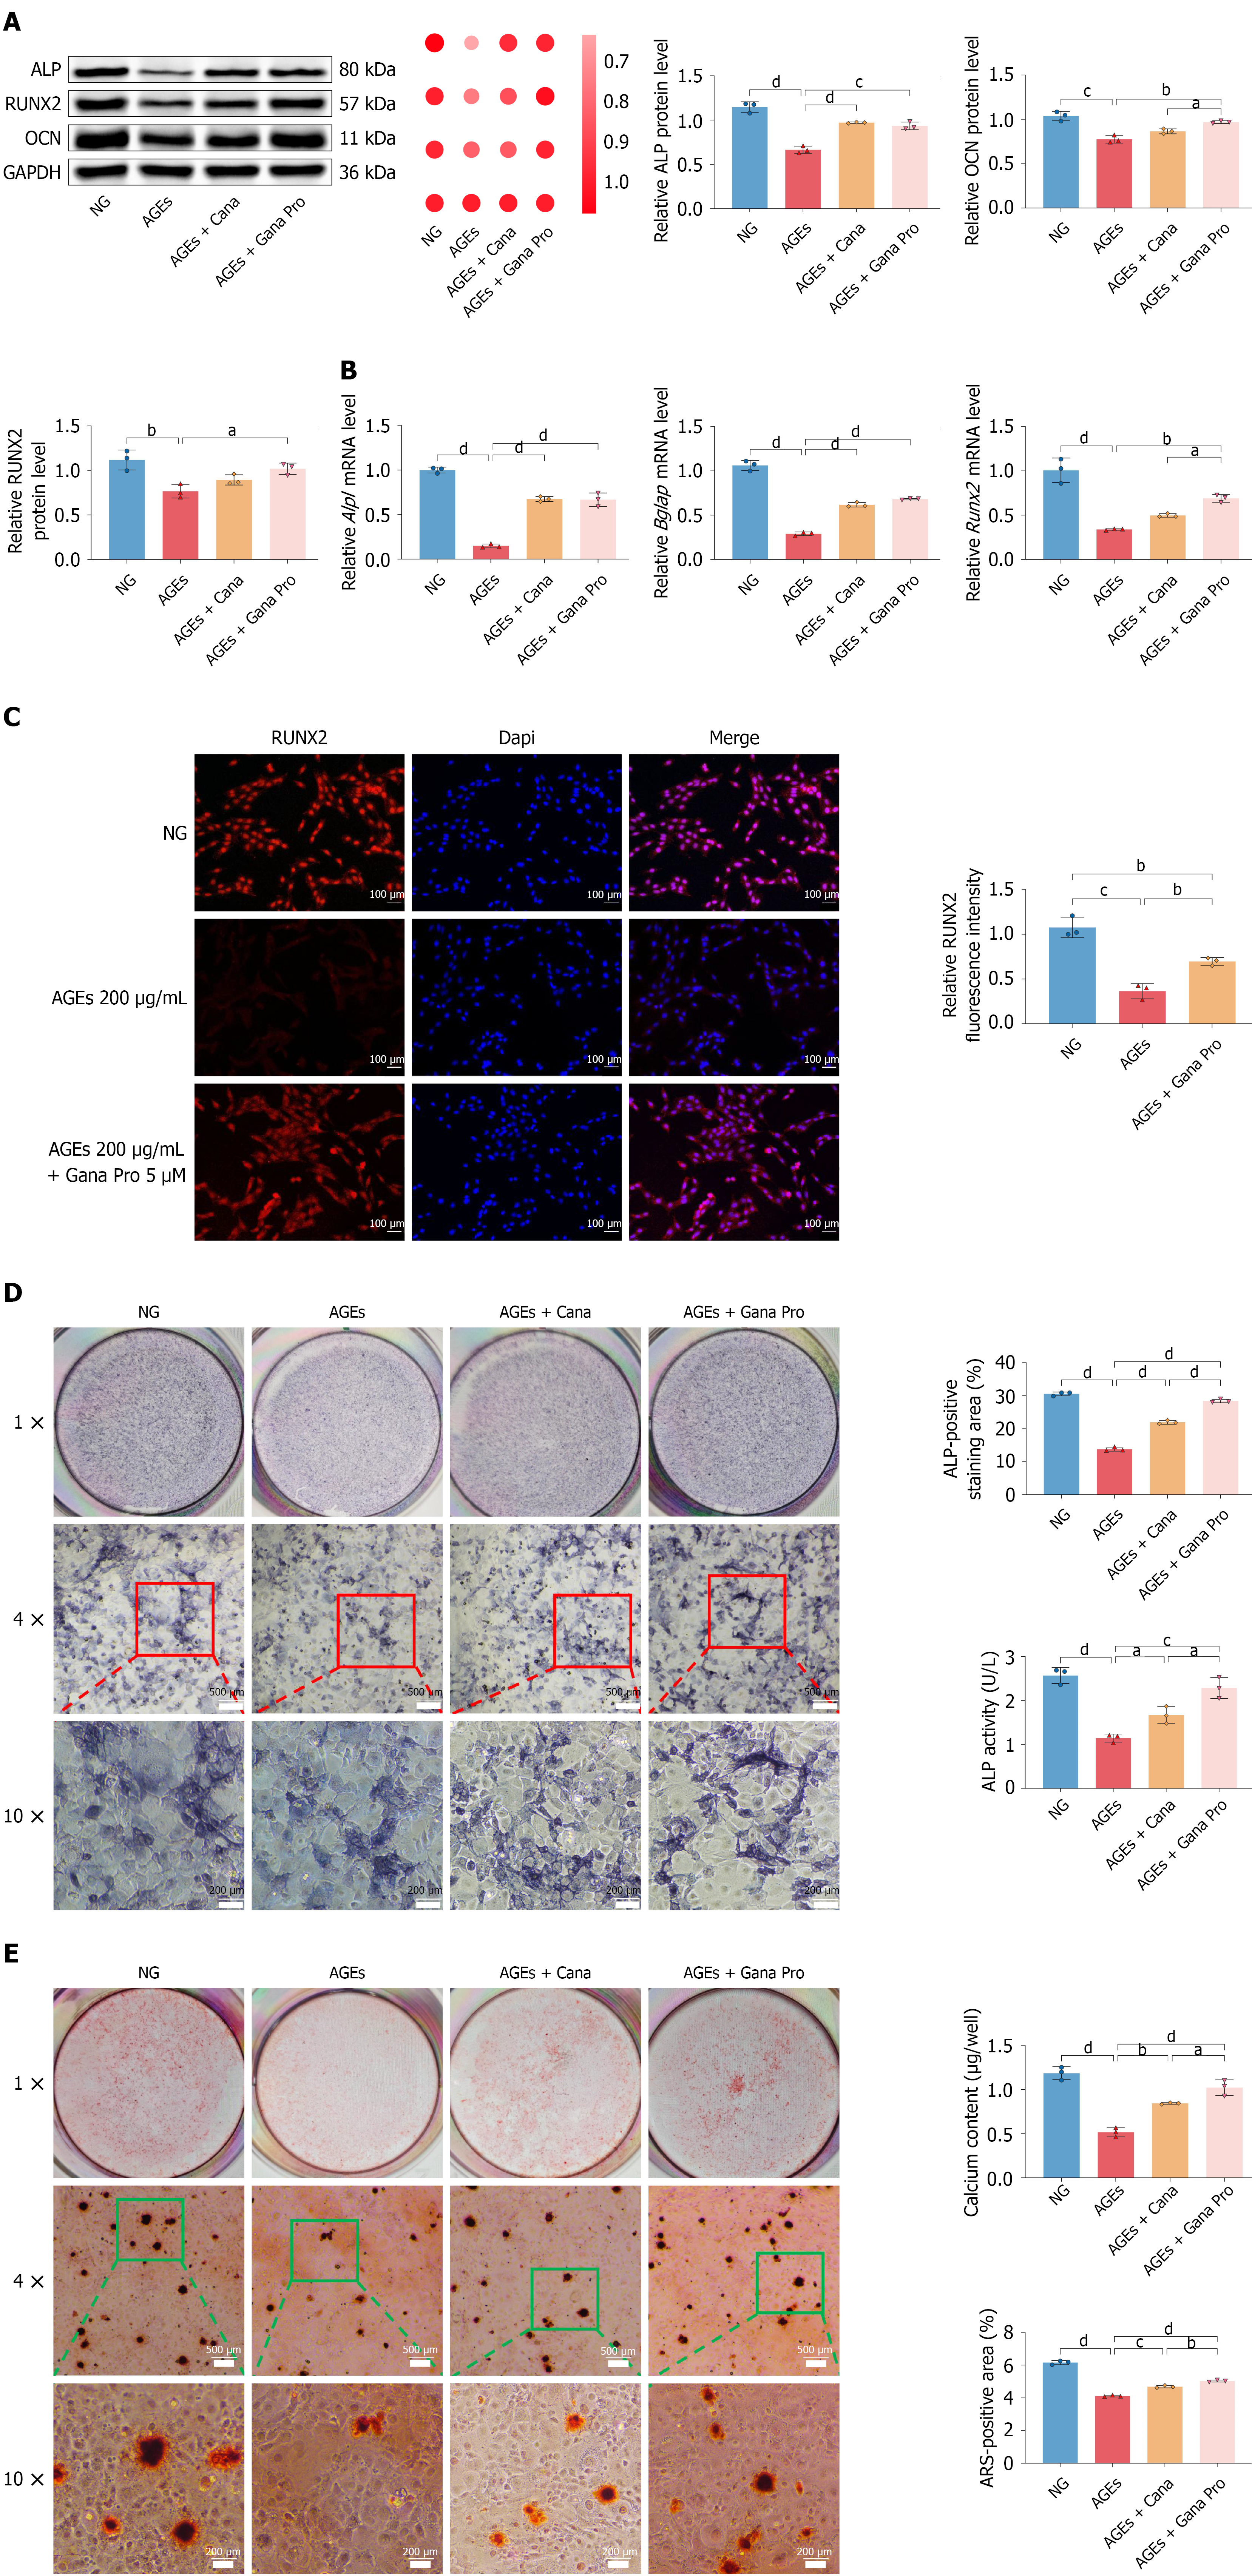
Figure 5 Ganagliflozin proline improves osteogenic and mineralization-associated readouts during advanced glycation end product-modified bovine serum albumin exposure.
A: Western blotting, relative-expression heatmap, and densitometric analysis of alkaline phosphatase (ALP), runt-related transcription factor 2 (RUNX2), and osteocalcin (OCN) in advanced glycation end product-modified bovine serum albumin (AGE-BSA)-exposed MC3T3-E1 cells. Glyceraldehyde-3-phosphate dehydrogenase was the loading control. Compared with AGE-BSA alone, ganagliflozin proline (Gana Pro) increased ALP, RUNX2, and OCN expression; B: Quantitative polymerase chain reaction analysis of Alpl, Runx2, and Bglap expression. No superiority of Gana Pro over canagliflozin (Cana) is inferred unless supported by a multiplicity-adjusted direct comparison; C: Representative RUNX2 immunofluorescence images and fluorescence quantification in the normal-glucose (NG), AGE-BSA, and AGE-BSA + Gana Pro groups. RUNX2 is shown in red, and 4’,6-diamidino-2-phenylindole-stained nuclei are shown in blue; D: Representative ALP staining, ALP-positive area, and ALP activity in the NG, AGE-BSA, AGE-BSA + Cana, and AGE-BSA + Gana Pro groups. ALP-positive staining was expressed as a percentage of the analyzed field area, and ALP activity in cell lysates was expressed as U/L; E: Representative Alizarin Red S staining, positive-area quantification, and calcium content. Alizarin Red S-positive area was expressed as a percentage of the analyzed field area, whereas calcium content was reported as μg/well. Gana Pro increased both mineralization-associated readouts compared with AGE-BSA alone. Because calcium content was not normalized to protein, DNA, or viable-cell number, a contribution from differences in cell abundance cannot be excluded. Data are presented as the mean ± SD from three independent biological experiments (n = 3). Technical wells and image fields were averaged within each biological experiment and were not treated as independent observations. Multiple-group comparisons were performed using one-way analysis of variance followed by Tukey’s multiple-comparisons test. Uncropped Western blot source images are provided in the Supplementary material. aP < 0.05. bP < 0.01. cP < 0.001. dP < 0.0001. ALP: Alkaline phosphatase; RUNX2: Runt-related transcription factor 2; OCN: Osteocalcin; GAPDH: Glyceraldehyde-3-phosphate dehydrogenase; NG: Normal-glucose; Cana: Canagliflozin; Gana Pro: Ganagliflozin proline; DAPI: 4’,6-diamidino-2-phenylindole; AGE: Advanced glycation end product; mRNA: Messenger RNA.
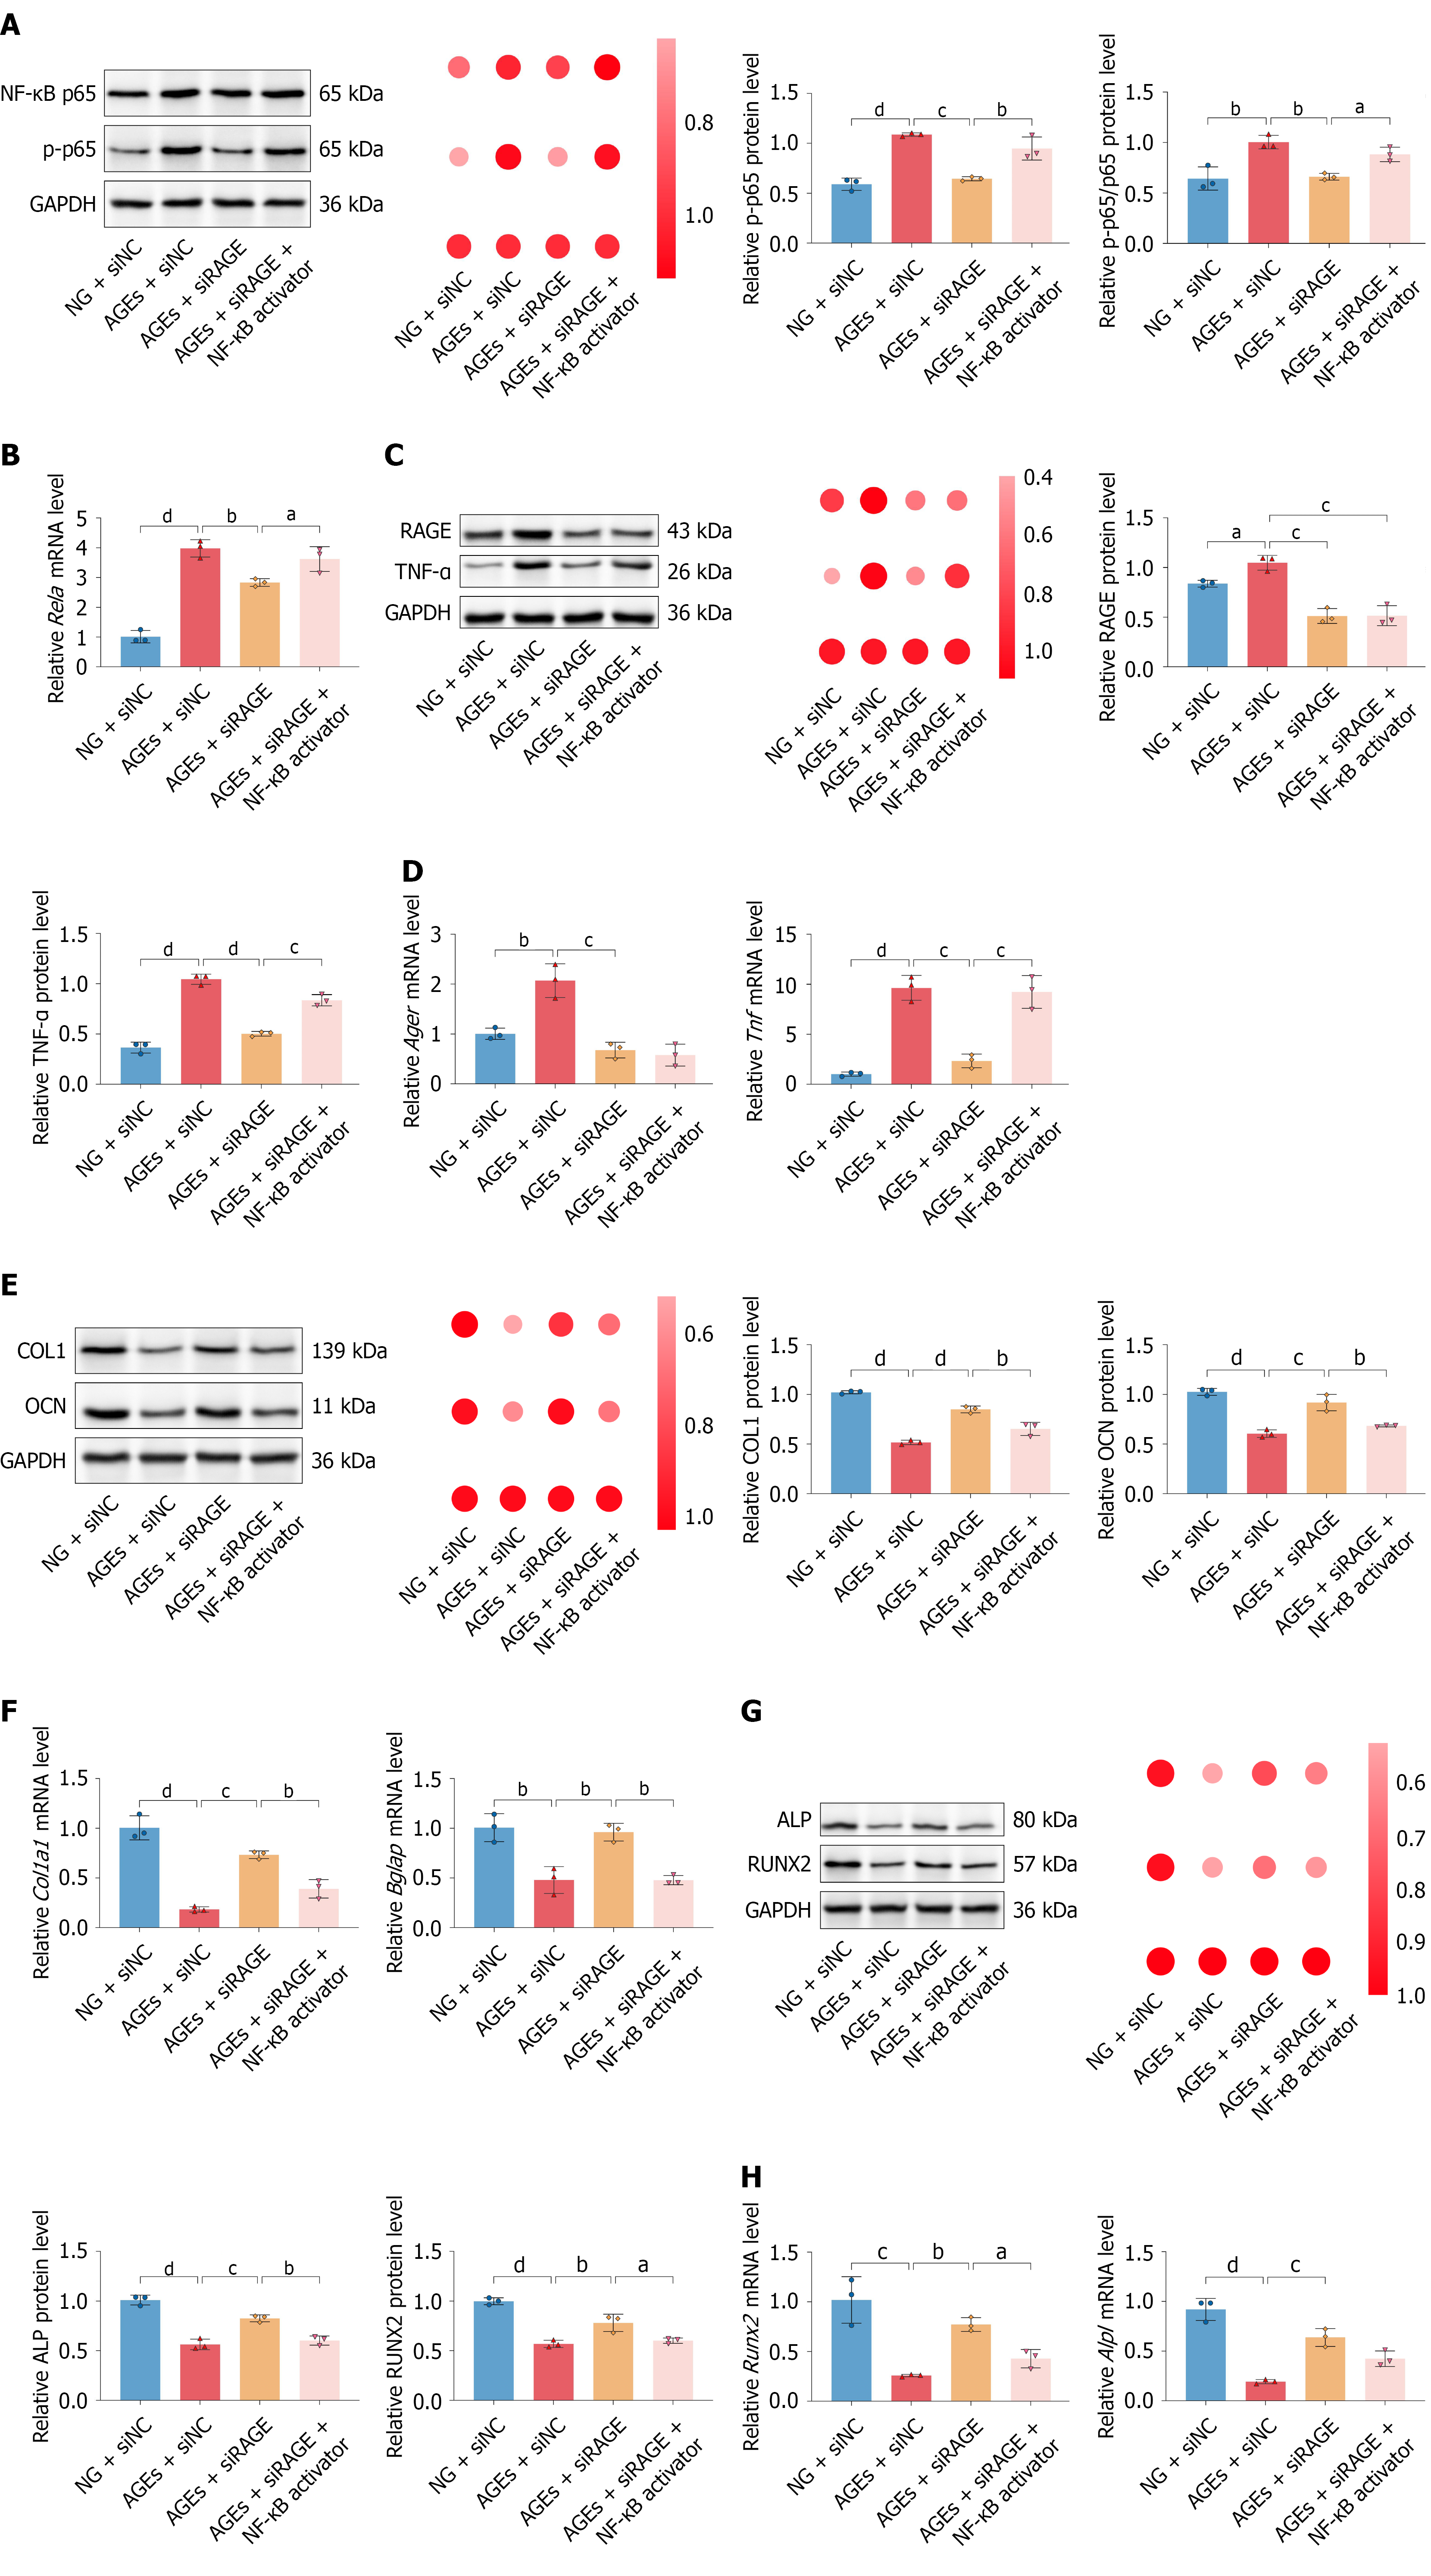
Figure 6 Receptor for advanced glycation end products knockdown and phorbol 12-myristate 13-acetate stimulation support pathway-associated responses during advanced glycation end product-modified bovine serum albumin exposure.
MC3T3-E1 cells were assigned to normal-glucose + negative-control small interfering RNA (siNC), advanced glycation end product-modified bovine serum albumin (AGE-BSA) + siNC, AGE-BSA + receptor for advanced glycation end products (RAGE)-targeting small interfering RNA (siRAGE), or AGE-BSA + siRAGE + phorbol 12-myristate 13-acetate (PMA) (100 nmol/L; treatment duration reported in the materials and methods) groups. A: Western blotting, relative-expression heatmap, and densitometric analysis of total p65, phosphorylated p65 (p-p65), and the p-p65/p65 ratio. RAGE knockdown reduced AGE-BSA-associated p65 phosphorylation, whereas PMA increased p65 phosphorylation after RAGE knockdown; B: Quantitative polymerase chain reaction analysis of Rela expression; C: Western blotting, relative-expression heatmap, and densitometric analysis of RAGE and tumor necrosis factor alpha (TNF-α). PMA did not restore RAGE expression but increased TNF-α expression after RAGE knockdown; D: Quantitative polymerase chain reaction analysis of Ager and Tnf expression; E: Western blotting and densitometric analysis of collagen I and osteocalcin expression; F: Quantitative polymerase chain reaction analysis of Col1a1 and Bglap expression; G: Western blotting and densitometric analysis of alkaline phosphatase and runt-related transcription factor 2 expression; H: Quantitative polymerase chain reaction analysis of Alpl and Runx2 expression. RAGE knockdown increased the measured osteogenic markers, whereas PMA partially attenuated their recovery. Data are presented as the mean ± SD from three independent biological experiments (n = 3). Technical replicate measurements were averaged within each experiment. Multiple-group comparisons were performed using one-way analysis of variance followed by Tukey’s multiple-comparisons test. PMA was used as a pleiotropic stimulus capable of engaging nuclear factor kappa B (NF-κB)-associated signaling, not as a selective NF-κB agonist. Nuclear p65 translocation and nuclear/cytoplasmic fractionation were not evaluated. Ganagliflozin proline was absent from this experiment; therefore, these results do not establish that RAGE/NF-κB-associated signaling mediates its protective effects. Uncropped Western blot source images are provided in the Supplementary material. aP < 0.05. bP < 0.01. cP < 0.001. dP < 0.0001. GAPDH: Glyceraldehyde-3-phosphate dehydrogenase; NF-κB: Nuclear factor kappa B; p-p65: Phosphorylated p65; NG: Normal-glucose; AGE: Advanced glycation end product; siNC: Negative-control small interfering RNA; siRAGE: Receptor for advanced glycation end products-targeting small interfering RNA; RAGE: Receptor for advanced glycation end products; TNF-α: Tumor necrosis factor alpha; mRNA: Messenger RNA; OCN: Osteocalcin; COL1: Collagen I; ALP: Alkaline phosphatase; RUNX2: Runt-related transcription factor 2.
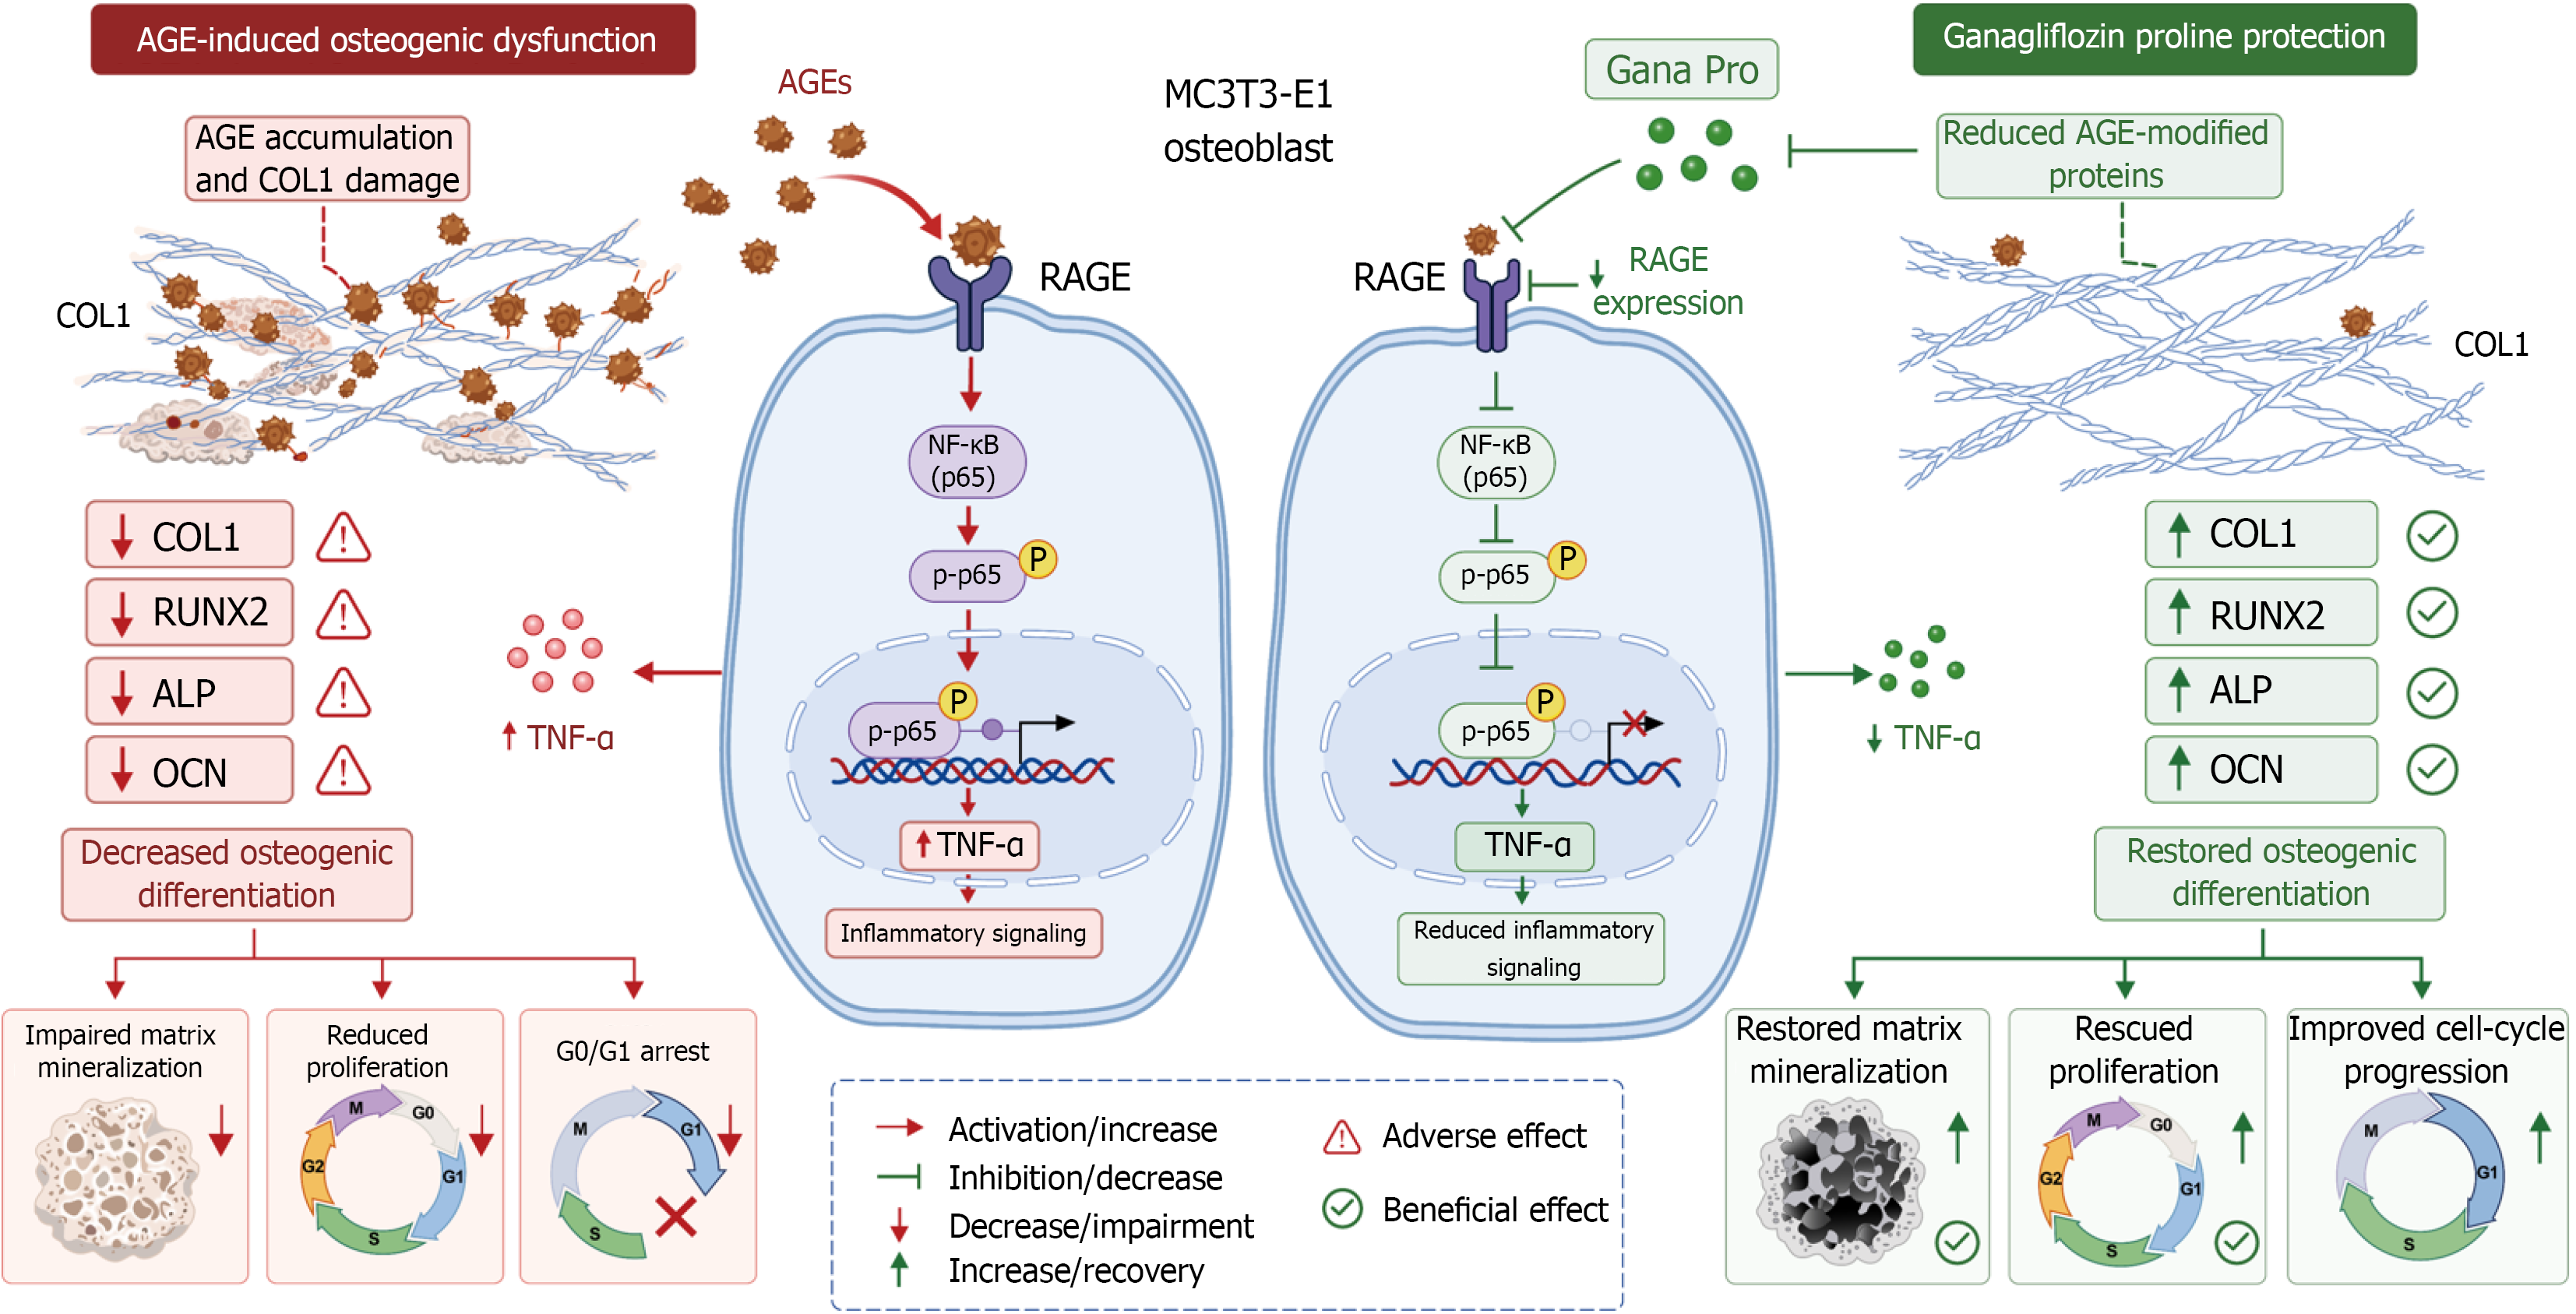
Figure 7 Evidence-bounded working model of ganagliflozin proline-associated protection and receptor for advanced glycation end products/nuclear factor kappa B-associated signaling in MC3T3-E1 cells.
Commercial advanced glycation end product-modified bovine serum albumin (AGE-BSA) exposure was associated with increased AGE-modified protein immunoreactivity, receptor for advanced glycation end products (RAGE) expression, p65 phosphorylation, and tumor necrosis factor alpha (TNF-α) expression. These changes occurred together with reduced proliferation, osteogenic-marker expression, alkaline phosphatase (ALP) activity, and mineralization-associated readouts. Ganagliflozin proline (Gana Pro) increased 5-ethynyl-2’-deoxyuridine incorporation, collagen I (COL1) and osteogenic-marker expression, ALP activity, calcium content, and matrix mineralization while reducing RAGE, p65 phosphorylation, and TNF-α readouts. In a separate experiment without Gana Pro, RAGE knockdown followed by phorbol 12-myristate 13-acetate (PMA) stimulation supported the functional involvement of RAGE/nuclear factor kappa B-associated signaling in AGE-BSA-associated injury. Solid connections represent relationships measured directly within the corresponding experimental module. The dashed connection between reduced pathway readouts and Gana Pro-associated functional recovery denotes a proposed contribution requiring direct Gana Pro plus PMA rescue testing. The model does not imply that Gana Pro directly inhibits COL1 glycation or crosslinking. Because matched unmodified bovine serum albumin and endotoxin-controlled conditions were absent, the initiating injury cannot be attributed exclusively to AGE modifications. The model is restricted to MC3T3-E1 cells and does not imply validation in primary, human, or in vivo osteogenic systems. AGE: Advanced glycation end product; OCN: Osteocalcin; COL1: Collagen I; ALP: Alkaline phosphatase; RUNX2: Runt-related transcription factor 2; TNF-α: Tumor necrosis factor alpha; NF-κB: Nuclear factor kappa B; RAGE: Receptor for advanced glycation end products; p-p65: Phosphorylated p65; Gana Pro: Ganagliflozin proline.
- Citation: Li ZP, Li H, Xu JL, Liu YJ, Li D, Wang P, Xiang L, Xu SY, Duan CZ, Wang SX, Sun JK, Zhang CJ, He DJ, Luo C. Ganagliflozin proline attenuates osteogenic dysfunction and inflammatory signaling during exposure to advanced glycation end products in murine osteoblasts. World J Diabetes 2026; 17(11): 124042
- URL: https://www.wjgnet.com/1948-9358/full/v17/i11/124042.htm
- DOI: https://dx.doi.org/10.4239/wjd.124042