
















Copyright: ©Author(s) 2026.
World J Diabetes. Nov 15, 2026; 17(11): 121630
Published online Nov 15, 2026. doi: 10.4239/wjd.121630
Published online Nov 15, 2026. doi: 10.4239/wjd.121630
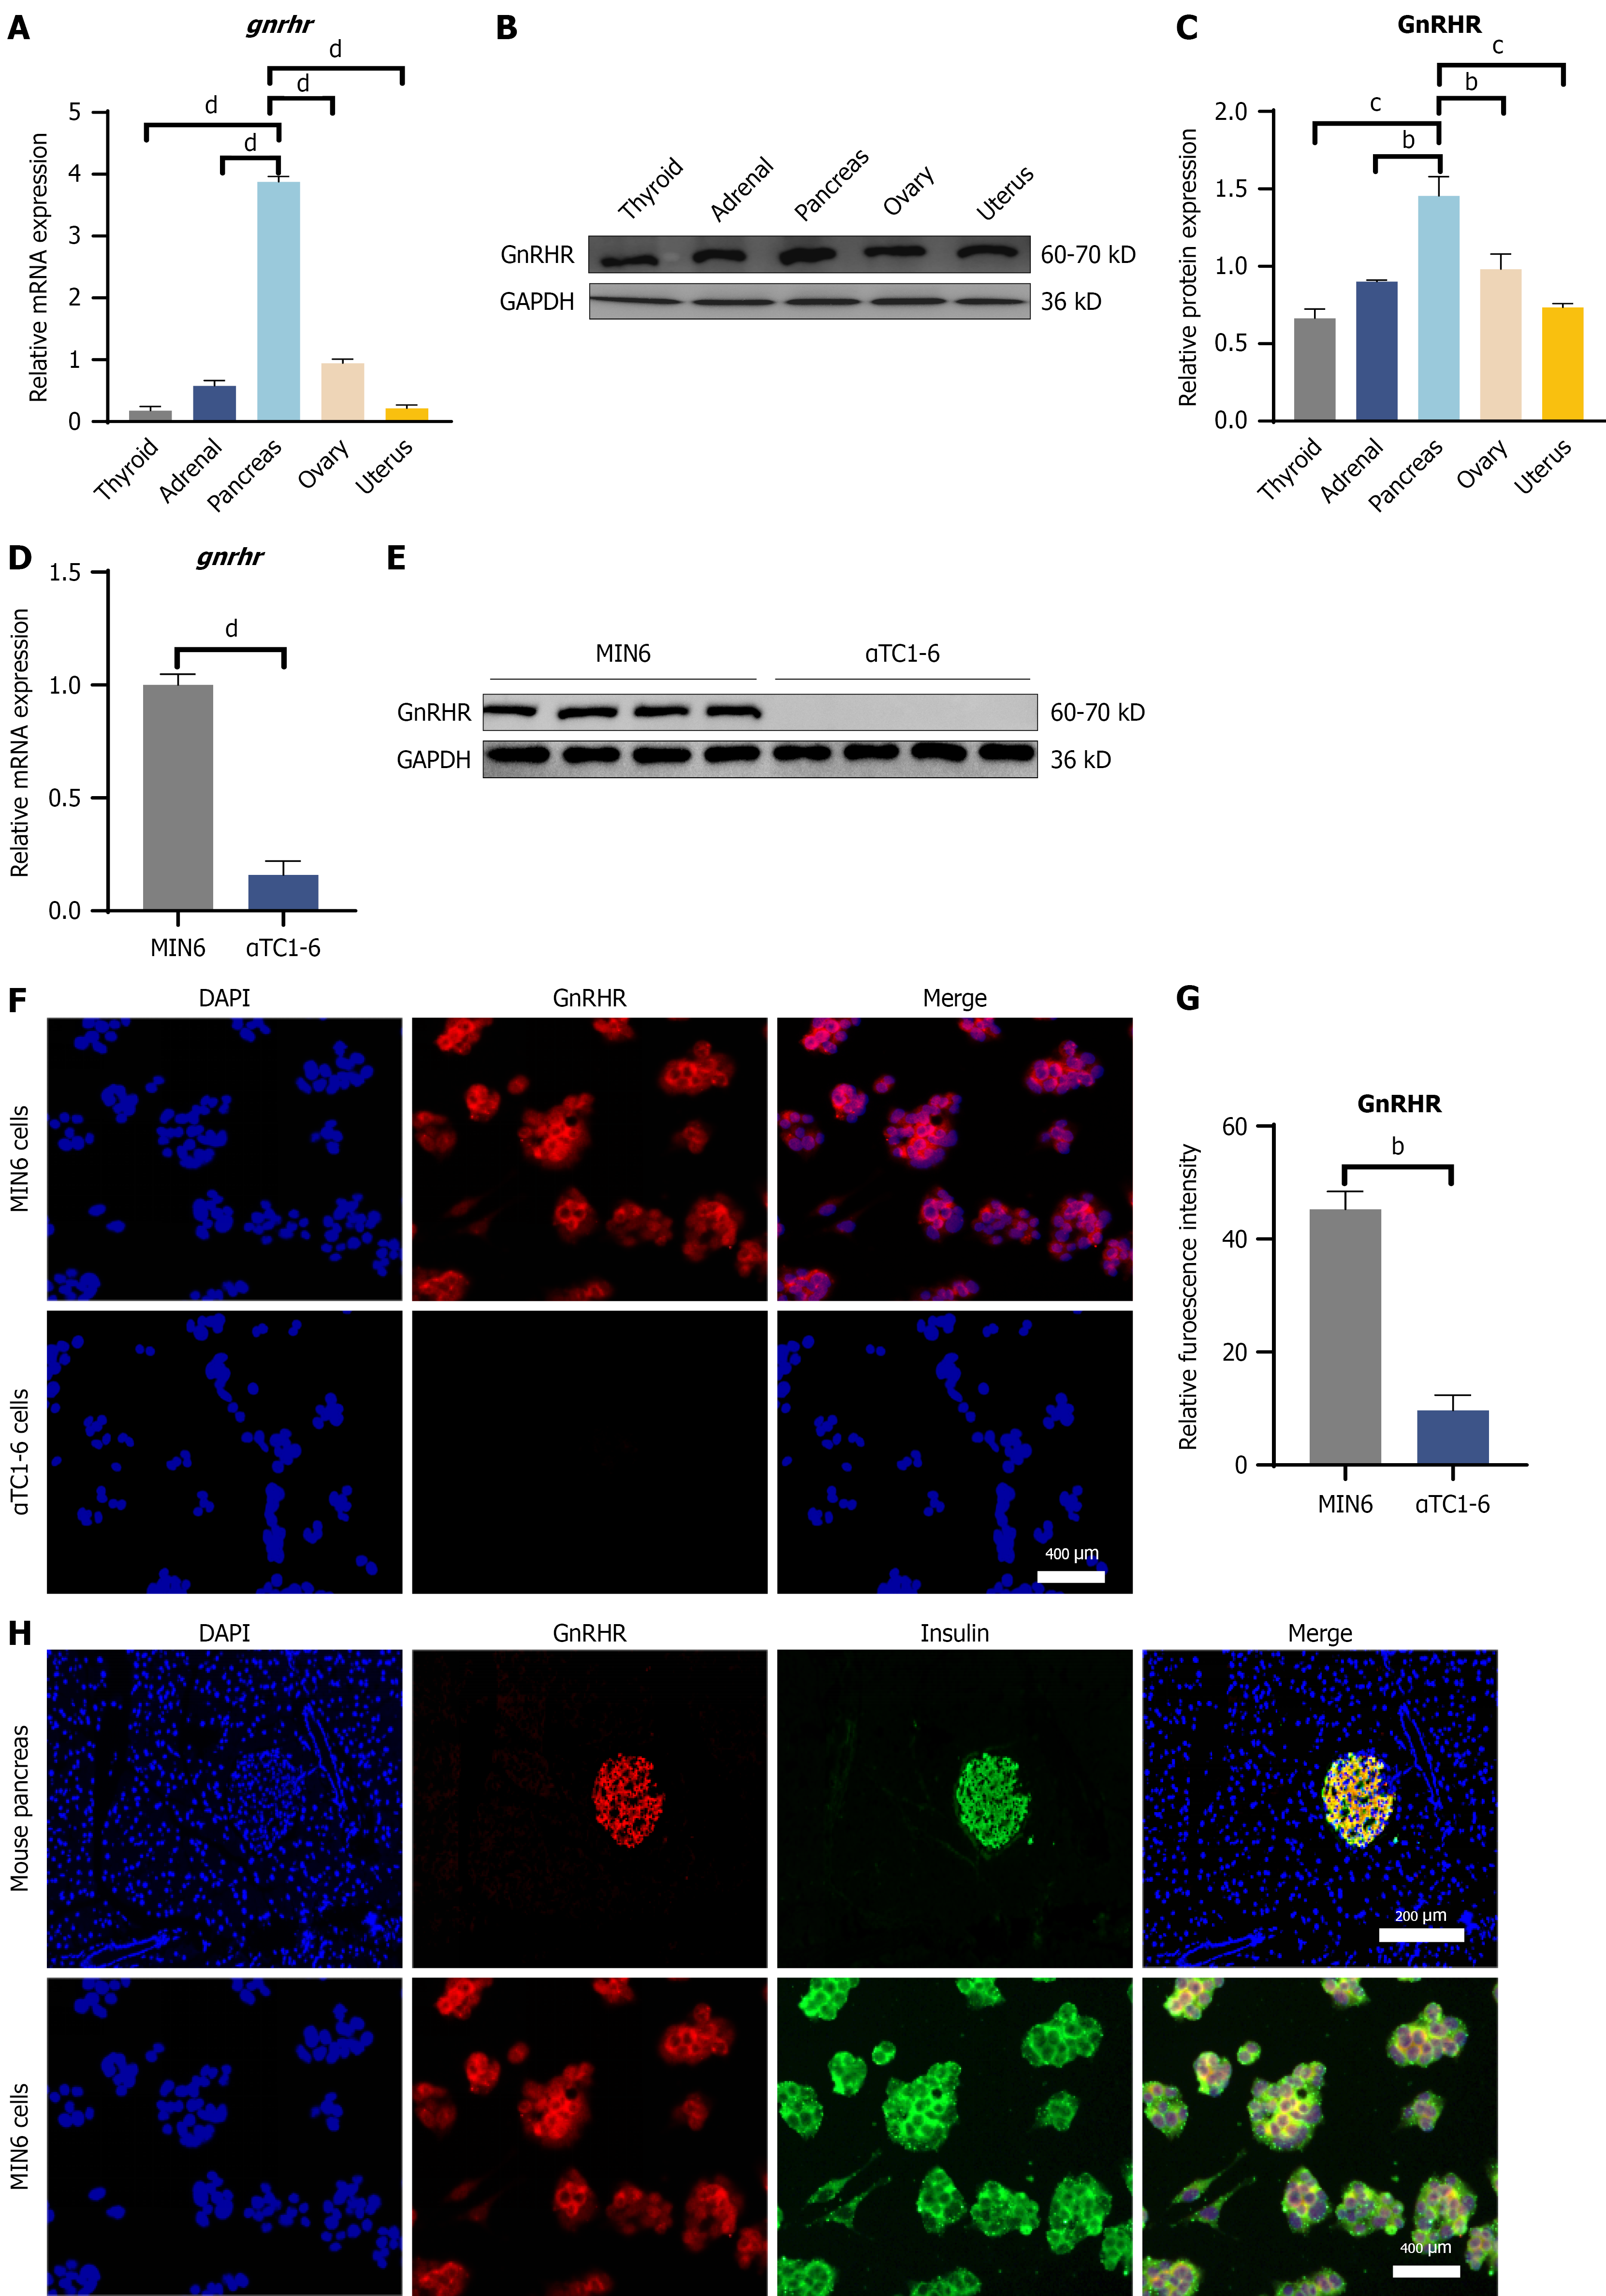
Figure 1 Tissue distribution and β-cell-specific localization of the gonadotropin-releasing hormone receptor.
A-C: Representative immunoblots and quantitative analysis of gonadotropin-releasing hormone receptor (GnRHR) protein expression in the murine pancreas compared with reproductive tissues (ovary and uterus). GAPDH was utilized as the loading control. bP < 0.01 vs ovary or adrenal, cP < 0.001 vs thyroid or uterus, and dP < 0.0001 vs thyroid, adrenal, ovary or uterus; D-G: Comparative analysis of GnRHR expression in murine β-cell (MIN6) vs α-cell (αTC1-6) lines. bP < 0.01 vs αTC1-6, dP < 0.0001 vs αTC1-6. H: Representative dual-immunofluorescence images displaying the colocalization of GnRHR (red) and insulin (green) within pancreatic islets. Nuclei were visualized through DAPI counterstaining (blue). Scale bar = 200 μm. Statistical analysis: Data are expressed as the mean ± SEM from three independent experiments. GnRHR: Gonadotropin-releasing hormone receptor.
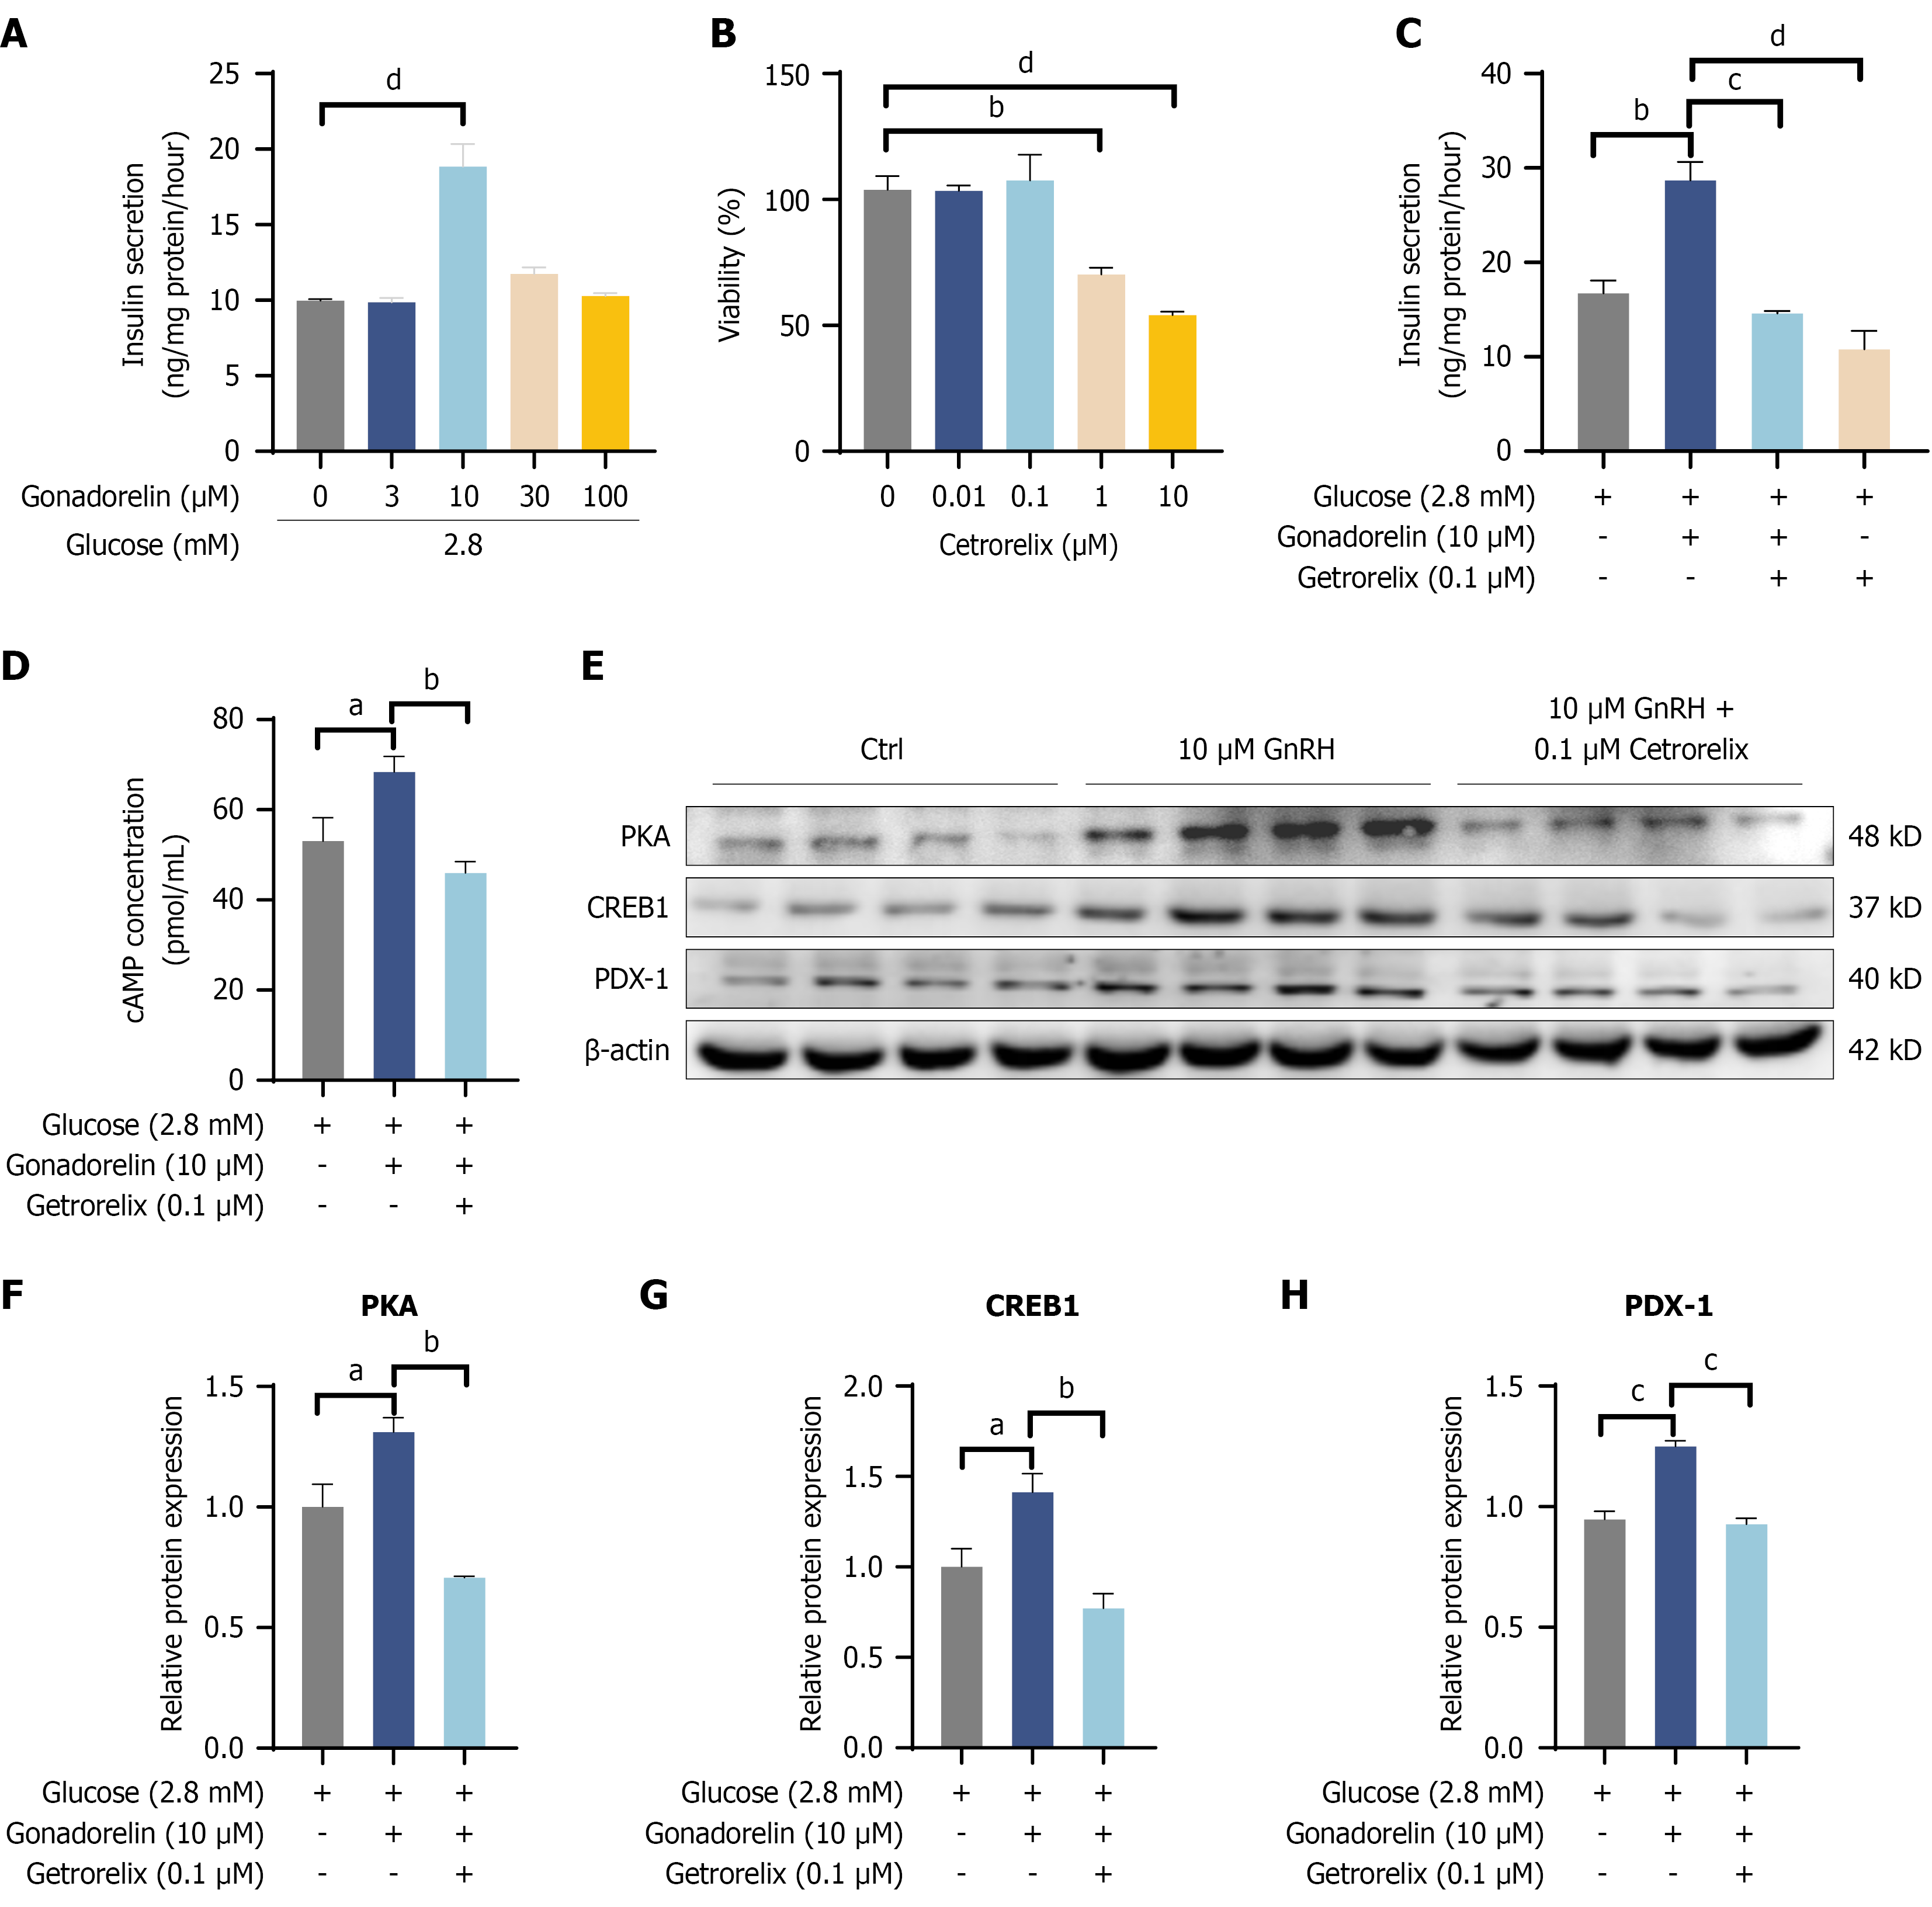
Figure 2 Gonadorelin promotes basal insulin secretion by activating the gonadotropin-releasing hormone receptor-cAMP-PKA-PDX1 signaling axis.
A: Dose-dependent effects of gonadorelin on insulin secretion in MIN6 cells under basal glucose conditions (2.8 mmol/L); B and C: Antagonism of the insulinotropic effect of gonadorelin by the specific gonadotropin-releasing hormone receptor antagonist cetrorelix; D: Intracellular cAMP levels in MIN6 cells stimulated with gonadorelin in the presence or absence of cetrorelix; E-H: Representative immunoblots and densitometric analysis of the expression and phosphorylation levels of PKA, CREB, and PDX1. β-actin was utilized as the loading control. Statistical analysis: Data are presented as the mean ± SEM (n = 3 independent experiments). aP < 0.05, bP < 0.01, cP < 0.001, and dP < 0.0001. GnRH: Gonadotropin-releasing hormone.
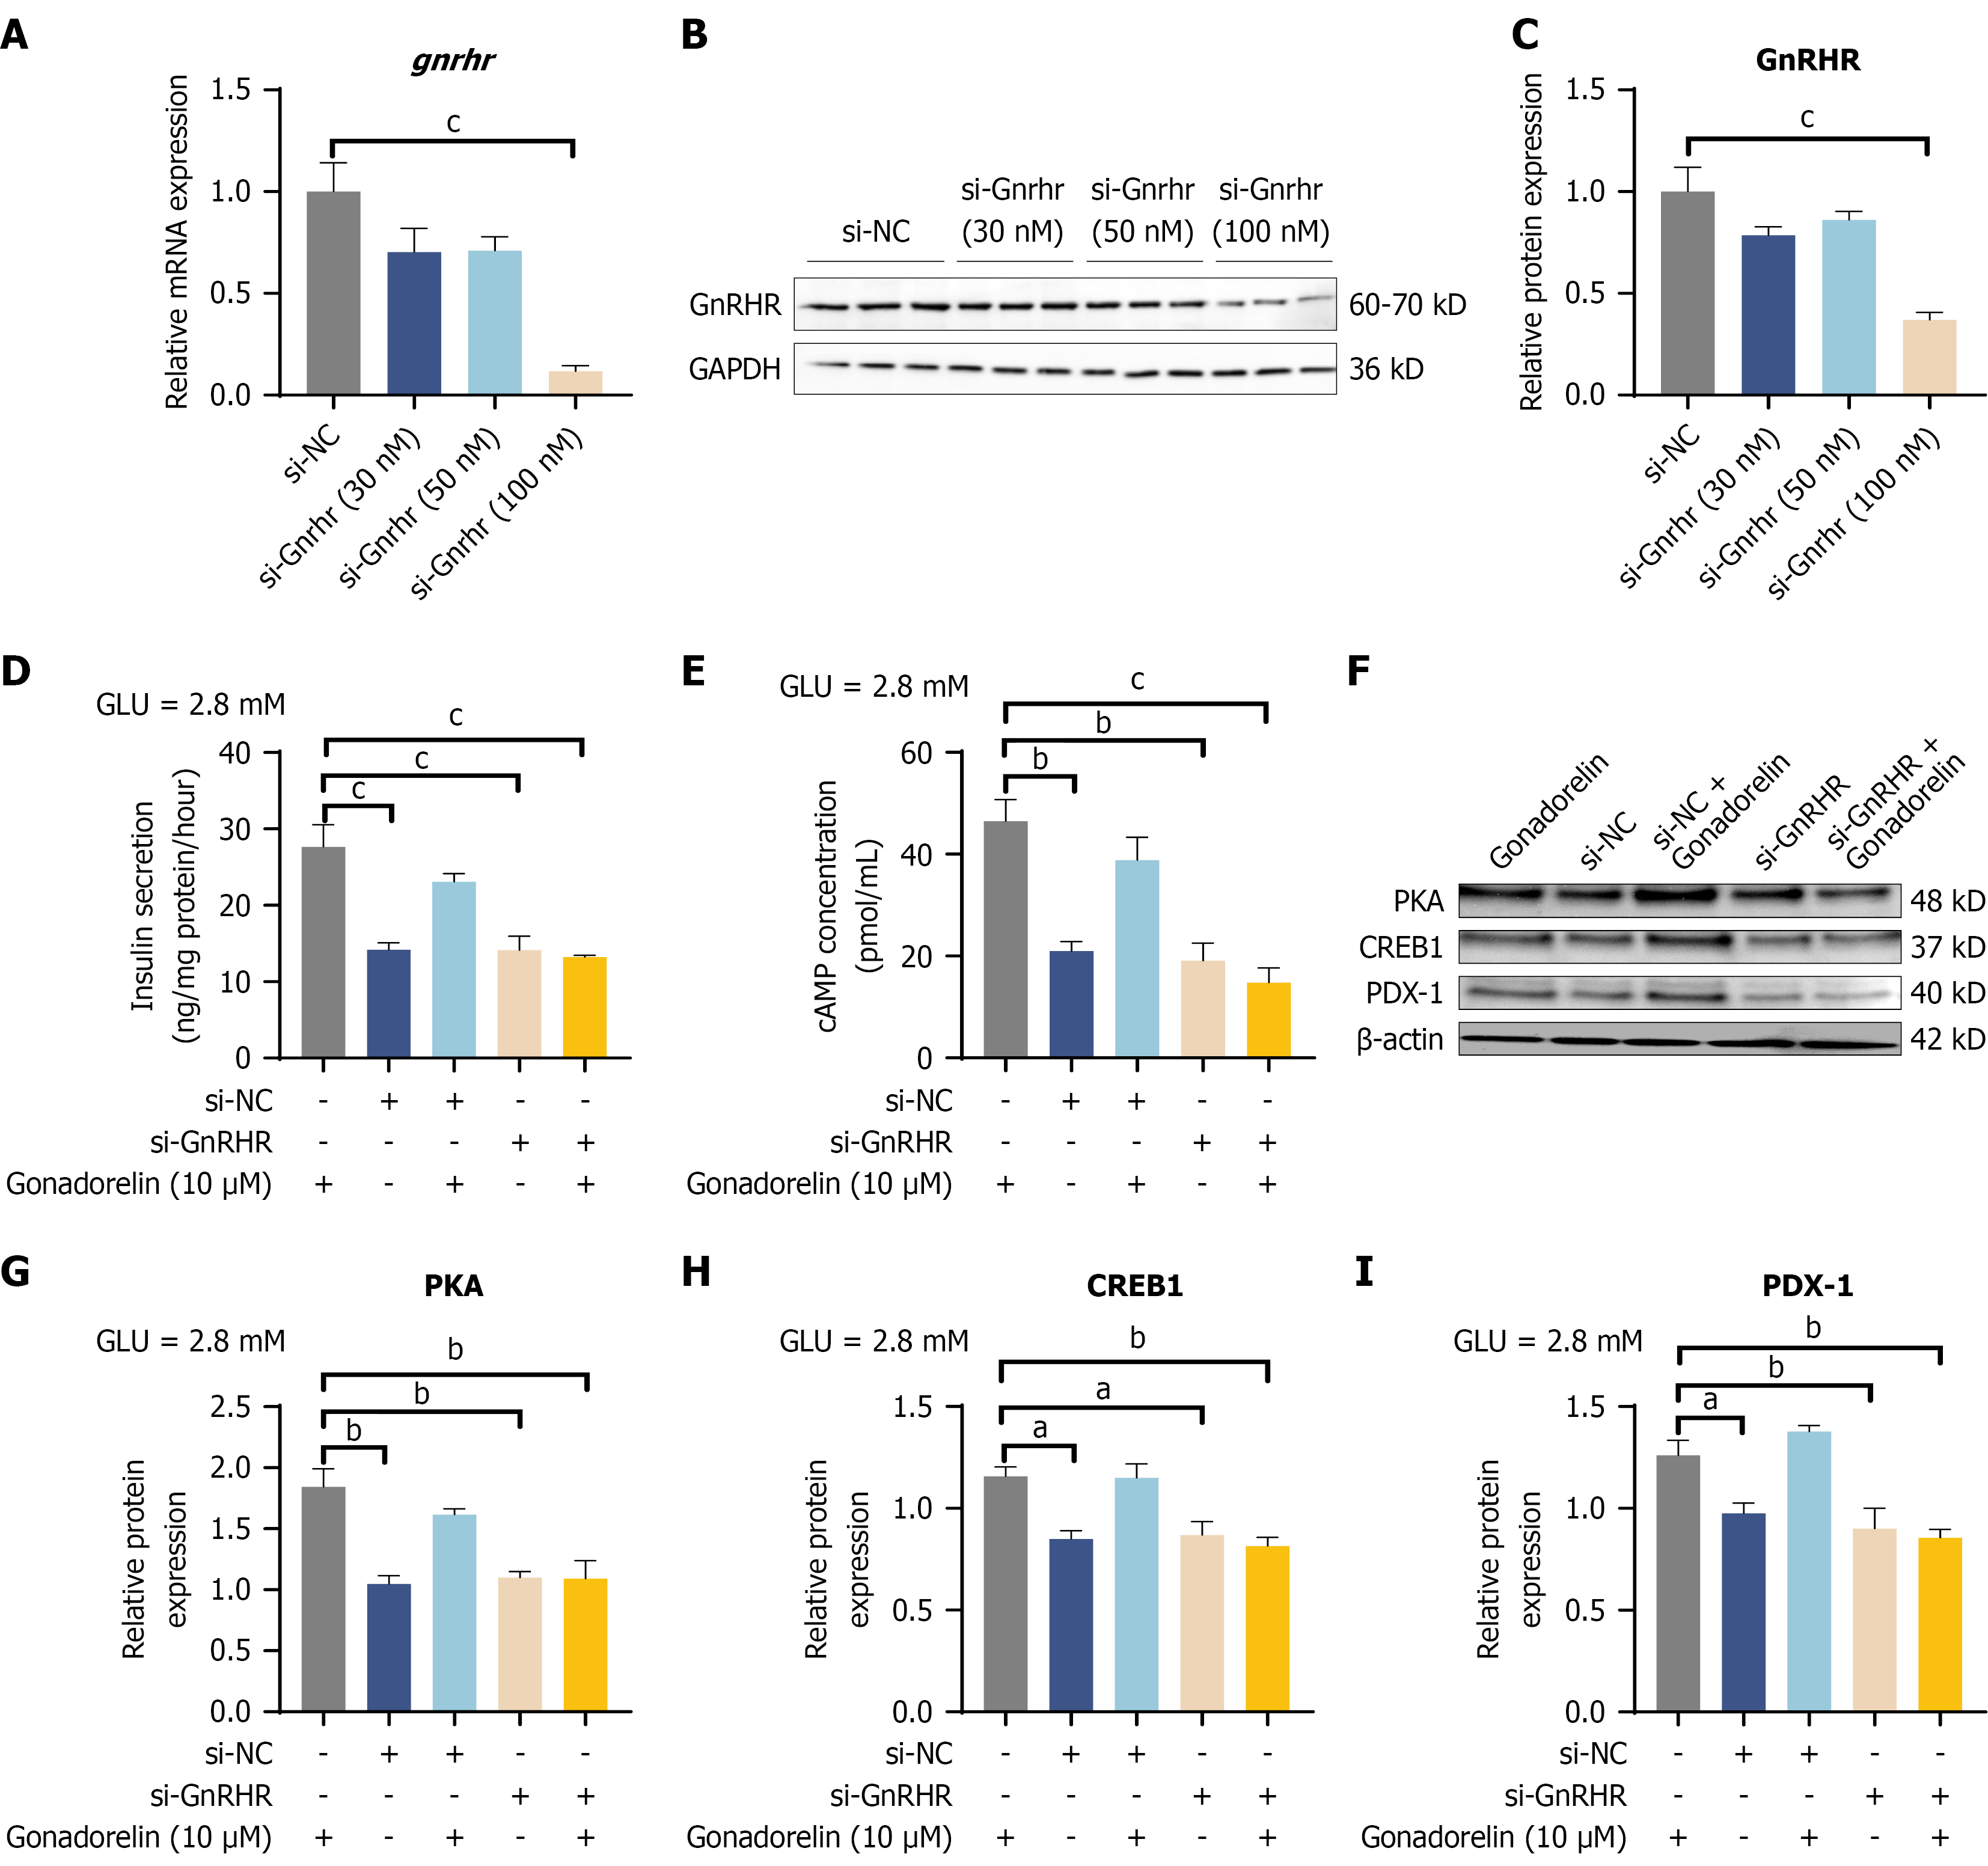
Figure 3 Requirement of gonadotropin-releasing hormone receptor for gonadorelin-mediated signaling and insulin secretion.
A-C: Validation of the knockdown efficiency of gonadotropin-releasing hormone receptor (GnRHR)-targeting small interfering RNA via western blotting in MIN6 cells; D: Effect of GnRHR silencing on the potentiation of insulin secretion by gonadorelin; E: Effect of GnRHR silencing on gonadorelin-induced intracellular cAMP production; F-I: Representative immunoblots and corresponding densitometric quantification demonstrating that GnRHR deficiency abolishes the gonadorelin-induced phosphorylation of PKA and CREB, as well as the upregulation of PDX1. Data are presented as the mean ± SEM (n = 3 independent biological replicates). aP < 0.05, bP < 0.01, and cP < 0.001. GnRHR: Gonadotropin-releasing hormone receptor.
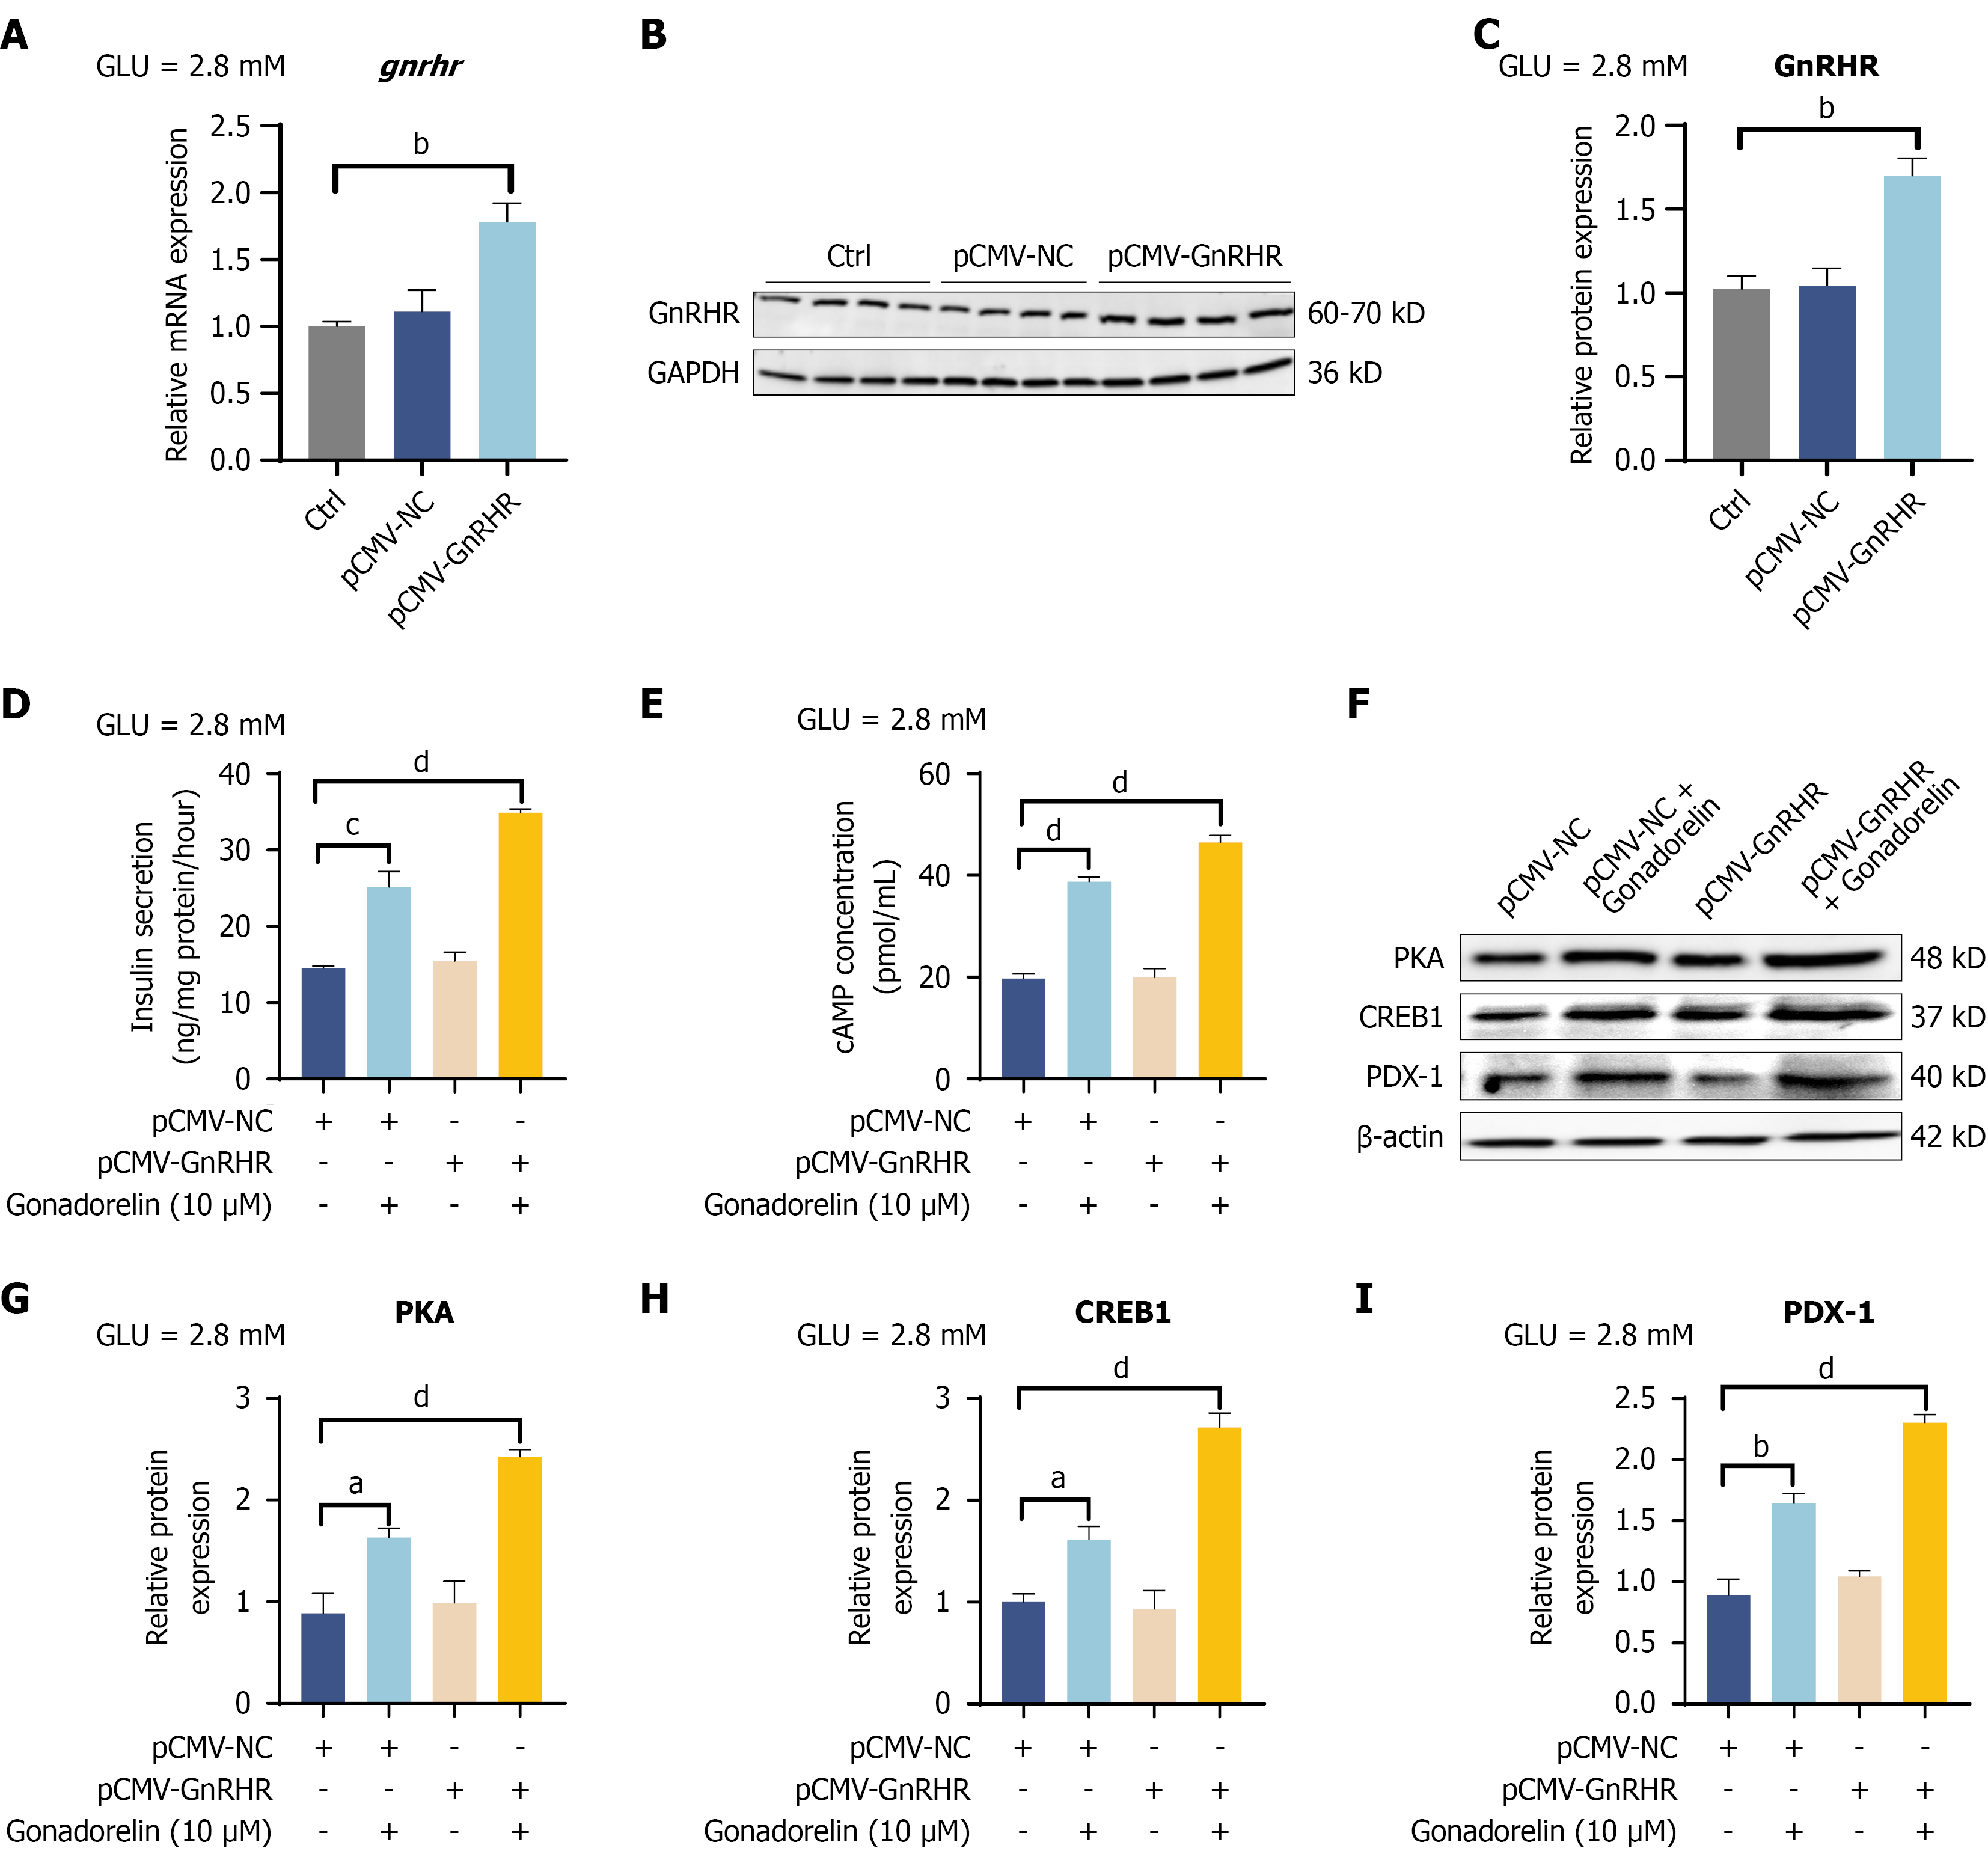
Figure 4 Overexpression of gonadotropin-releasing hormone receptor sensitizes β-cells to gonadorelin-induced signaling.
A-C: Verification of gonadotropin-releasing hormone receptor (GnRHR) overexpression at the protein level following transfection with the plasmid cytomegalovirus-GnRHR plasmid in MIN6 cells; D-I: Representative immunoblots and corresponding densitometric analysis revealing the augmented phosphorylation of PKA and CREB, as well as the increased expression of PDX1, in GnRHR-overexpressing cells compared to empty vector controls upon gonadorelin stimulation. Data are expressed as the mean ± SEM (n = 3 independent biological replicates). aP < 0.05, bP < 0.01, cP < 0.001, and dP < 0.0001. pCMV: Plasmid cytomegalovirus; GnRHR: Gonadotropin-releasing hormone receptor.
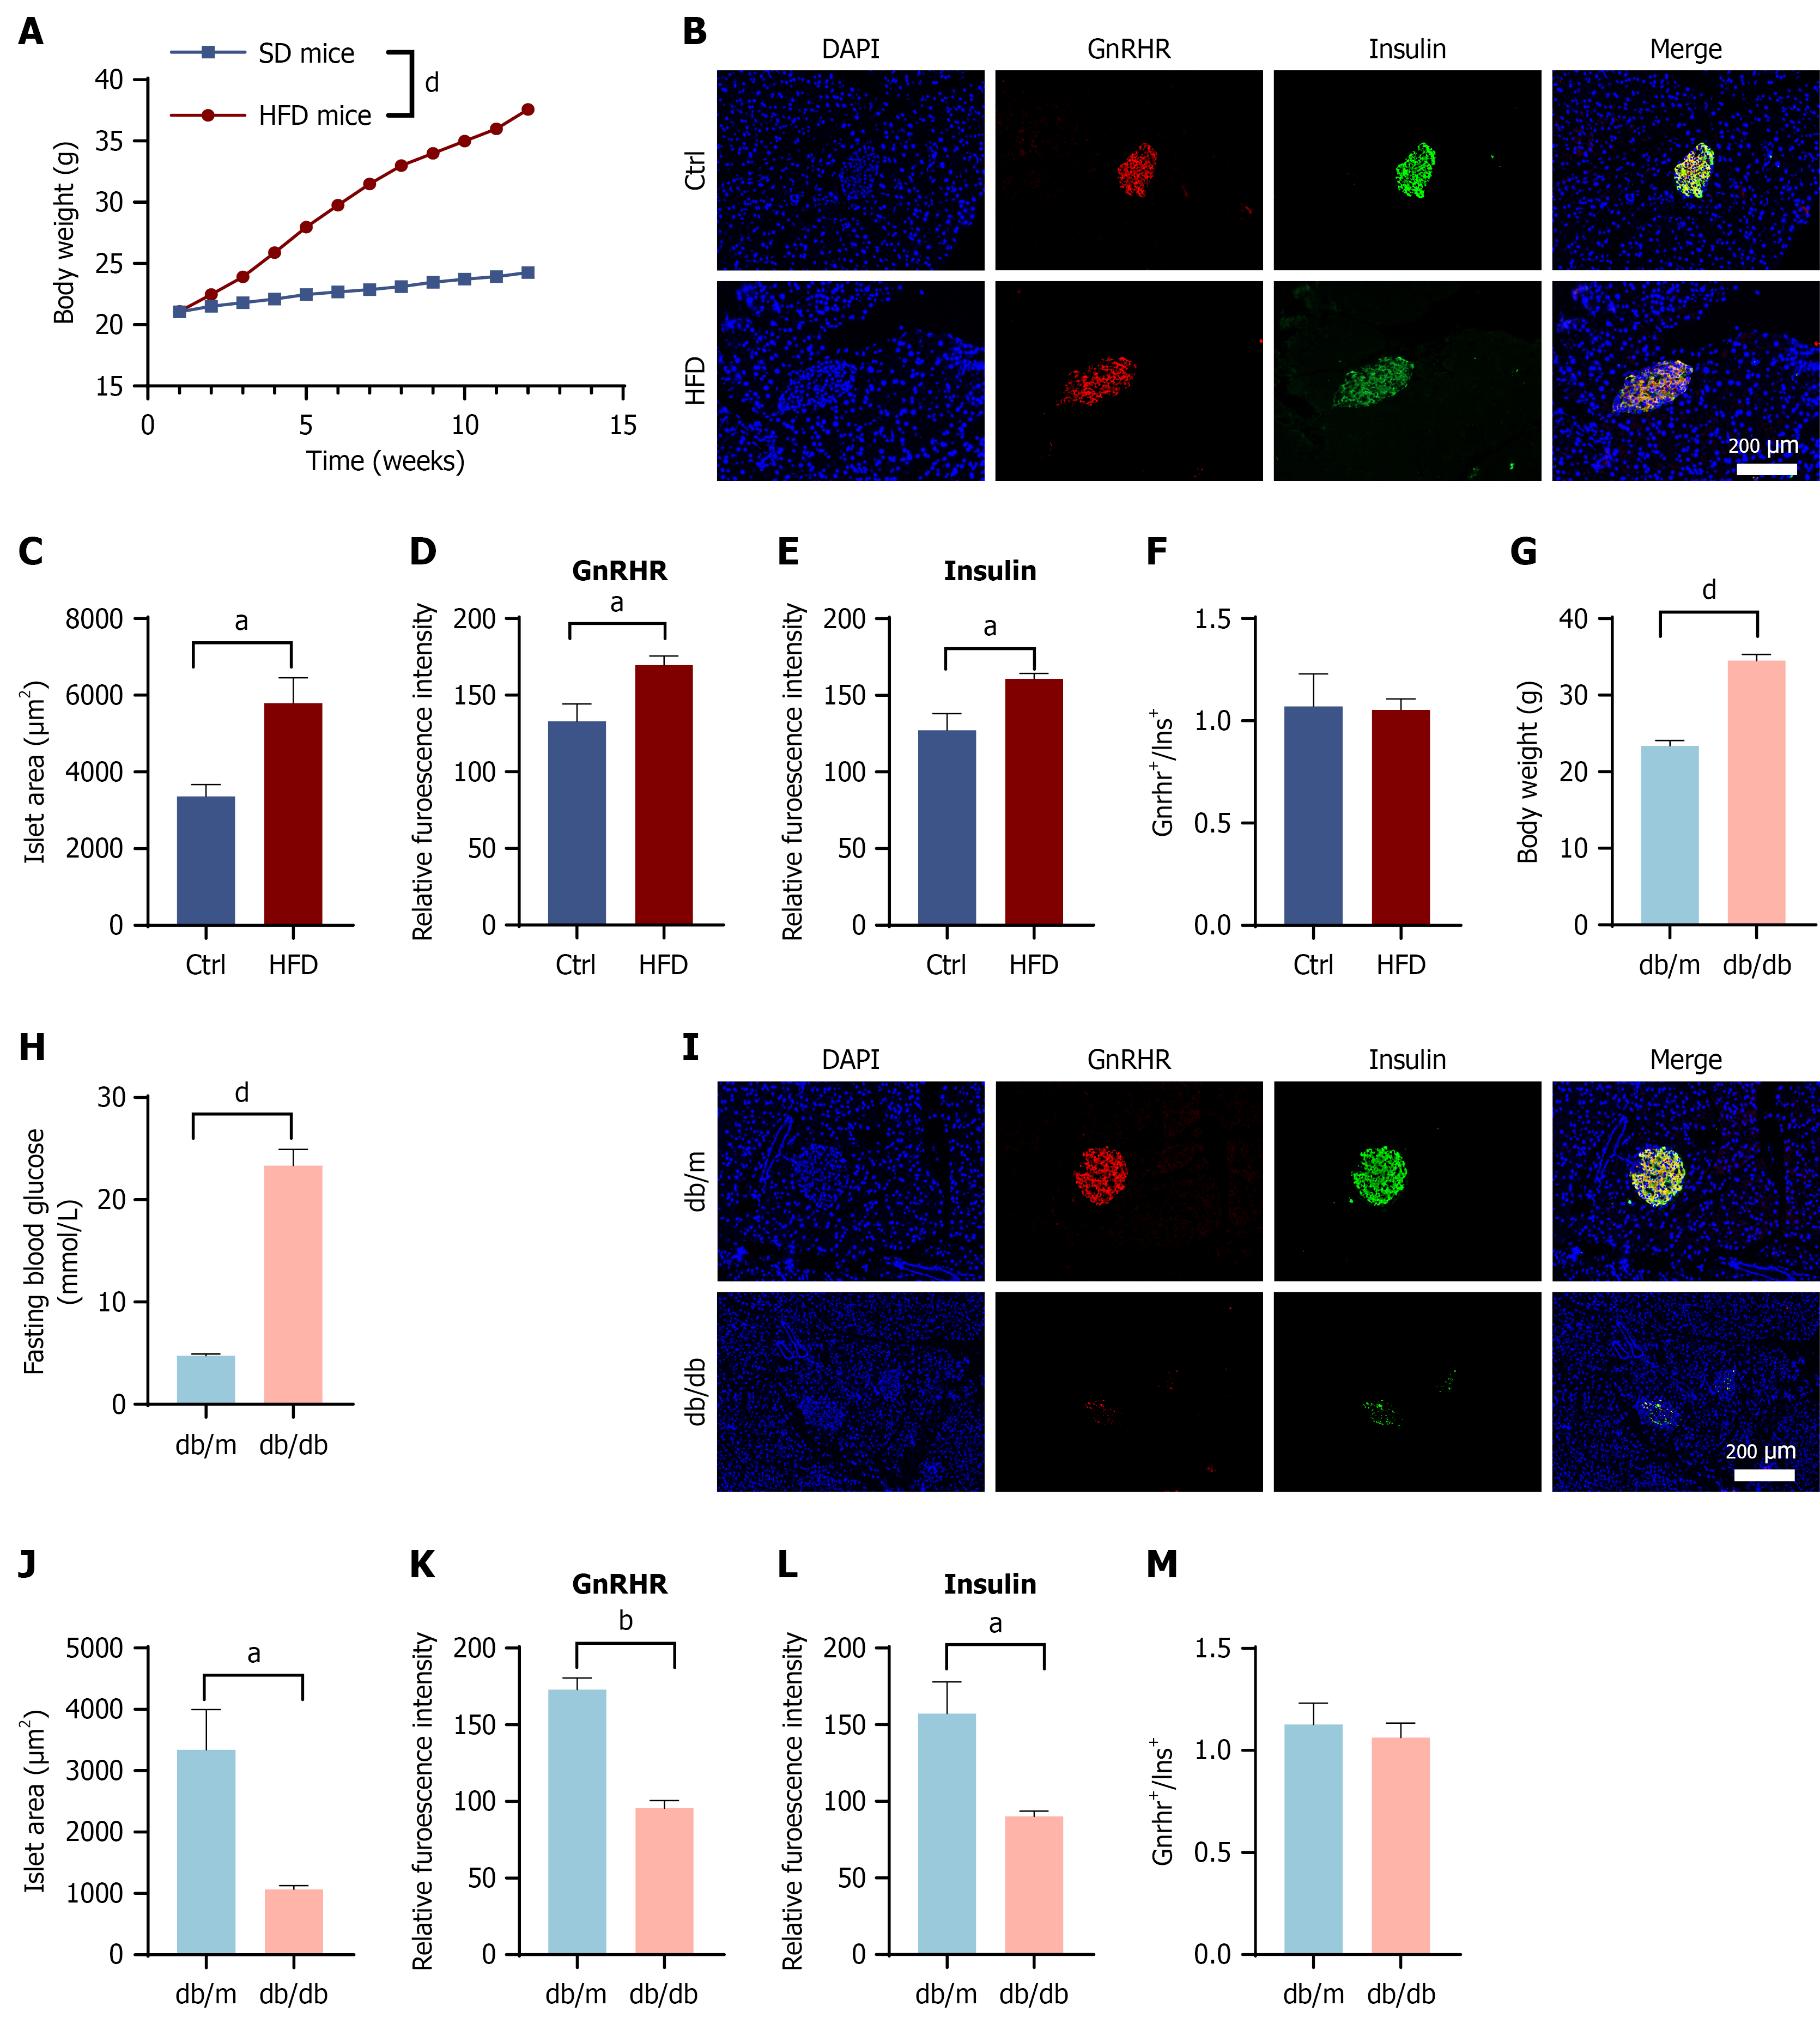
Figure 5 Synchronous downregulation of gonadotropin-releasing hormone receptor and insulin expression in pancreatic β-cells under chronic metabolic stress.
A-F: Alterations in gonadotropin-releasing hormone receptor (GnRHR) expression in high-fat diet-induced obese mice. Body weight trajectories of C57BL/6J mice fed a standard chow (control) or high-fat diet (A). Representative double immunofluorescence staining of pancreatic islets for GnRHR (red) and insulin (green). Nuclei were counterstained with DAPI (blue). Scale bar = 200 μm (B). Quantitative analysis of islet morphology and protein expression: Mean islet area (C); mean fluorescence intensity (MFI) of GnRHR (D); MFI of insulin (E); and the ratio of GnRHR to insulin fluorescence (F); G-M: Alterations in GnRHR expression in db/db diabetic mice. Metabolic characterization of db/m (control) and db/db mice: Body weight (G) and fasting blood glucose levels (H). Representative immunofluorescence images of islets stained for GnRHR (red) and insulin (green) (I). Quantitative analysis of diabetic islets: Mean islet area (J); MFI of GnRHR (K); MFI of insulin (L); and the ratio of GnRHR to insulin fluorescence (M). Data are presented as the mean ± SEM. Statistical significance was determined by Student’s t test. aP < 0.05, bP < 0.01, and dP < 0.0001. HFD: High-fat diet; GnRHR: Gonadotropin-releasing hormone receptor.
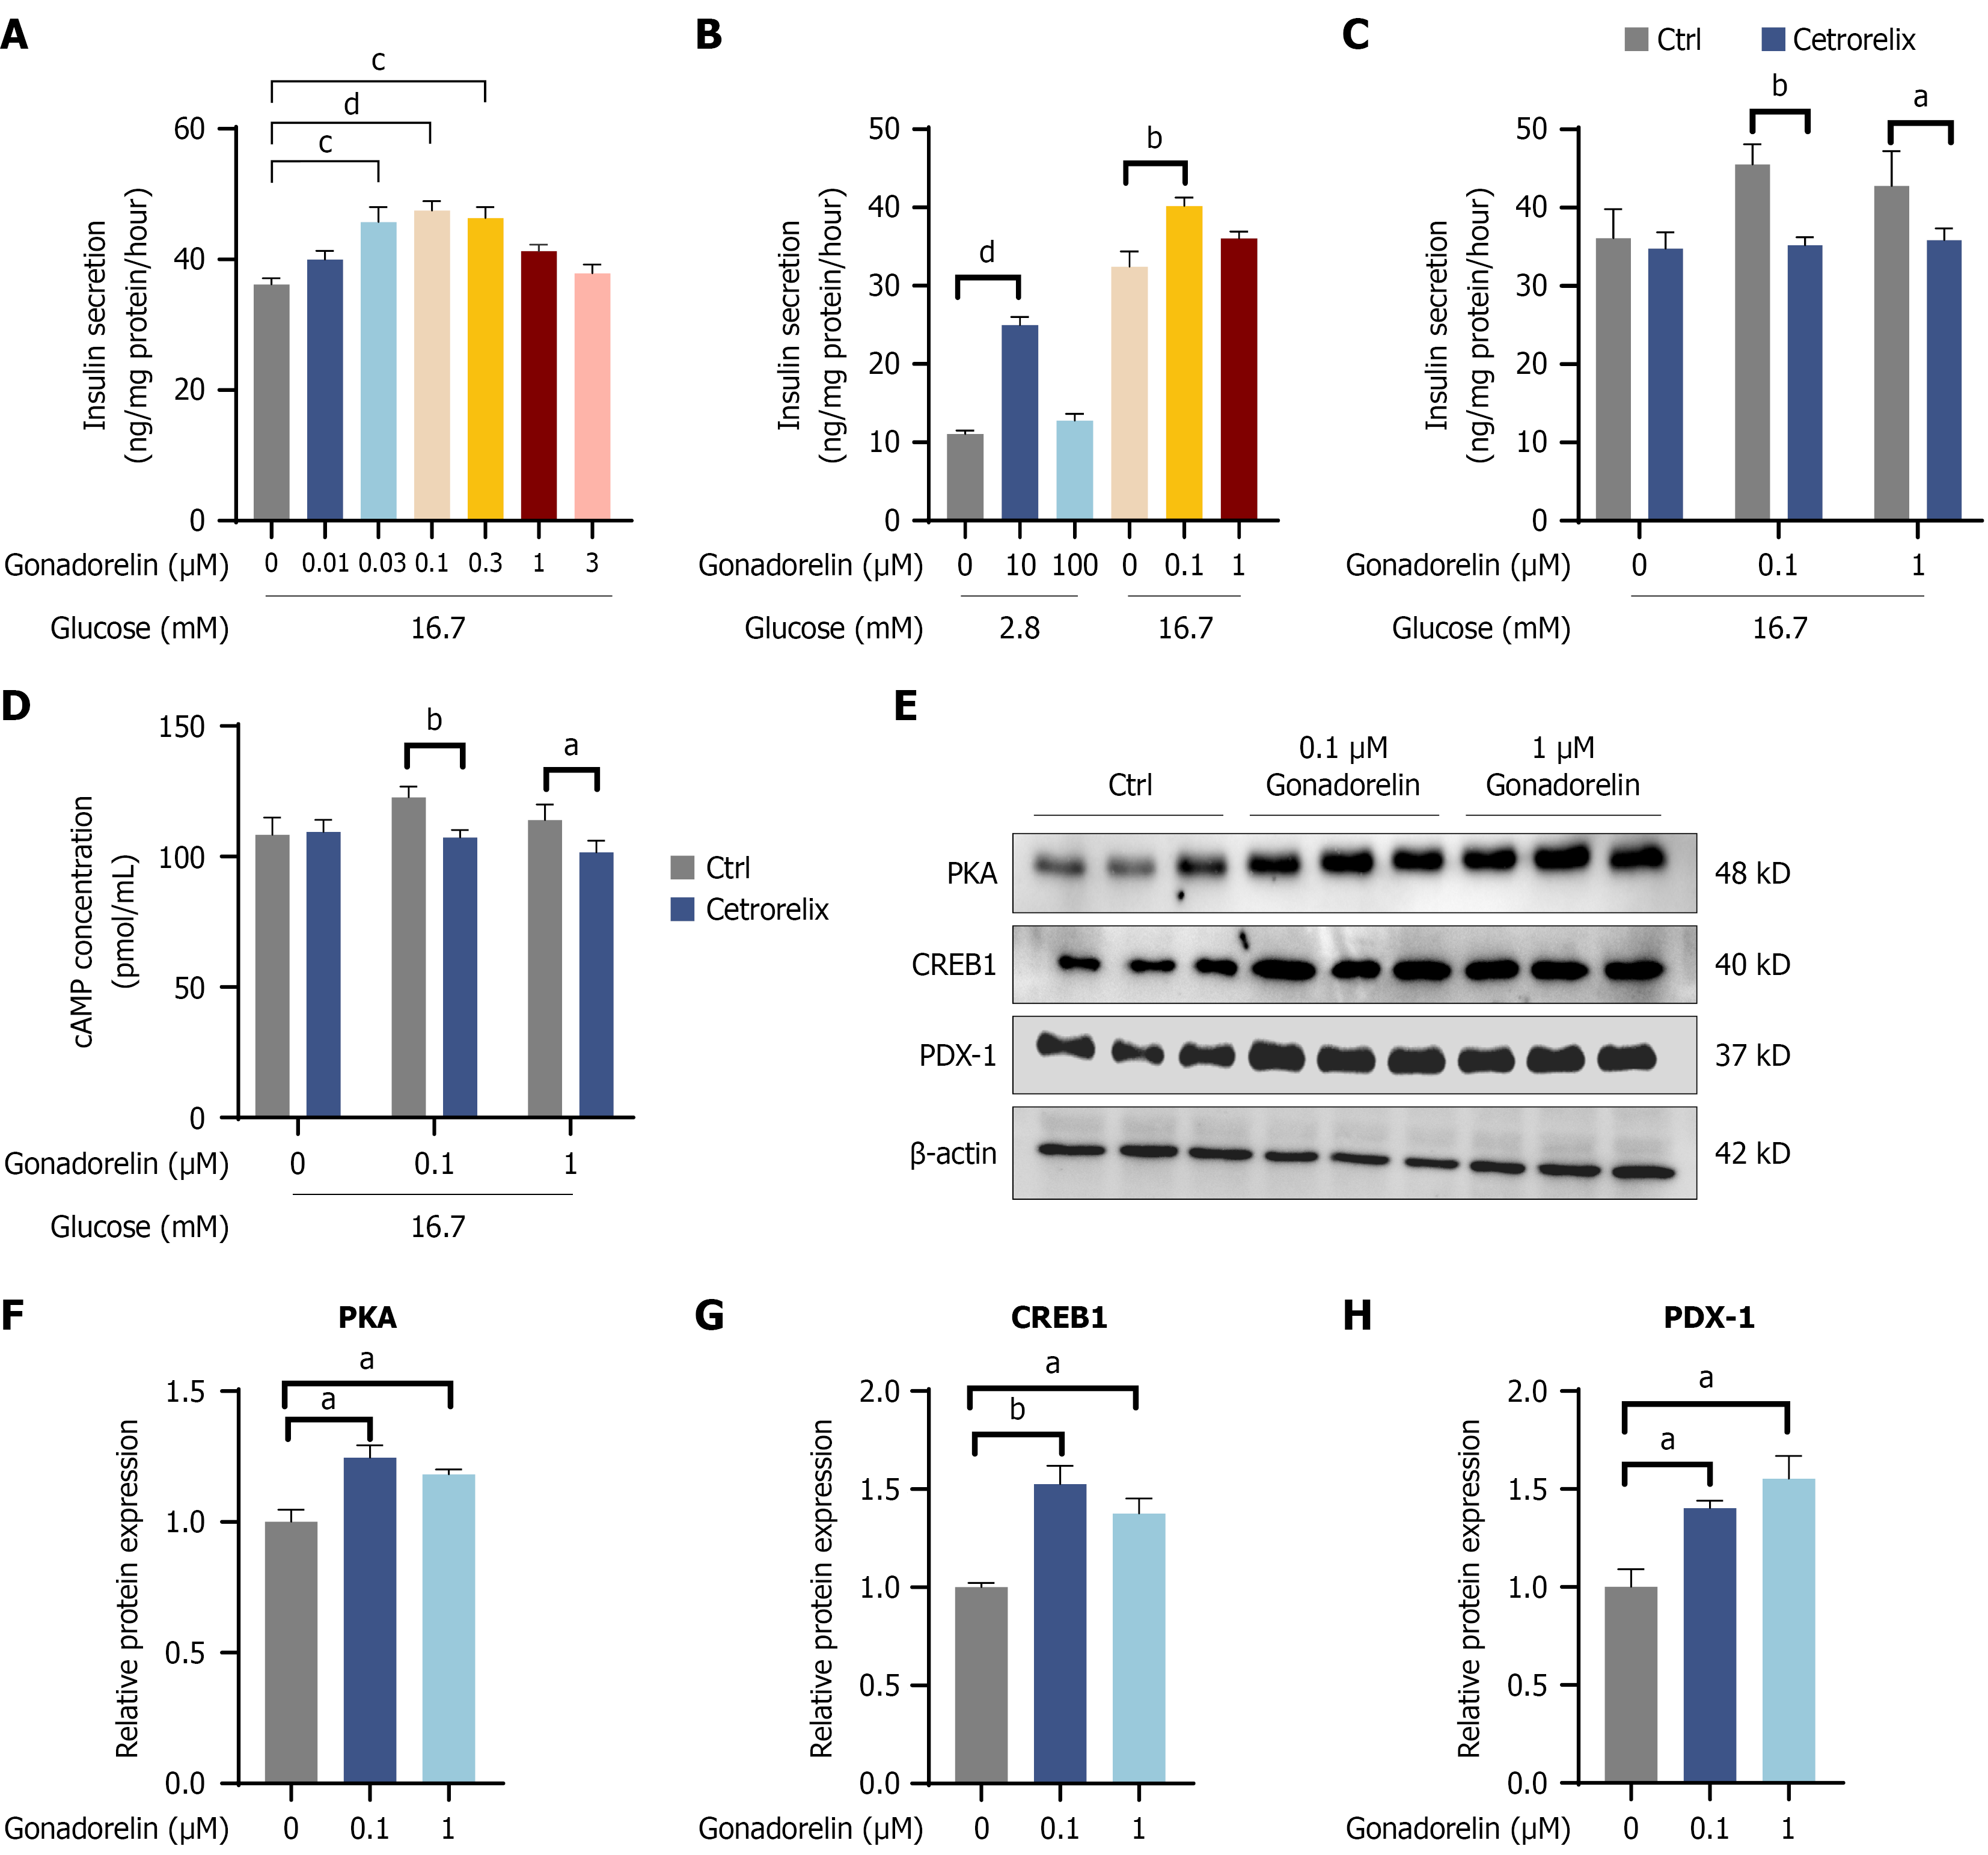
Figure 6 Gonadorelin potentiates glucose-stimulated insulin secretion in MIN6 cells.
A: Dose-response analysis of gonadorelin-mediated insulin secretion under hyperglycemic conditions (16.7 mmol/L glucose); B: Comparison of absolute insulin release levels, demonstrating the synergistic effect of gonadorelin on basal glucose-stimulated insulin secretion; C: Pharmacological inhibition of the gonadorelin-mediated insulinotropic effect by the specific gonadotropin-releasing hormone receptor antagonist cetrorelix; D-H: Representative immunoblots and corresponding densitometric quantification of the phosphorylation and expression of signaling effectors (PKA, CREB1, and PDX1) under high-glucose conditions. Statistical analysis: Data are expressed as the mean ± SEM (n = 3 independent biological replicates). Statistical significance was determined using one-way ANOVA, followed by Tukey’s post hoc test. aP < 0.05, bP < 0.01, cP < 0.001, and dP < 0.0001.
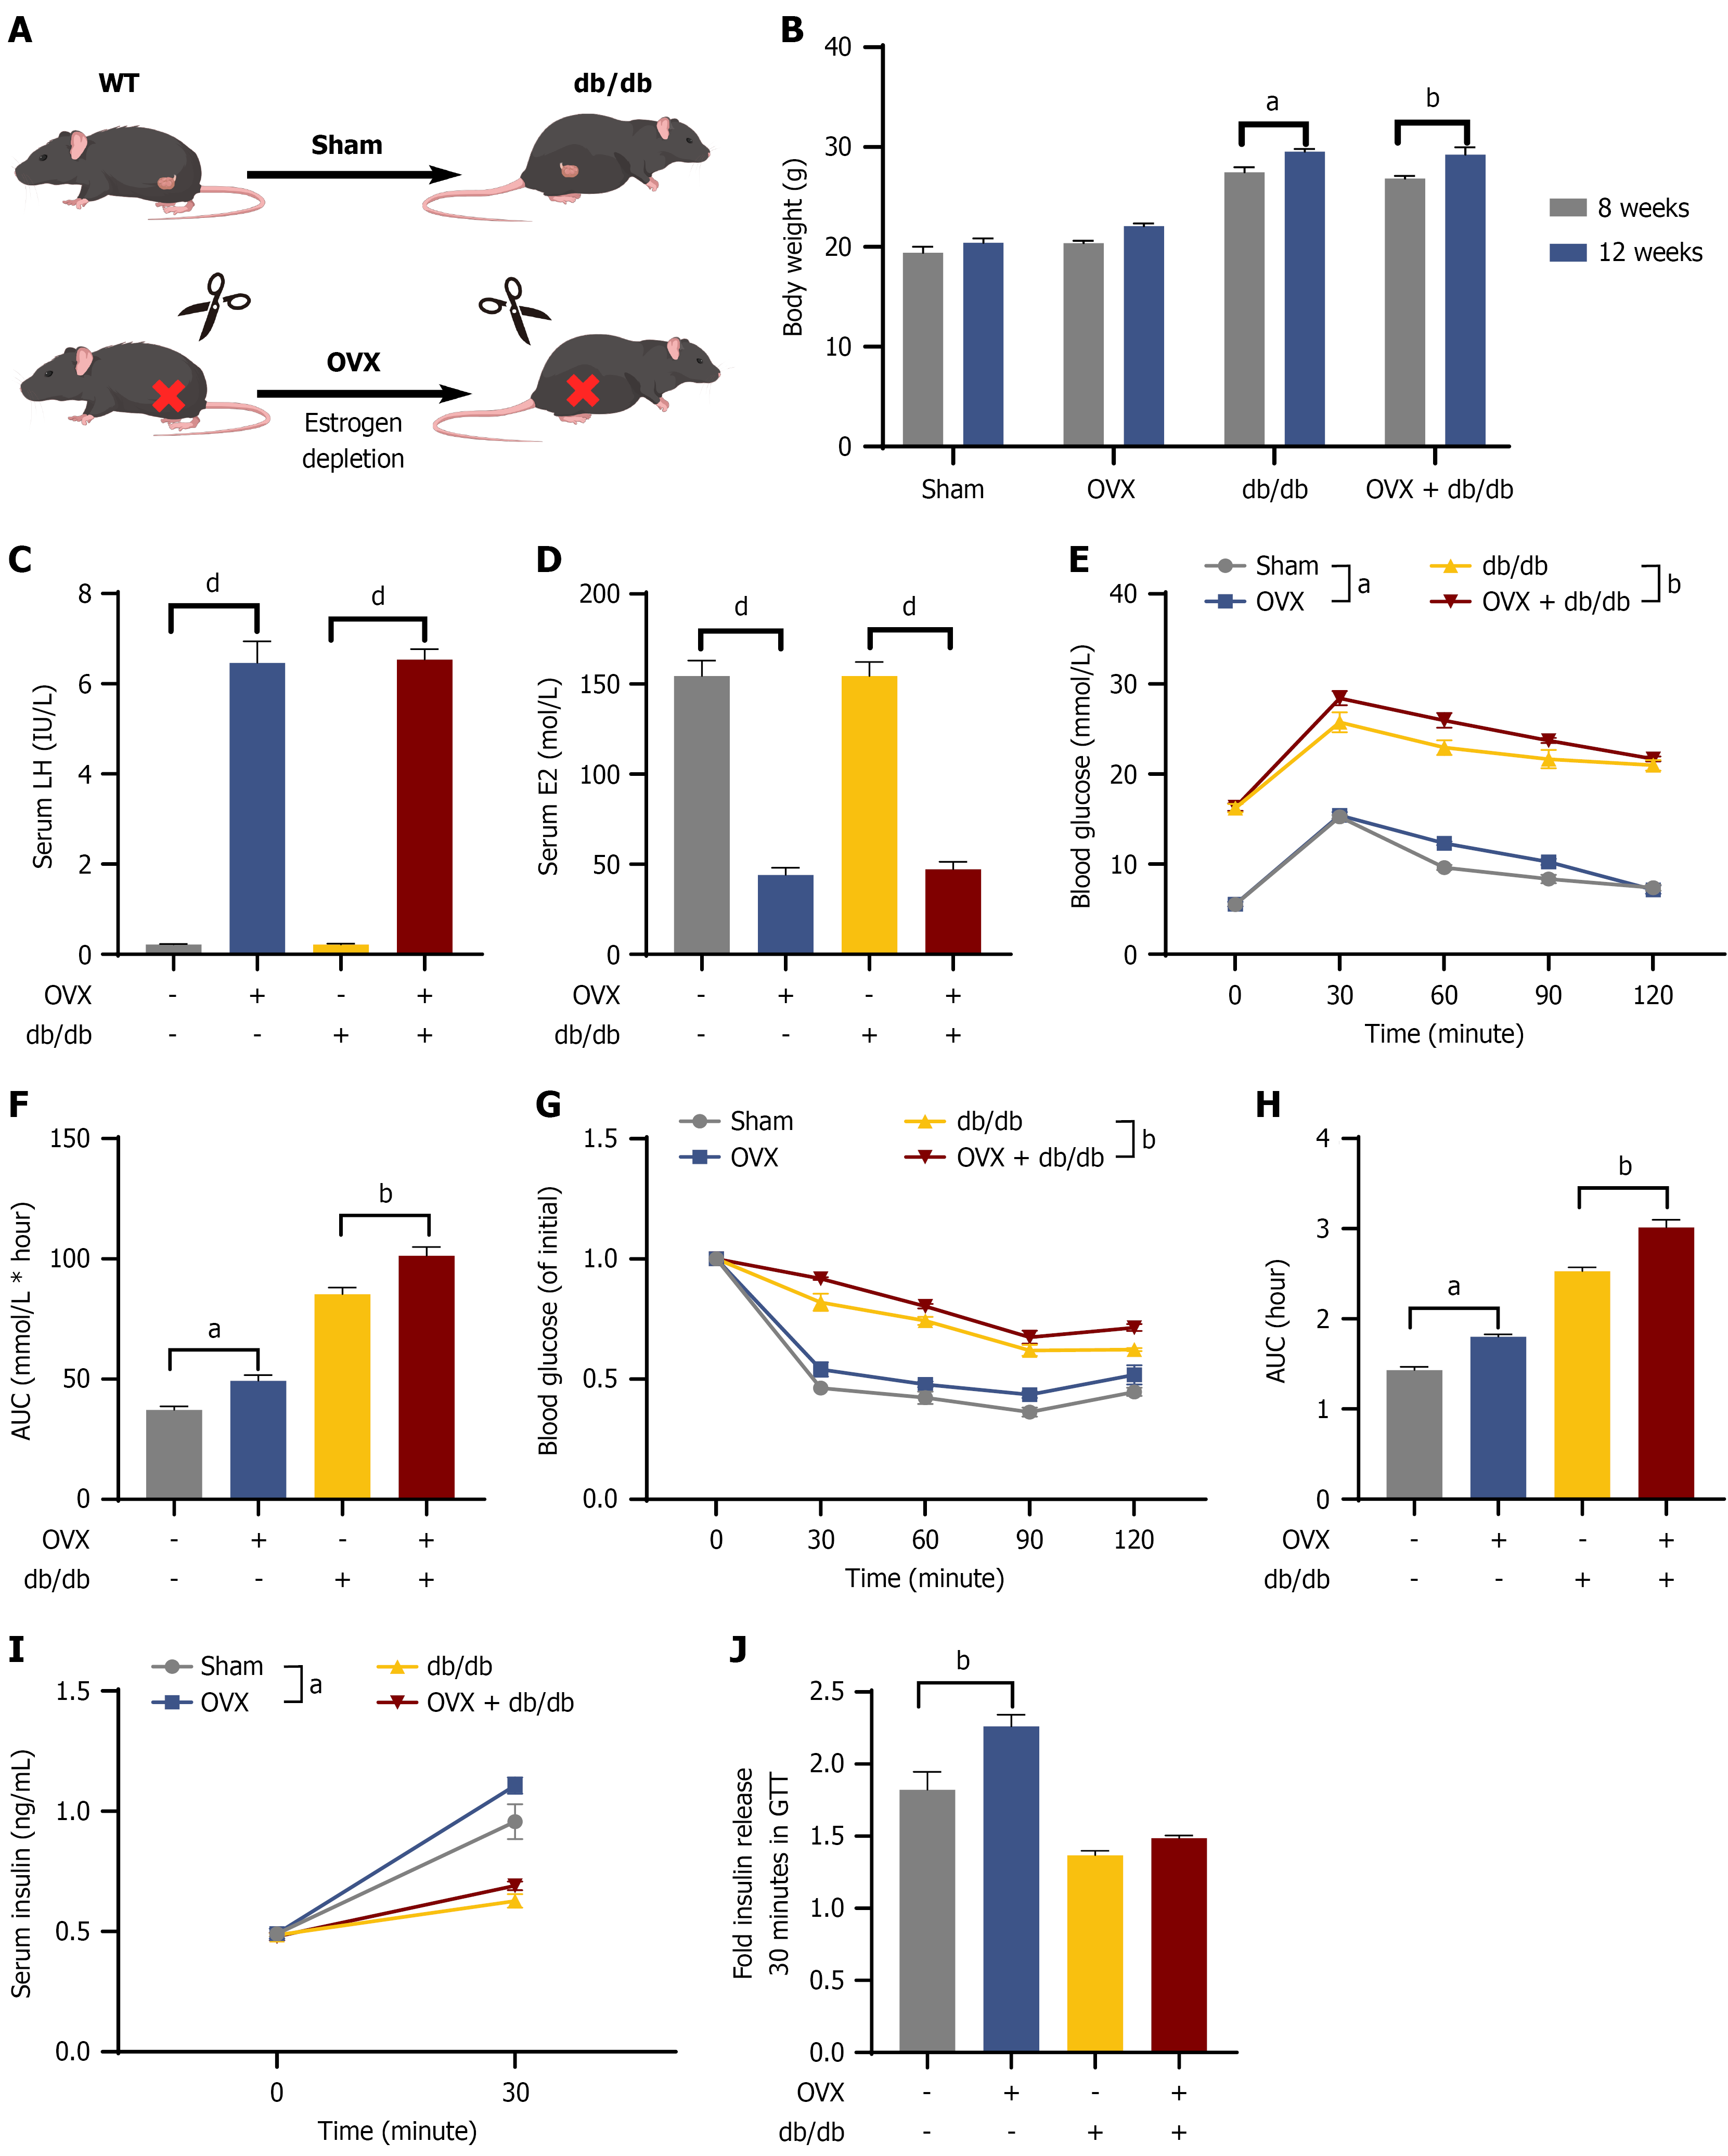
Figure 7 High-endogenous-gonadotropin-releasing hormone milieu is associated with β-cell compensation in vivo.
A: Experimental workflow illustrating the grouping and surgical interventions (sham and ovariectomy) in wild-type and db/db mice; B: Progressive body weight trajectories across the four experimental cohorts; C and D: Serum concentrations of luteinizing hormone (C) and estradiol (D), confirming the successful establishment of the high-gonadotropin-releasing hormone and hypoestrogenic model; E-H: Systemic glucose and insulin homeostasis assessment: Representative curves and corresponding areas under the curve for intraperitoneal glucose tolerance tests (E and F) and insulin tolerance tests (G and H); I and J: Functional evaluation of β-cell compensation: Serum insulin concentrations during the intraperitoneal glucose tolerance tests (I); fold change in insulin secretion (30 minutes vs 0 minute post-glucose challenge), reflecting augmented secretory responsiveness in ovariectomy mice relative to sham controls (J). Data are expressed as the mean ± SEM (n = 8-10 animals per group). aP < 0.05, bP < 0.01, and dP < 0.0001. OVX: Ovariectomy; WT: Wild-type; AUC: Area under the curve.
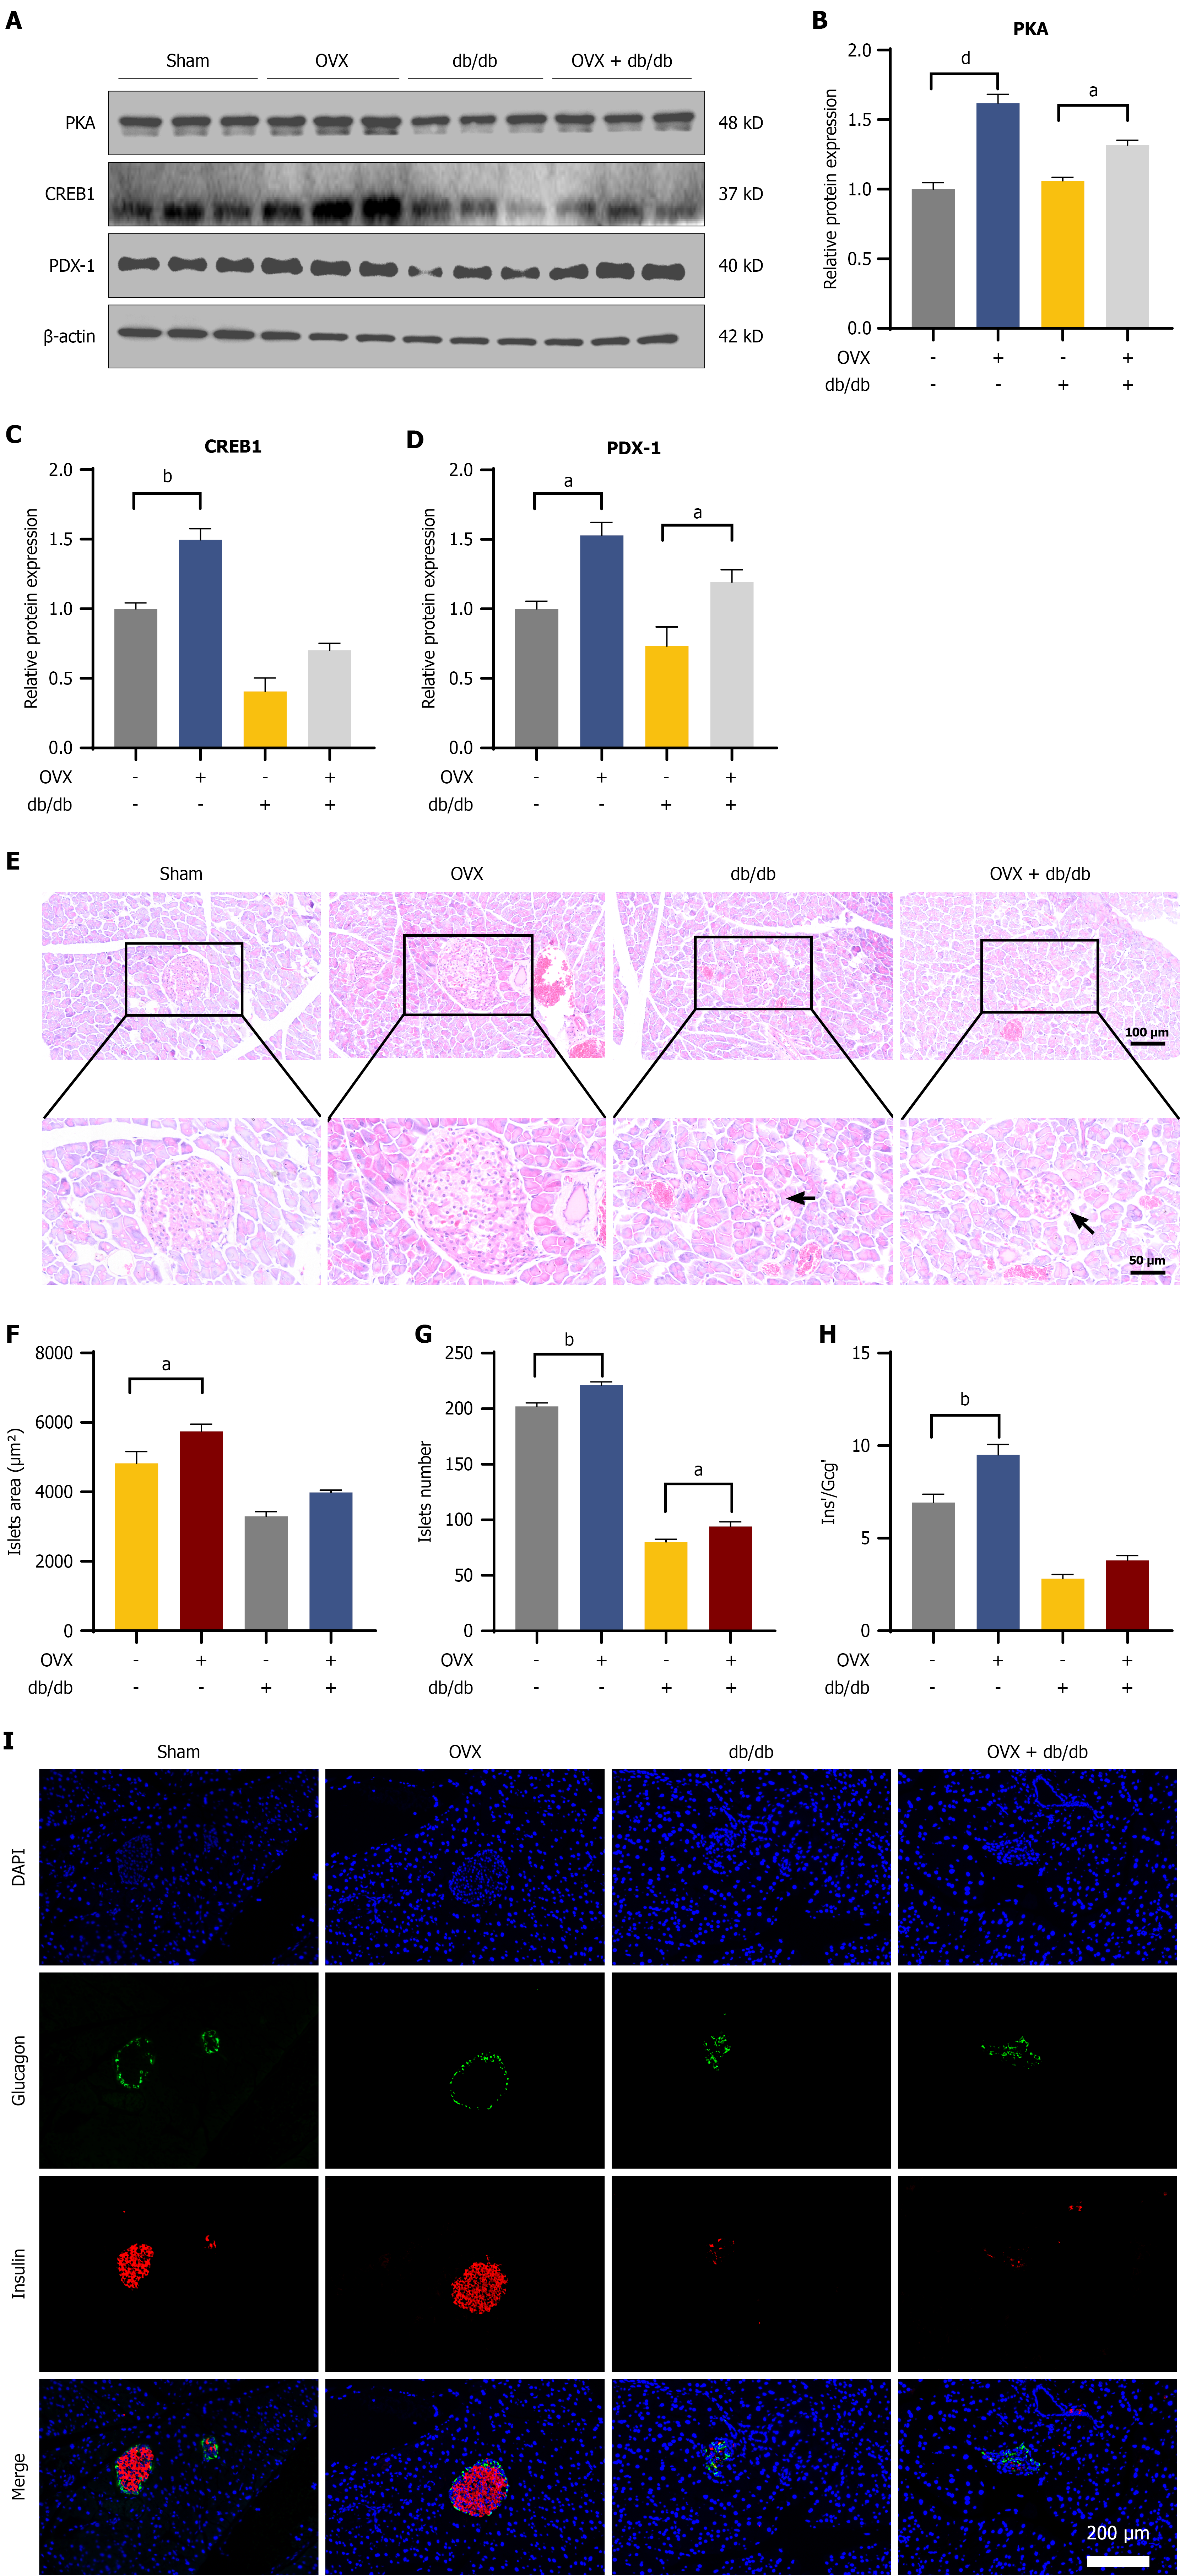
Figure 8 Gonadotropin-releasing hormone-associated compensatory signaling is limited by islet structural deterioration in advanced diabetes.
A-D: Representative immunoblots and densitometric quantification of PKA, CREB1, and PDX1 in isolated islets; E: Representative hematoxylin and eosin staining of pancreatic sections; arrowheads denote islet atrophy and structural disarray in diabetic cohorts (scale bars: 100 μm and 50 μm). F and G: Quantitative analysis of mean islet area (F) and total islet number (G); H: Β-to-α cell area ratio; I: Dual-immunofluorescence staining for insulin (red) and glucagon (green). Nuclei were counterstained with DAPI (blue). Scale bar: 200 μm. Data are expressed as the mean ± SEM (n = 8-10 animals per group). aP < 0.05, bP < 0.01, and dP < 0.0001. OVX: Ovariectomy.
- Citation: Dai XJ, Gao SC, Chen PT, Yang L, Kong CC, Ye CY, Xu ZX, Hu YX, He CY, Zuo ZH, Wang W. Postmenopausal high-gonadotropin-releasing hormone environment mediates pancreatic β-cell compensation via the cAMP-PKA-PDX1 pathway. World J Diabetes 2026; 17(11): 121630
- URL: https://www.wjgnet.com/1948-9358/full/v17/i11/121630.htm
- DOI: https://dx.doi.org/10.4239/wjd.121630