
















Copyright: ©Author(s) 2026.
World J Diabetes. Nov 15, 2026; 17(11): 121630
Published online Nov 15, 2026. doi: 10.4239/wjd.121630
Published online Nov 15, 2026. doi: 10.4239/wjd.121630
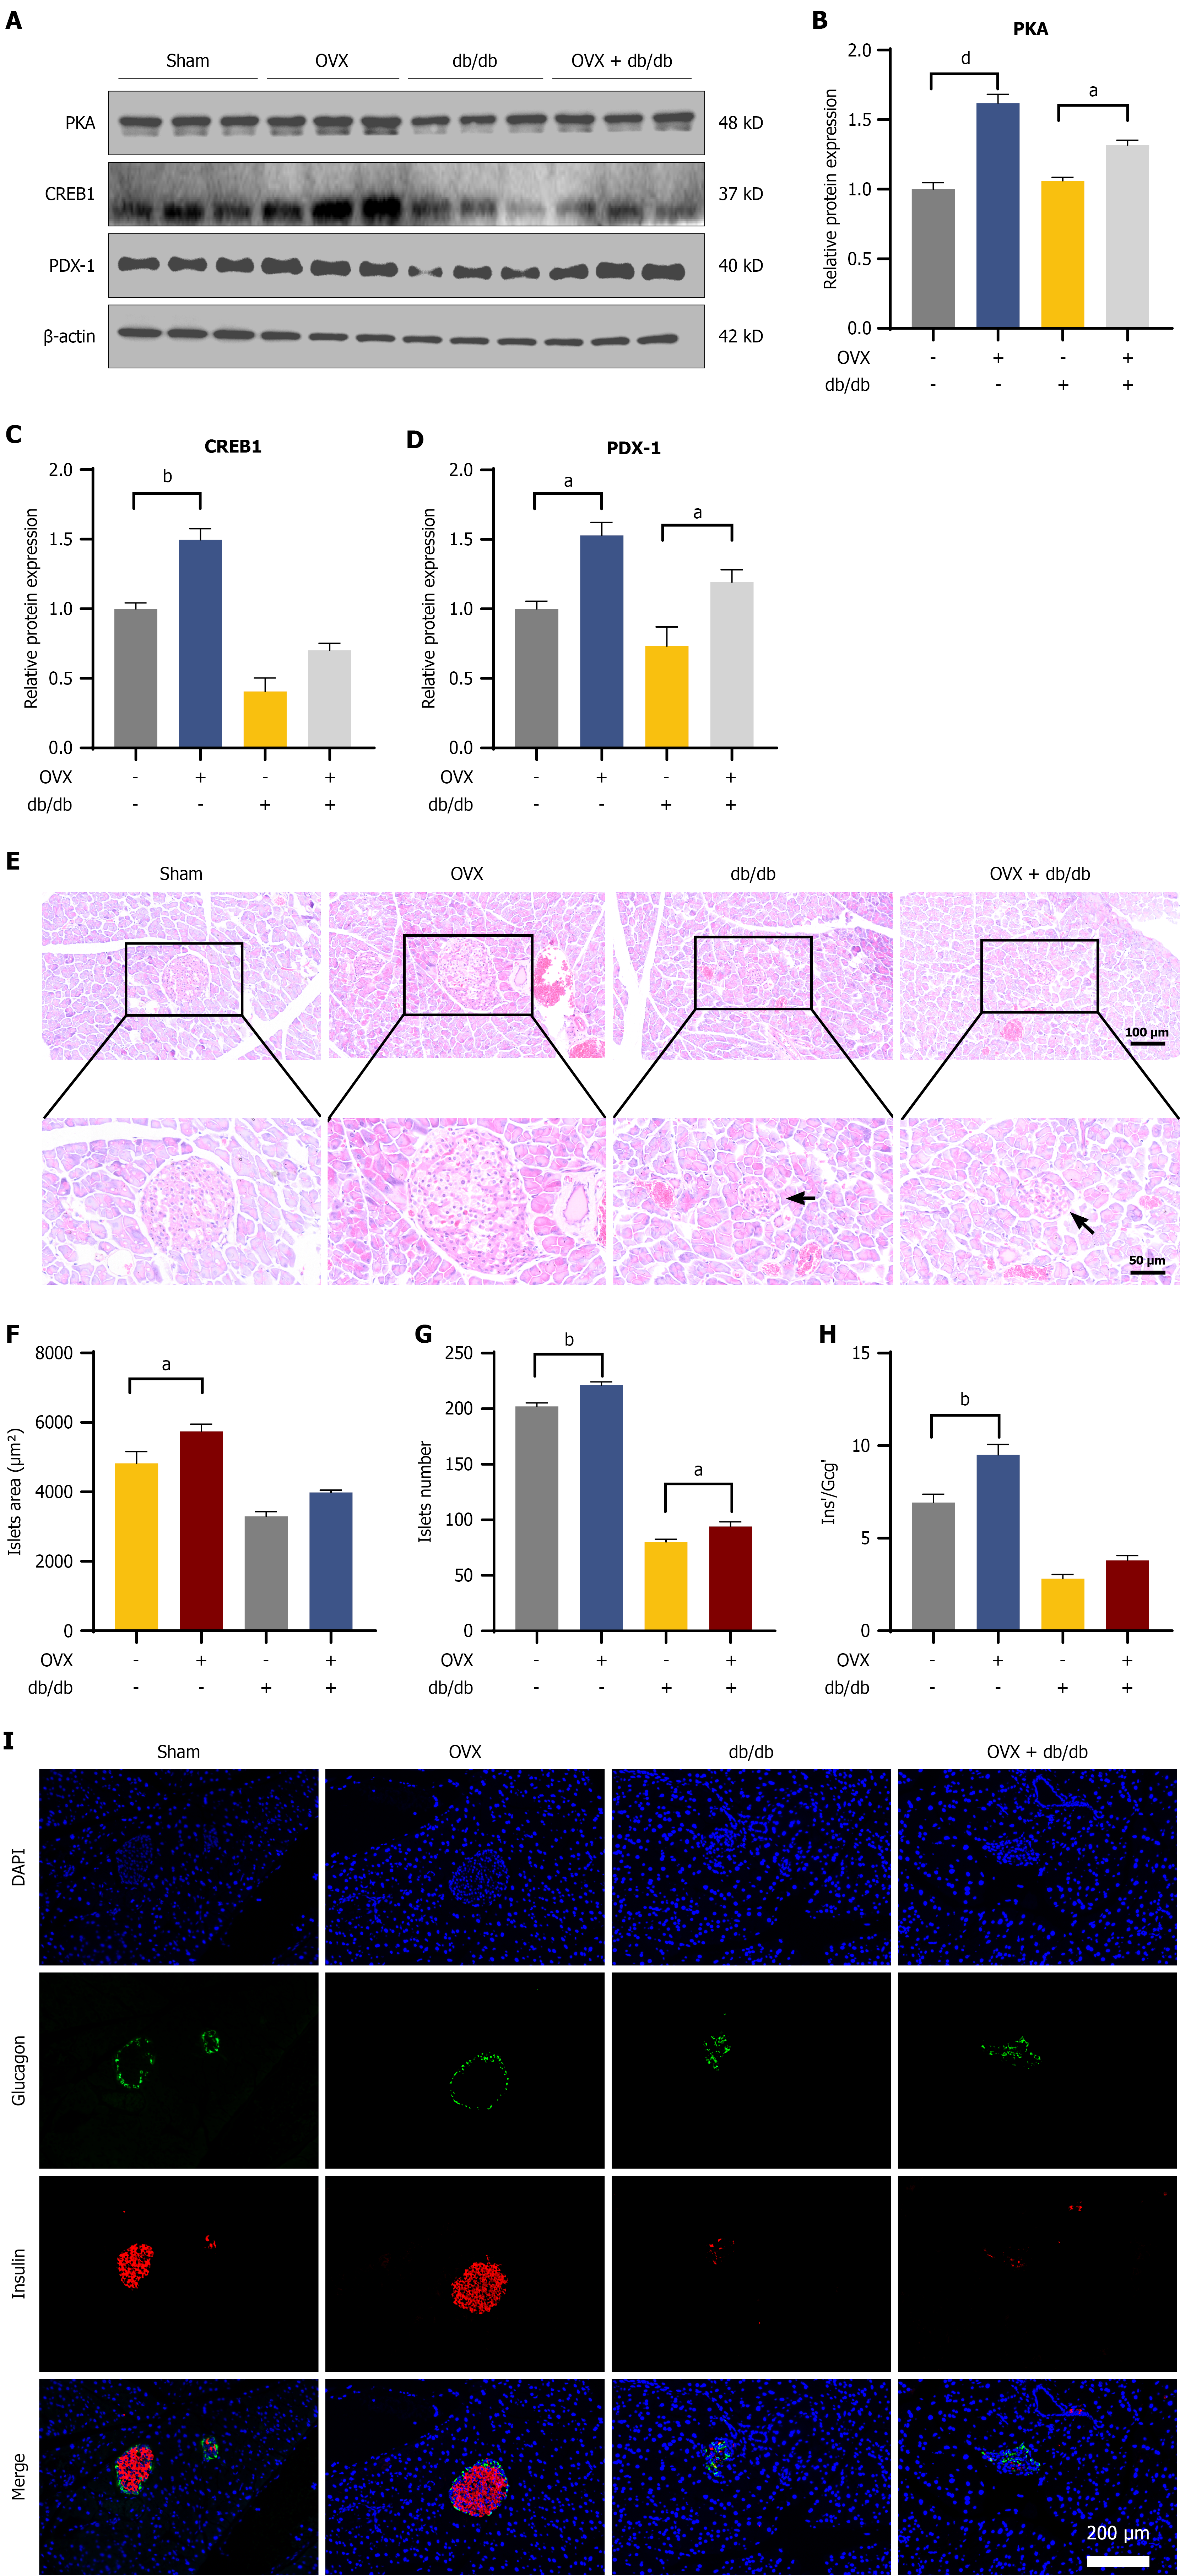
Figure 8 Gonadotropin-releasing hormone-associated compensatory signaling is limited by islet structural deterioration in advanced diabetes.
A-D: Representative immunoblots and densitometric quantification of PKA, CREB1, and PDX1 in isolated islets; E: Representative hematoxylin and eosin staining of pancreatic sections; arrowheads denote islet atrophy and structural disarray in diabetic cohorts (scale bars: 100 μm and 50 μm). F and G: Quantitative analysis of mean islet area (F) and total islet number (G); H: Β-to-α cell area ratio; I: Dual-immunofluorescence staining for insulin (red) and glucagon (green). Nuclei were counterstained with DAPI (blue). Scale bar: 200 μm. Data are expressed as the mean ± SEM (n = 8-10 animals per group). aP < 0.05, bP < 0.01, and dP < 0.0001. OVX: Ovariectomy.
- Citation: Dai XJ, Gao SC, Chen PT, Yang L, Kong CC, Ye CY, Xu ZX, Hu YX, He CY, Zuo ZH, Wang W. Postmenopausal high-gonadotropin-releasing hormone environment mediates pancreatic β-cell compensation via the cAMP-PKA-PDX1 pathway. World J Diabetes 2026; 17(11): 121630
- URL: https://www.wjgnet.com/1948-9358/full/v17/i11/121630.htm
- DOI: https://dx.doi.org/10.4239/wjd.121630