
















Copyright: ©Author(s) 2026.
World J Diabetes. Nov 15, 2026; 17(11): 121630
Published online Nov 15, 2026. doi: 10.4239/wjd.121630
Published online Nov 15, 2026. doi: 10.4239/wjd.121630
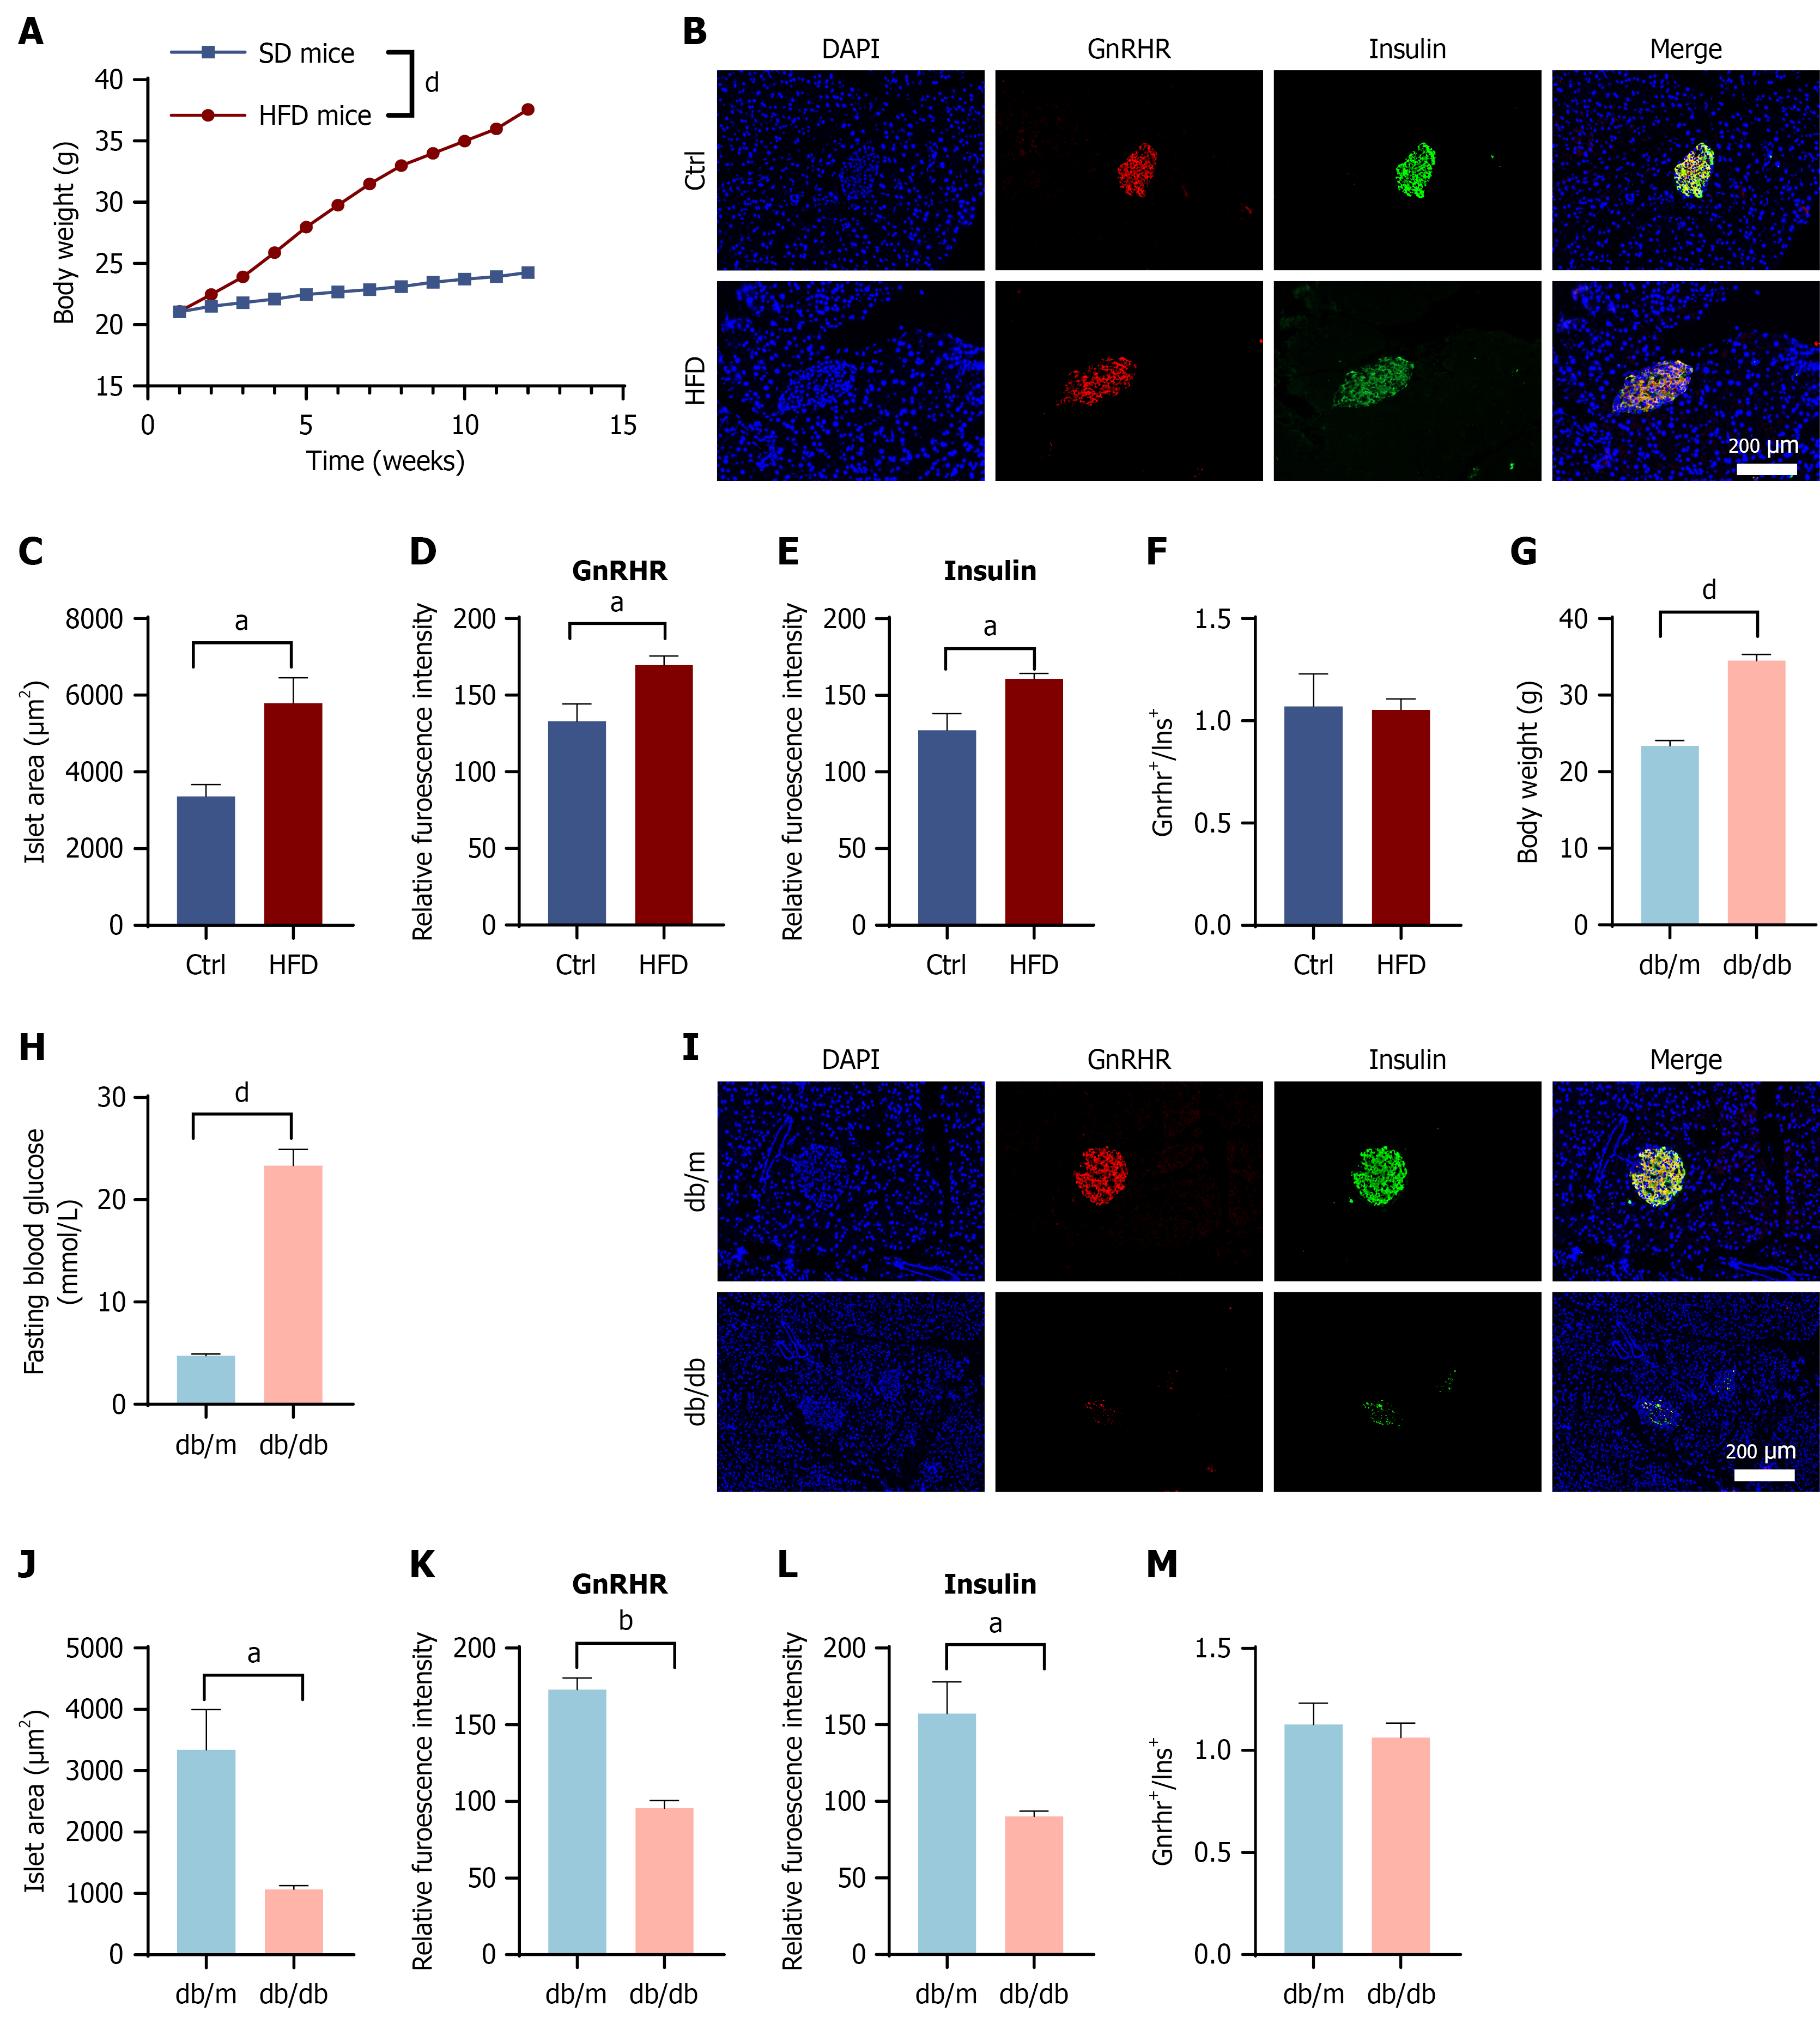
Figure 5 Synchronous downregulation of gonadotropin-releasing hormone receptor and insulin expression in pancreatic β-cells under chronic metabolic stress.
A-F: Alterations in gonadotropin-releasing hormone receptor (GnRHR) expression in high-fat diet-induced obese mice. Body weight trajectories of C57BL/6J mice fed a standard chow (control) or high-fat diet (A). Representative double immunofluorescence staining of pancreatic islets for GnRHR (red) and insulin (green). Nuclei were counterstained with DAPI (blue). Scale bar = 200 μm (B). Quantitative analysis of islet morphology and protein expression: Mean islet area (C); mean fluorescence intensity (MFI) of GnRHR (D); MFI of insulin (E); and the ratio of GnRHR to insulin fluorescence (F); G-M: Alterations in GnRHR expression in db/db diabetic mice. Metabolic characterization of db/m (control) and db/db mice: Body weight (G) and fasting blood glucose levels (H). Representative immunofluorescence images of islets stained for GnRHR (red) and insulin (green) (I). Quantitative analysis of diabetic islets: Mean islet area (J); MFI of GnRHR (K); MFI of insulin (L); and the ratio of GnRHR to insulin fluorescence (M). Data are presented as the mean ± SEM. Statistical significance was determined by Student’s t test. aP < 0.05, bP < 0.01, and dP < 0.0001. HFD: High-fat diet; GnRHR: Gonadotropin-releasing hormone receptor.
- Citation: Dai XJ, Gao SC, Chen PT, Yang L, Kong CC, Ye CY, Xu ZX, Hu YX, He CY, Zuo ZH, Wang W. Postmenopausal high-gonadotropin-releasing hormone environment mediates pancreatic β-cell compensation via the cAMP-PKA-PDX1 pathway. World J Diabetes 2026; 17(11): 121630
- URL: https://www.wjgnet.com/1948-9358/full/v17/i11/121630.htm
- DOI: https://dx.doi.org/10.4239/wjd.121630