
















Copyright: ©Author(s) 2026.
World J Gastrointest Oncol. Oct 15, 2026; 18(10): 120941
Published online Oct 15, 2026. doi: 10.4251/wjgo.120941
Published online Oct 15, 2026. doi: 10.4251/wjgo.120941
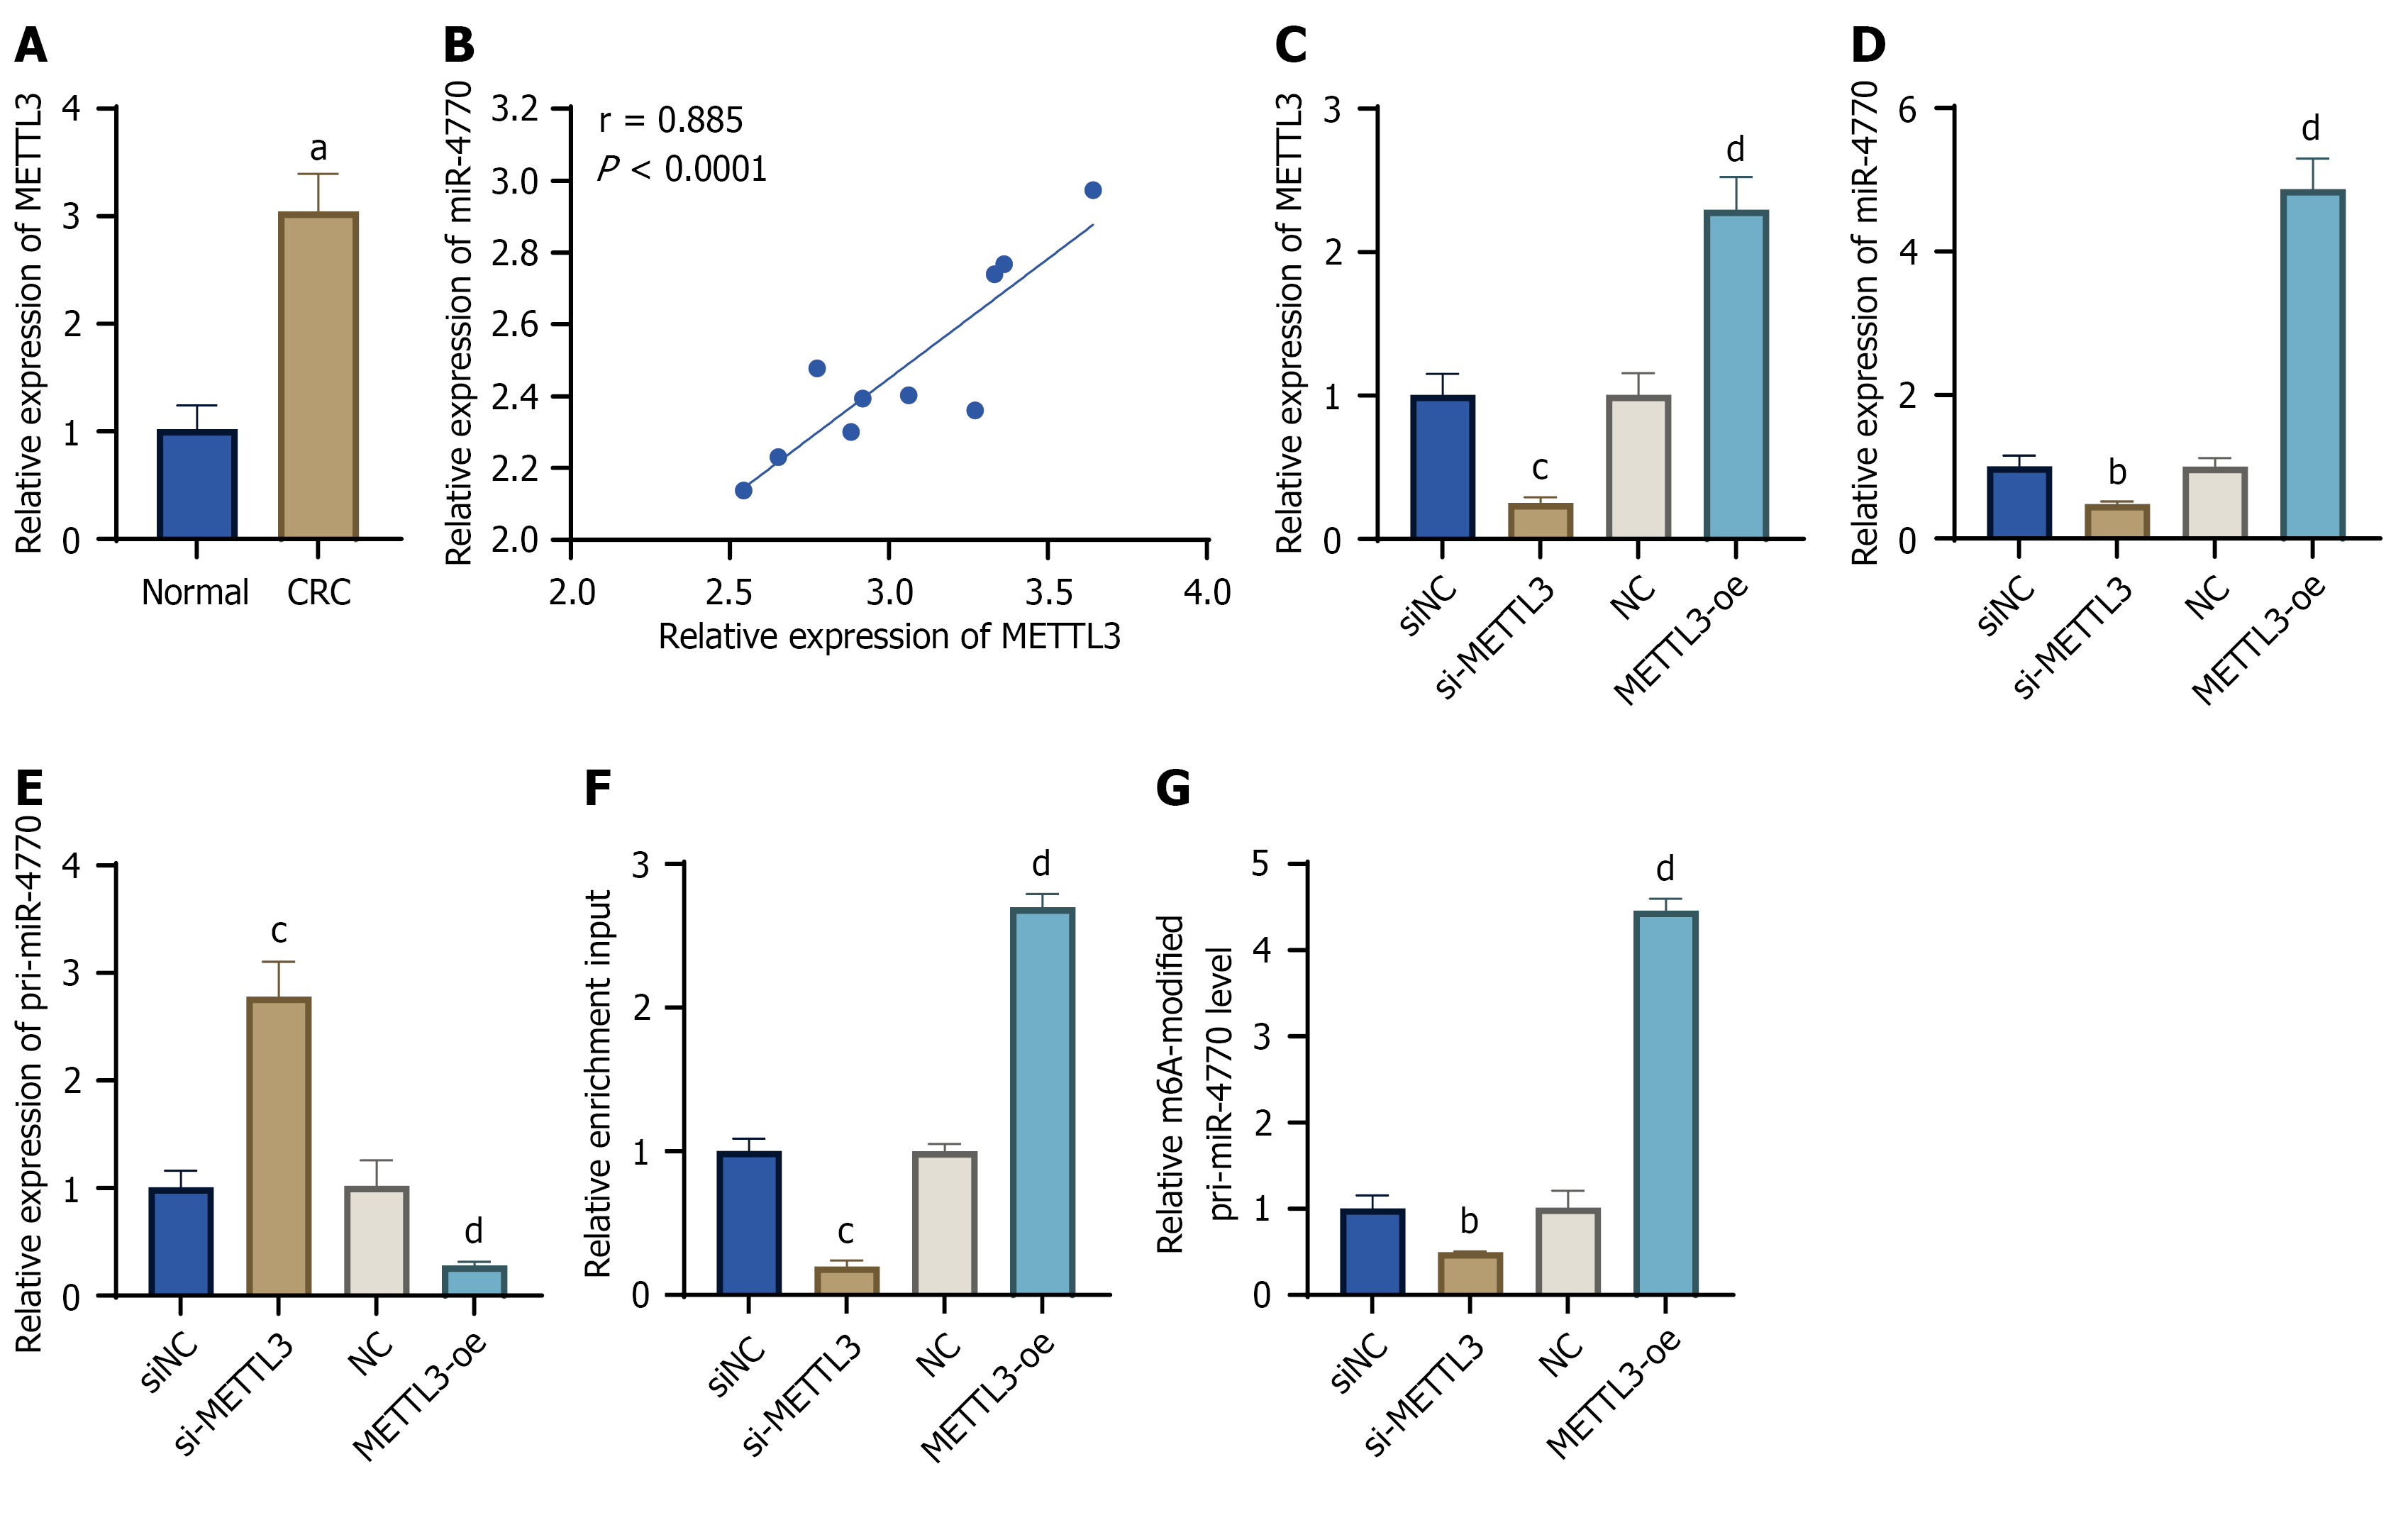
Figure 1 The regulation of METTL3 on miR-4770 expression and N6-methyladenosine modification level.
A: The expression of METTL3 in colorectal cancer (CRC) tissues and normal tissues was detected by qRT-PCR; B: The expression of miR-4770 was positively correlated with METTL3 in CRC tissues; C-E: The expression of METTL3 (C), miR-4770 (D) and pri-miR-4770 (E) was detected in siNC, si-METTL3, NC and METTL3-oe cells (qRT-PCR); F: RIP assay was used to detect the binding level of pri-miR-4770 and DGCR8 in the above four groups of cells; G: MeRIP assay was used to detect the N6-methyladenosine modification level of pri-miR-4770 in the above four groups of cells. Data were expressed as mean ± SD. aP < 0.01 vs normal group; bP < 0.05 and cP < 0.01 vs siNC group; dP < 0.01 vs NC group. Clinical tissue analyses were based on 10 paired CRC and adjacent normal tissues, whereas in vitro experiments were performed with three independent biological replicates. CRC: Colorectal cancer.
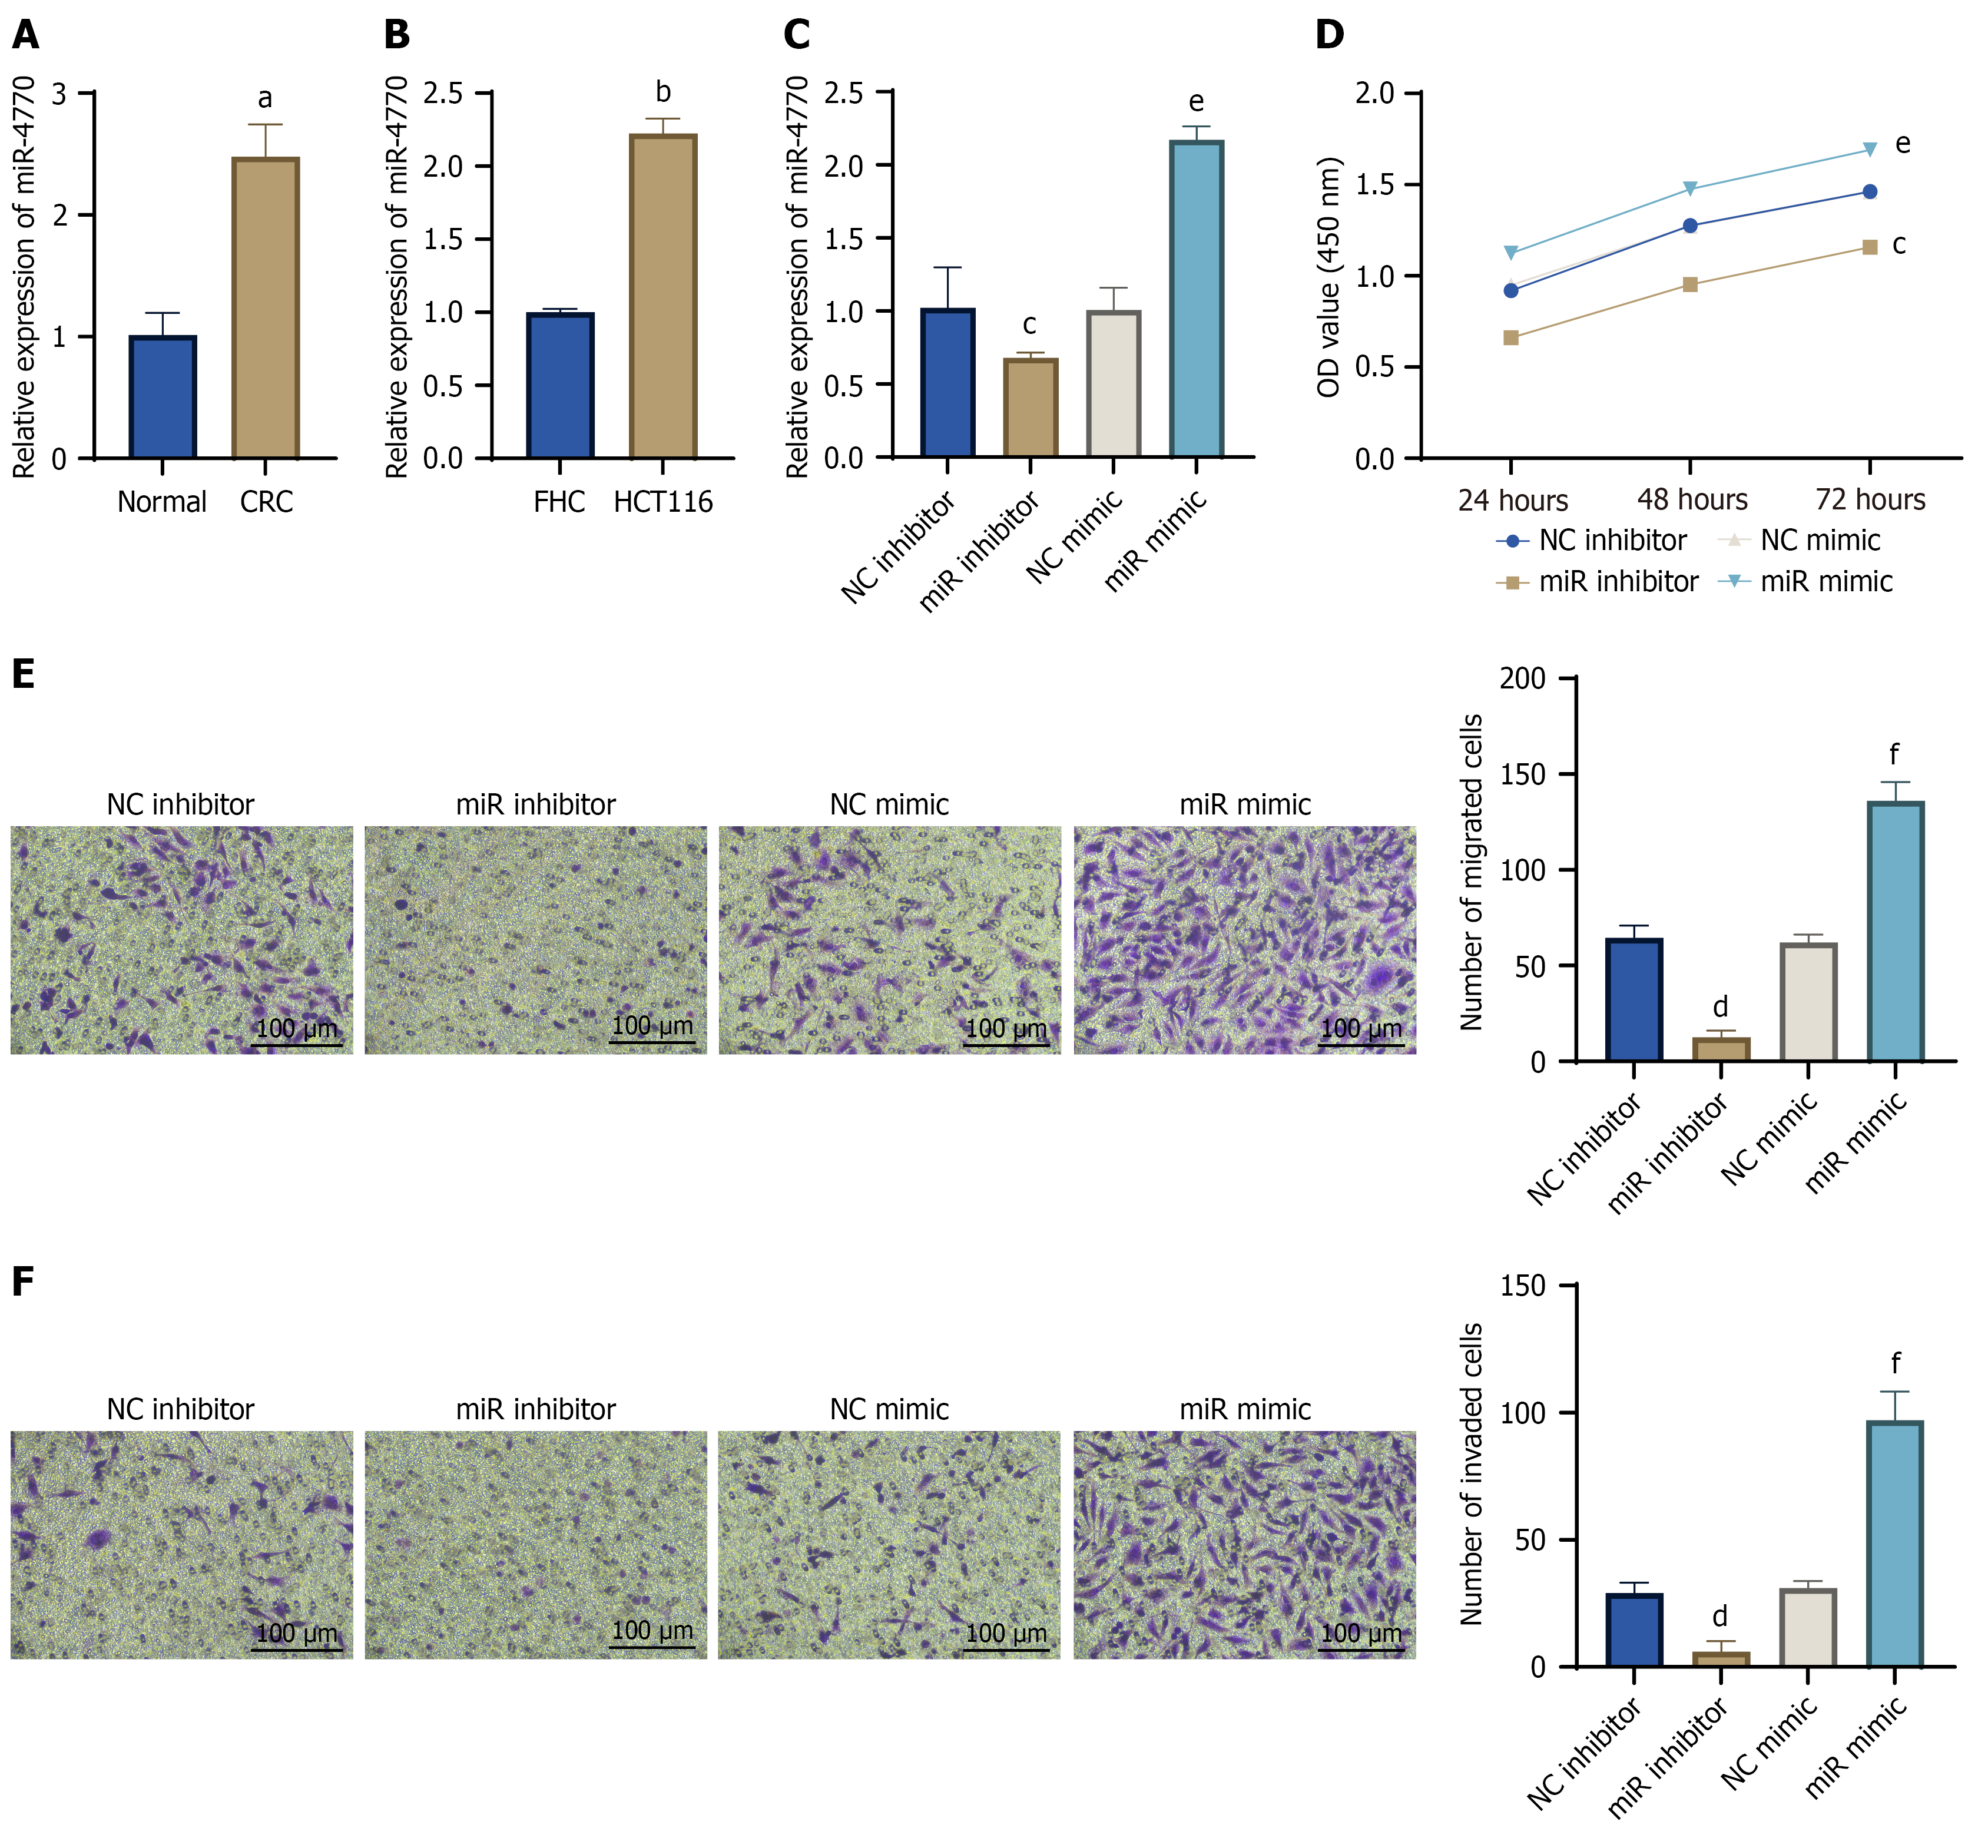
Figure 2 The expression of miR-4770 in colorectal cancer and its effect on cell viability, migration and invasion.
A: The expression of miR-4770 in colorectal cancer (CRC) tissues and adjacent normal tissues was detected by qRT-PCR; B: The expression of miR-4770 in FHC and HCT116 cells was detected by qRT-PCR; C: The expression of miR-4770 in the NC inhibitor, miR inhibitor, NC mimic, and miR mimic groups was detected by qRT-PCR; D: CCK-8 method was used to detect the proliferation activity of the above four groups of cells at 24 hours, 48 hours, and 72 hours; E and F: Transwell assay was used to evaluate the migration (E) and invasion (F) abilities of the above four groups of cells. Scale: 100 μm. The data were expressed as mean ± SD. aP < 0.01 vs normal group; bP < 0.01 vs FHC group; cP < 0.05 and dP < 0.01 vs NC inhibitor group; eP < 0.05 and fP < 0.001 vs NC mimic group. Clinical tissue analysis included 10 paired CRC and adjacent normal tissues, and in vitro experiments were performed with three independent biological replicates. CRC: Colorectal cancer.
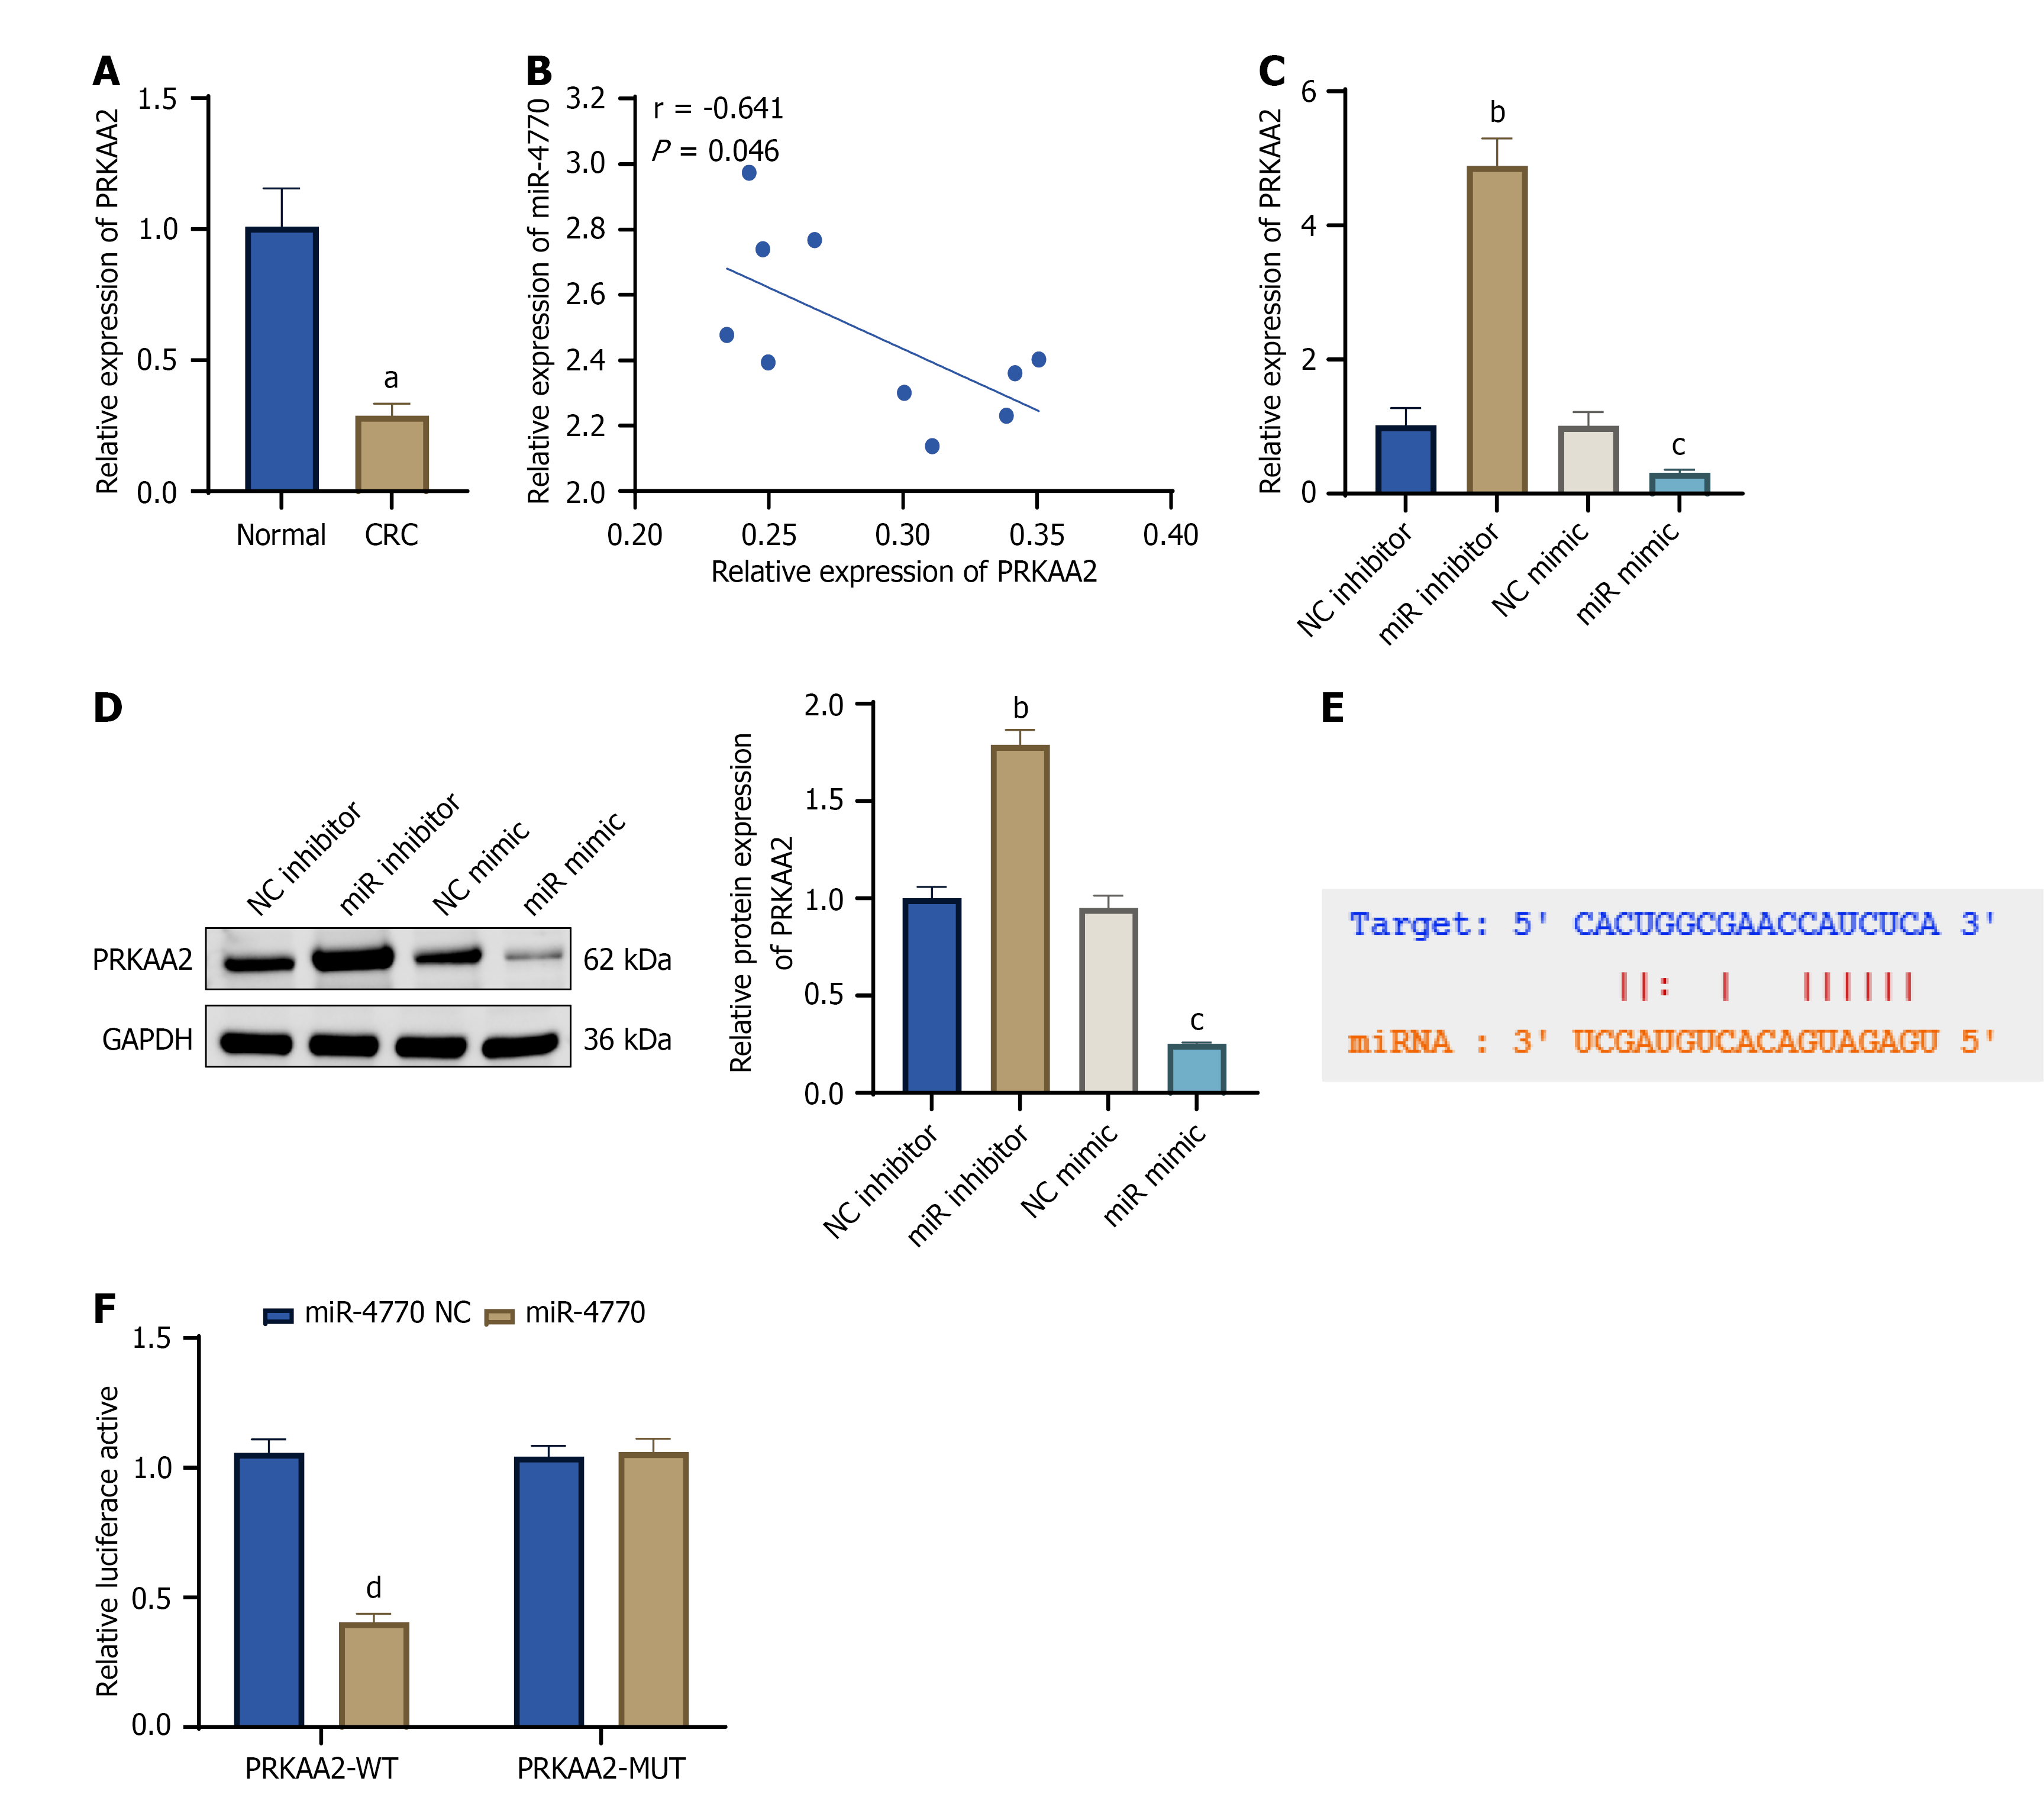
Figure 3 Verification of the targeting relationship between PRKAA2 and miR-4770.
A: The mRNA levels of PRKAA2 in colorectal cancer (CRC) tissues and normal tissues were determined by qRT-PCR; B: The expression of the two in CRC tissues was negatively correlated; C: The expression of PRKAA2 was detected by qRT-PCR in four groups of cells: NC inhibitor, miR inhibitor, NC mimic and miR mimic; D: Western blot was used to detect the level of PRKAA2 protein in the above four groups of cells; E: Predicting the target binding sequence of miR-4770 and PRKAA2; F: Dual luciferase reporter assay verified the direct targeting relationship between the two. Data were expressed as mean ± SD. aP < 0.01 vs normal group; bP < 0.01 vs NC inhibitor group; cP < 0.05 vs NC mimic group; dP < 0.01 vs miR-4770 NC group. Clinical tissue analyses included 10 paired CRC and adjacent normal tissues, and in vitro experiments were performed with three independent biological replicates. CRC: Colorectal cancer.
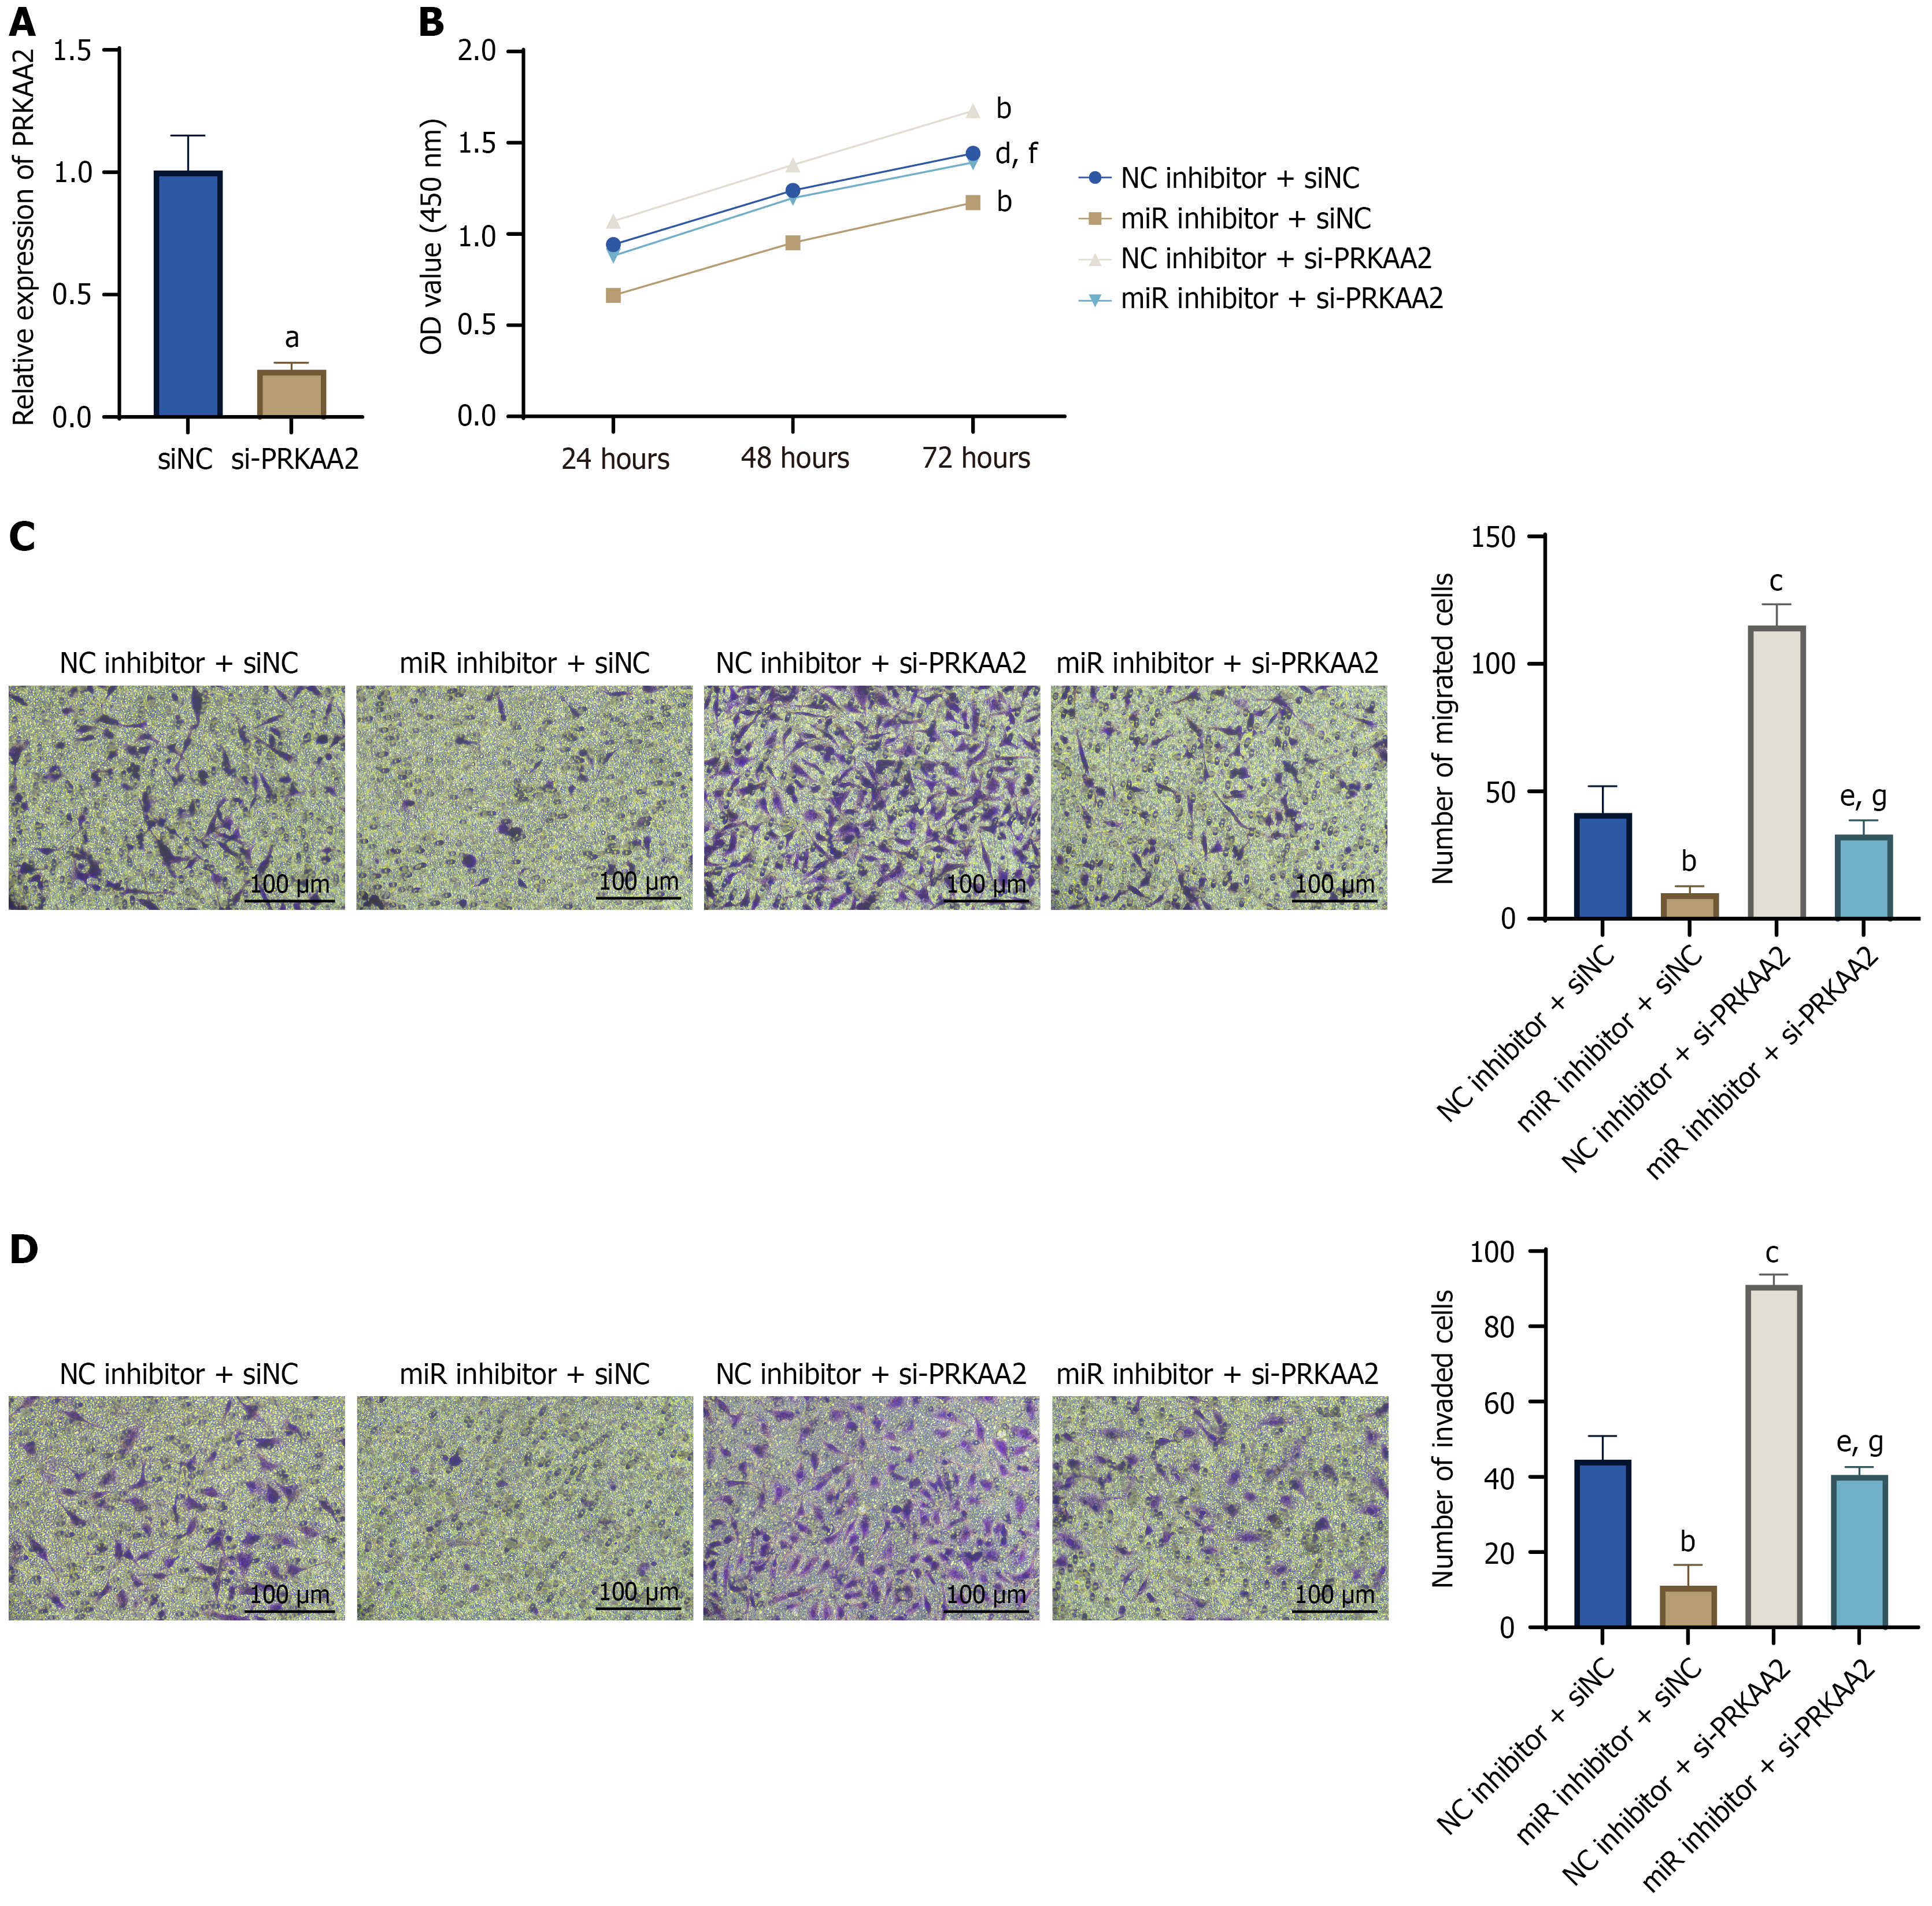
Figure 4 miR-4770 regulates the viability, migration and invasion of HCT116 cells through PRKAA2.
A: QRT-PCR was used to detect the mRNA expression of PRKAA2 in siNC group and si-PRKAA2 group; B: CCK-8 method was used to detect the proliferation activity of four groups of cells at 24 hours, 48 hours and 72 hours: NC inhibitor + siNC, miR inhibitor + siNC, NC inhibitor + si-PRKAA2, miR inhibitor + si-PRKAA2; C and D: Transwell assay was used to evaluate the migration (C) and invasion (D) abilities of the above four groups of cells. Scale: 100 μm. The data are expressed as mean ± SD and are derived from three independent biological replicates. aP < 0.01 vs siNC group; bP < 0.05 and cP < 0.01 vs NC inhibitor + siNC group; dP < 0.05 and eP < 0.01 vs miR inhibitor + siNC group; fP < 0.05 and gP < 0.01 vs NC inhibitor + si-PRKAA2 group.
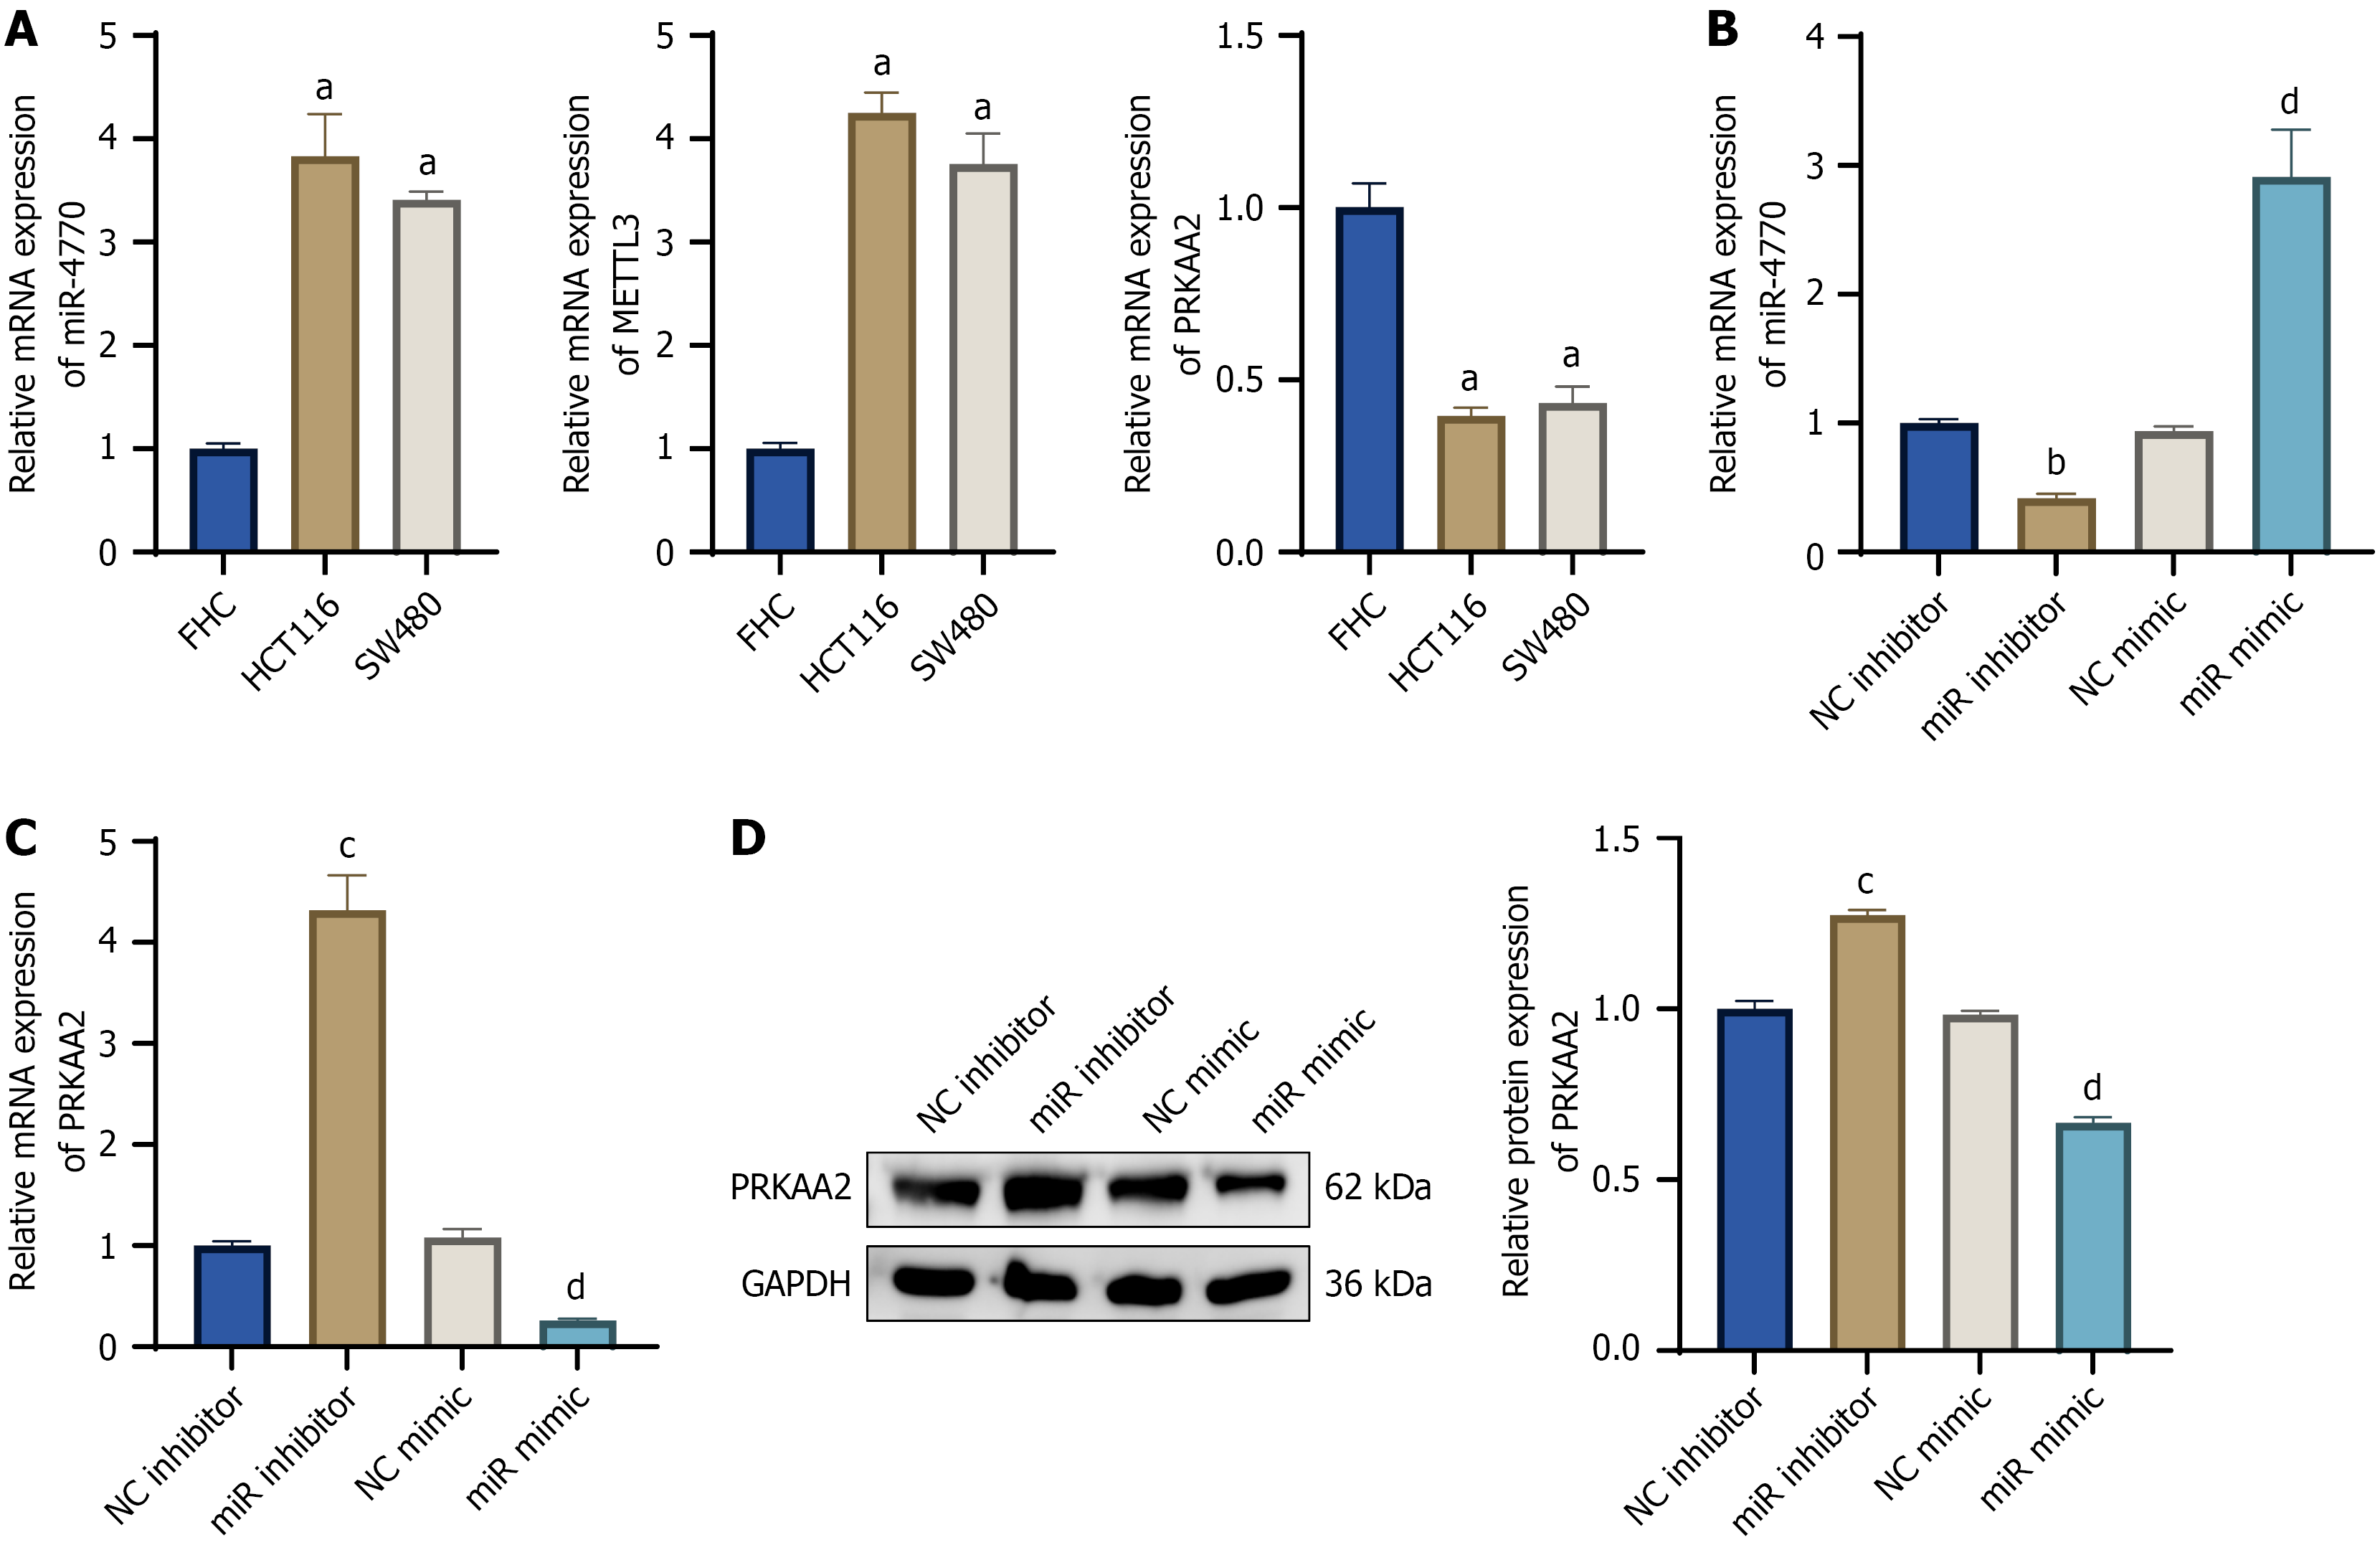
Figure 5 Expression of miR-4770 in colorectal cancer cells and its regulation of PRKAA2.
A: The mRNA levels of miR-4770, METTL3 and PRKAA2 in FHC, HCT116 and SW480 cells were detected by qRT-PCR; B and C: In SW480 cells, qRT-PCR was used to detect the expression of miR-4770 (B) and PRKAA2 (C) in each group, which were divided into NC inhibitor, miR inhibitor, NC mimic and miR mimic; D: Western blot was used to detect the level of PRKAA2 protein in the above four groups of SW480 cells. Data are expressed as mean ± SD and are derived from three independent biological replicates. Statistical difference: aP < 0.01 vs FHC group; bP < 0.05 and cP < 0.01 vs NC inhibitor group; dP < 0.01 vs NC mimic group.
- Citation: Yi BS, Lai HB. miR-4770 promotes colorectal cancer progression by targeting PRKAA2 via m6A modification. World J Gastrointest Oncol 2026; 18(10): 120941
- URL: https://www.wjgnet.com/1948-5204/full/v18/i10/120941.htm
- DOI: https://dx.doi.org/10.4251/wjgo.120941