Copyright
©The Author(s) 2025.
World J Stem Cells. May 26, 2025; 17(5): 105266
Published online May 26, 2025. doi: 10.4252/wjsc.v17.i5.105266
Published online May 26, 2025. doi: 10.4252/wjsc.v17.i5.105266
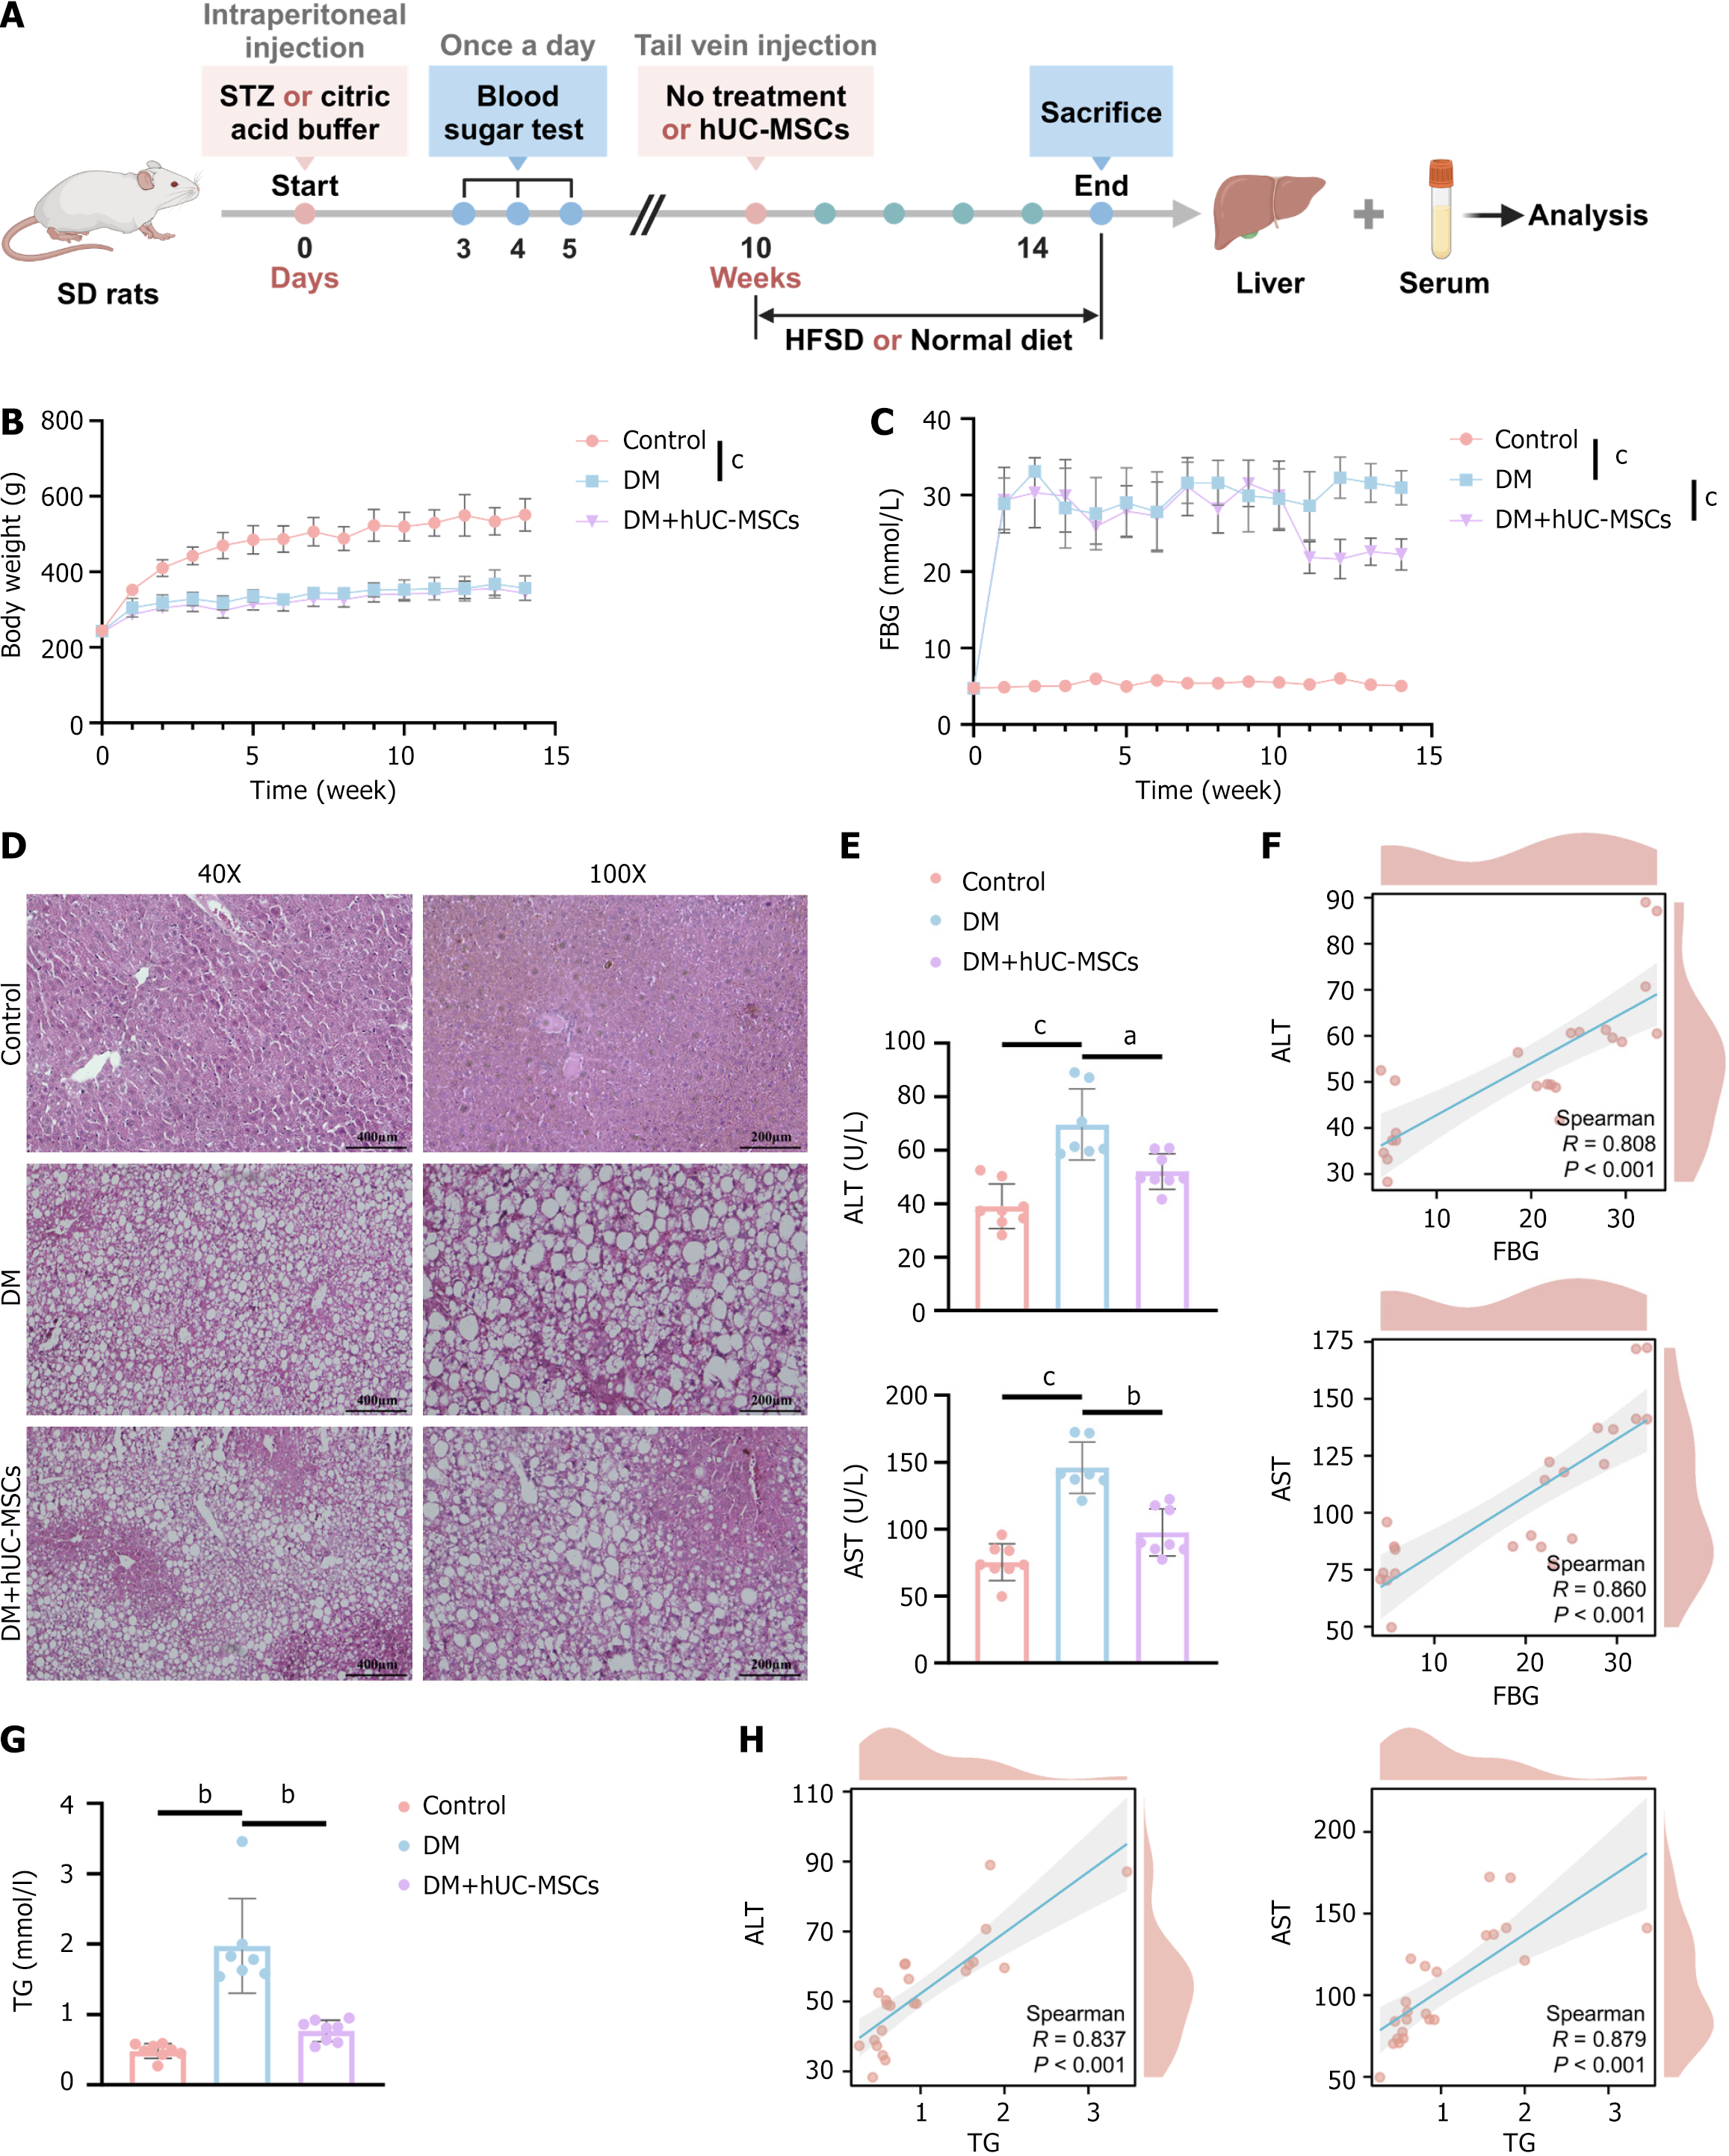
Figure 1 The effects of human umbilical cord mesenchymal stem cells on body weight, blood glucose, and the liver in diabetes mellitus model rats.
A: Schematic diagram of human umbilical cord mesenchymal stem cell treatment in diabetes mellitus rats; B: Changes in body weight over time in each group of rats; C: Changes in fasting blood glucose levels over time in each group of rats; D: Representative images of hematoxylin and eosin-stained liver tissue from each group of rats; scale bars = 400 μm (left) and 200 μm (right); E: Serum levels of alanine aminotransferase and aspartate aminotransferase in each group of rats; F: Spearman correlation analysis between fasting blood glucose levels and liver injury-related indicators; G: Serum triglyceride levels in each group of rats; H: Spearman correlation analysis between triglyceride levels and liver injury-related indicators. aP < 0.01, bP < 0.001, cP < 0.0001. Control group, n = 8; diabetes mellitus group, n = 7; diabetes mellitus + human umbilical cord mesenchymal stem cells group, n = 8. STZ: Streptozotocin; hUC-MSCs: Human umbilical cord mesenchymal stem cells; HFSD: High-fat, high-sugar diet; DM: Diabetes mellitus; FBG: Fasting blood glucose; ALT: Alanine aminotransferase; AST: Aspartate aminotransferase; TG: Triglyceride.
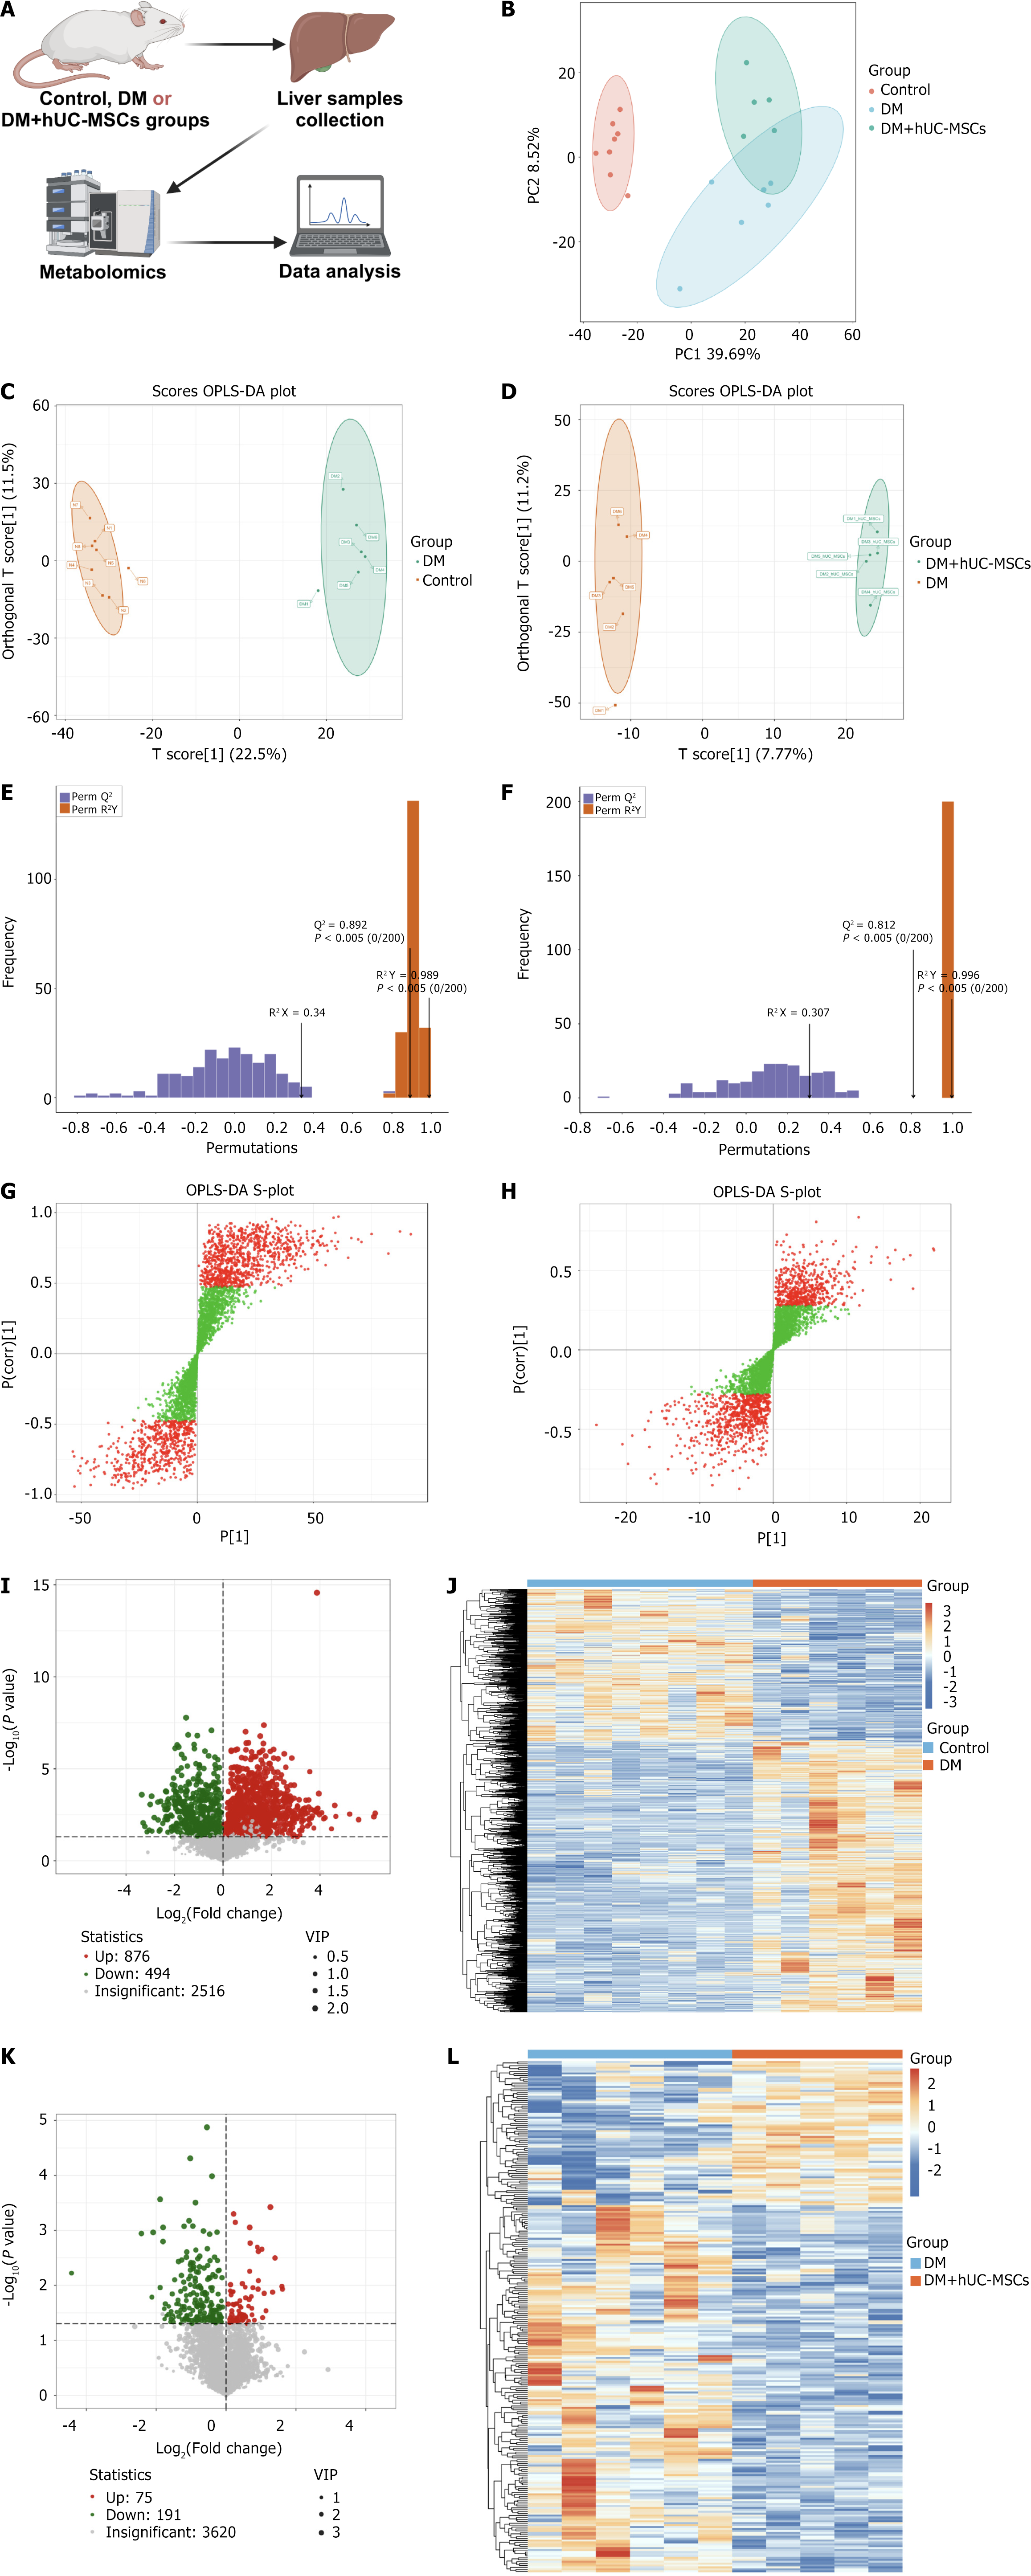
Figure 2 Differential metabolite analysis of liver samples among the different groups of rats.
A: Schematic diagram of the liver metabolomics analysis; B: Two-dimensional principal coordinate analysis plots of the metabolomic profiles of rats in each group; C and D: Orthogonal partial least squares discriminant analysis (OPLS-DA) score plots for the comparison between the control and diabetes mellitus (DM) groups (C) and between the DM and DM + human umbilical cord mesenchymal stem cells (hUC-MSCs) groups (D); E and F: OPLS-DA model validation plots for the control group vs DM group comparison (E) and the DM group vs DM + hUC-MSCs group comparison (F); G and H: OPLS-DA S-plots for the control group vs DM group comparison (G) and the DM group vs DM + hUC-MSCs group comparison (H); red dots represent metabolites with VIP values > 1, and green dots represent metabolites with VIP values ≤ 1; I: Volcano plot of the differential metabolites between the DM group and the control group; J: Clustering heatmap of the differential metabolites between the DM group and the control group; K: Volcano plot of the differential metabolites between the DM and the DM + hUC-MSCs groups; L: Clustering heatmap of the differential metabolites between the DM and the DM + hUC-MSCs groups. Control group, n = 8; diabetes mellitus group, n = 6; diabetes mellitus + human umbilical cord mesenchymal stem cells group, n = 5. hUC-MSCs: Human umbilical cord mesenchymal stem cells; DM: Diabetes mellitus; OPLS-DA: Orthogonal partial least squares discriminant analysis.
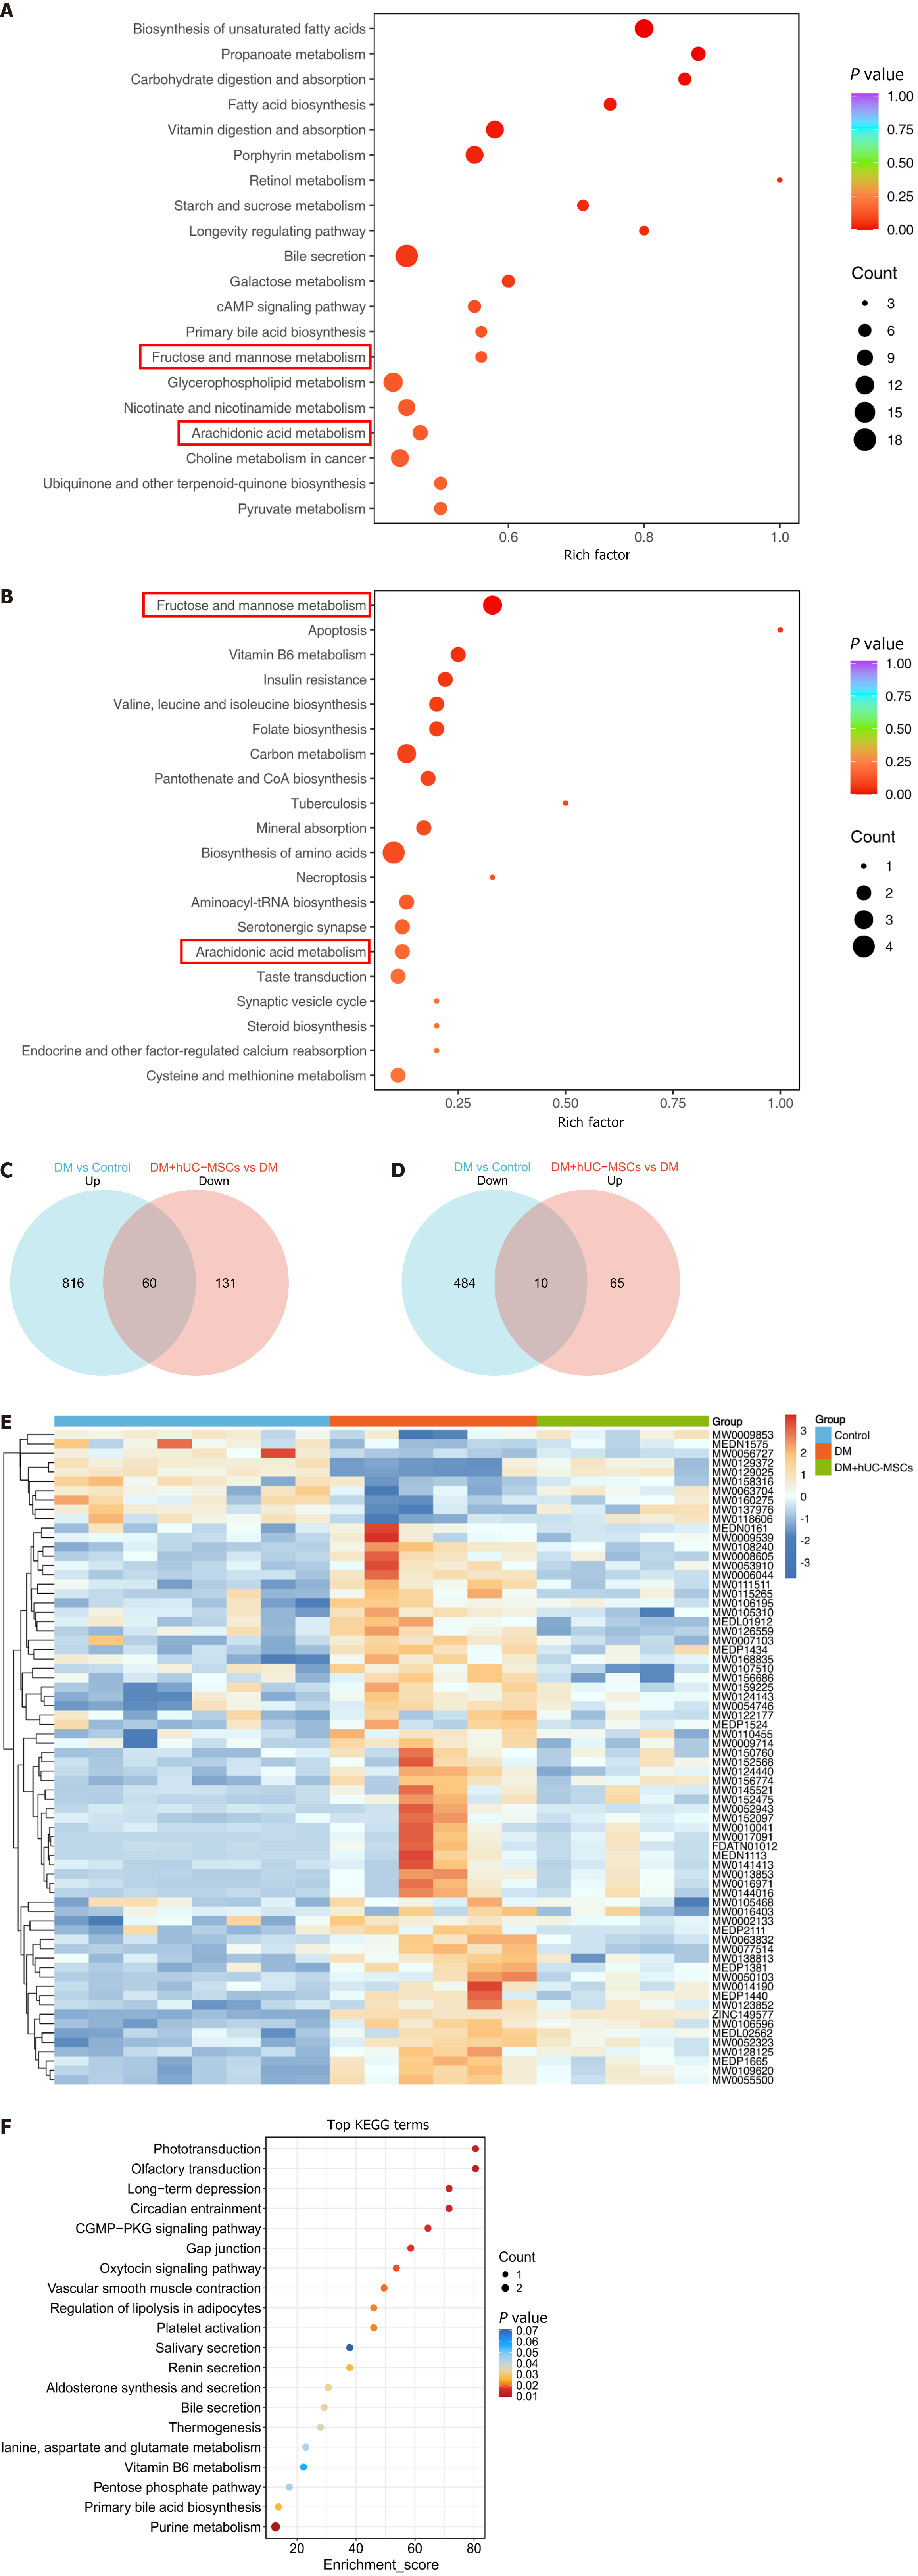
Figure 3 The effects of human umbilical cord mesenchymal stem cells on liver metabolic pathways and metabolites in rats with concurrent diabetes mellitus and metabolic-associated fatty liver disease.
A and B: Kyoto Encyclopedia of Genes and Genomes pathway enrichment bubble plot for the differential metabolites between the diabetes mellitus (DM) group and the control group (A) and between the DM group and the DM + human umbilical cord mesenchymal stem cells group (B); C and D: Venn diagram showing the upregulated and downregulated differential metabolites in the different comparison groups; E: Heatmap of the intersecting differential metabolites; F: Kyoto Encyclopedia of Genes and Genomes pathway enrichment analysis bubble plot for the intersecting differential metabolites. Control group, n = 8; diabetes mellitus group, n = 6; diabetes mellitus + human umbilical cord mesenchymal stem cells group, n = 5. hUC-MSCs: Human umbilical cord mesenchymal stem cells; DM: Diabetes mellitus; KEGG: Kyoto Encyclopedia of Genes and Genomes.
Figure 4 Receiver operating characteristic curves of 70 key differential metabolites between the diabetes mellitus group and the control group.
Control group, n = 8; diabetes mellitus group, n = 6. ROC: Receiver operating characteristic; AUC: Area under the curve.
Figure 5 Receiver operating characteristic curves for 70 key differential metabolites between the diabetes mellitus and the diabetes mellitus + human umbilical cord mesenchymal stem cells group.
Diabetes mellitus group, n = 6; diabetes mellitus + human umbilical cord mesenchymal stem cells group, n = 5. ROC: Receiver operating characteristic; AUC: Area under the curve.
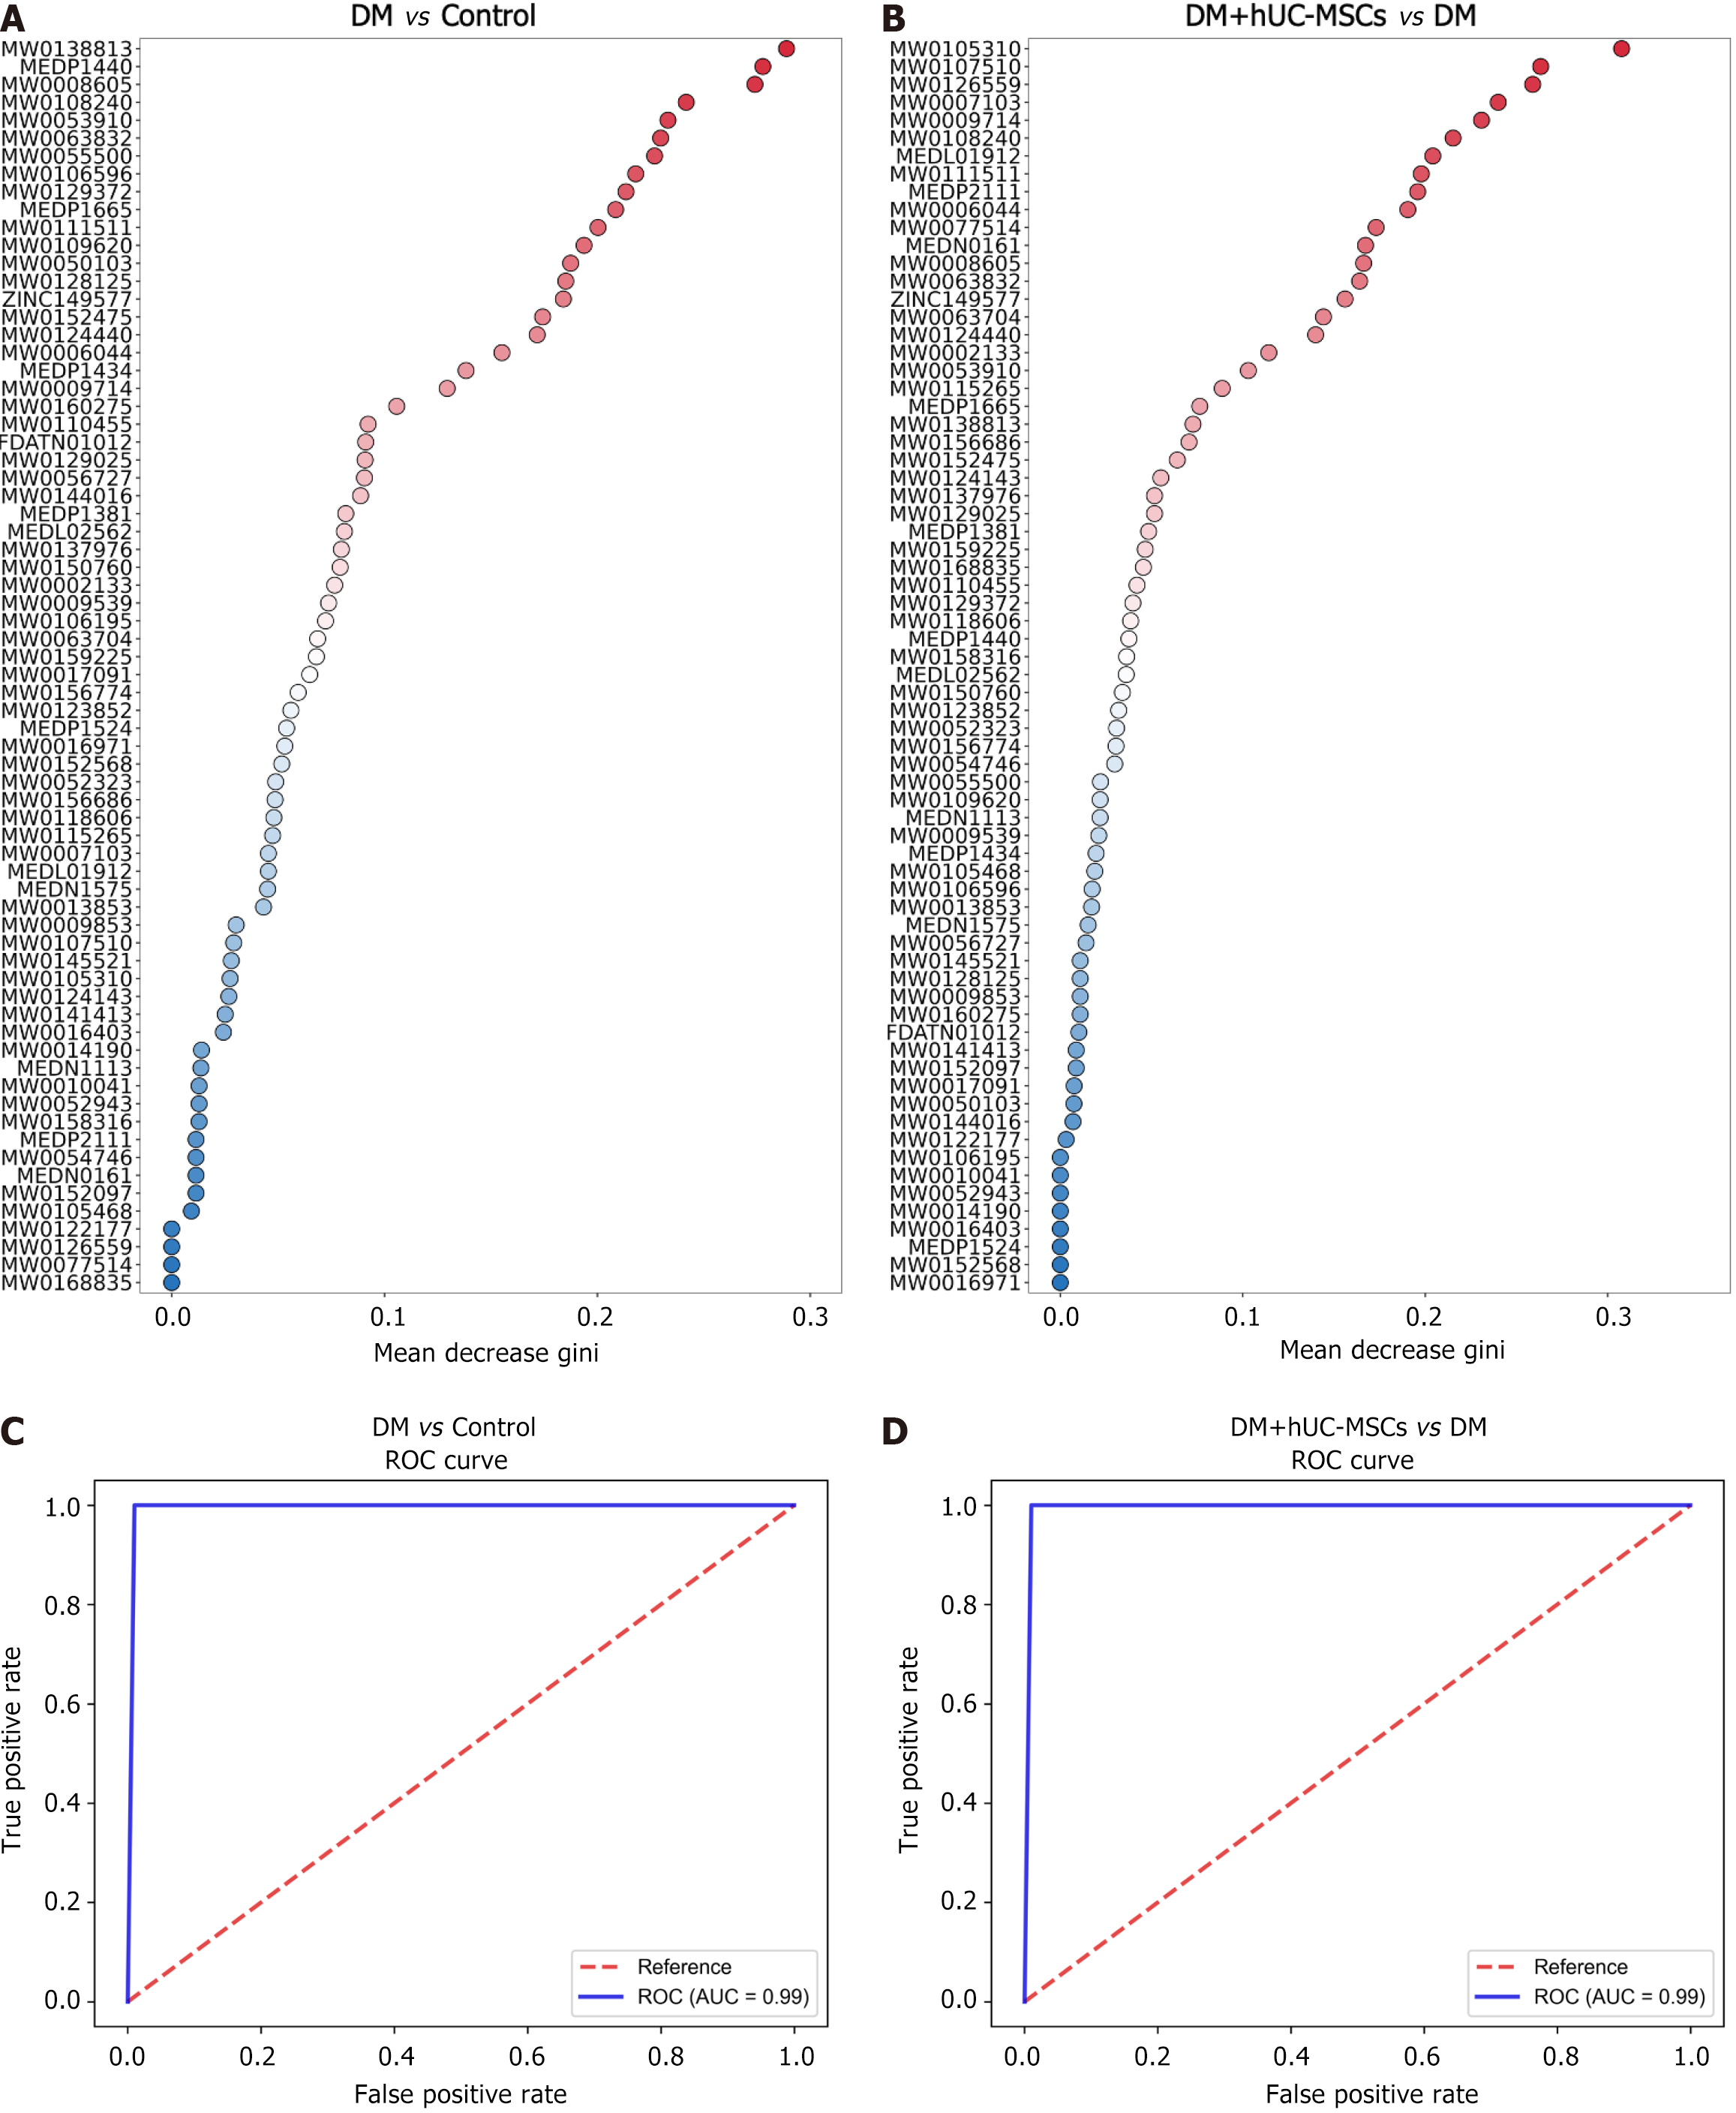
Figure 6 Importance ranking and receiver operating characteristic curves for key differential metabolites for each group based on the random forest model.
A and B: Random forest importance ranking dot plots for key differential metabolites between the different comparison groups. The X axis represents the importance indicator values; C and D: Composite receiver operating characteristic curves generated for key differential metabolites between the different comparison groups based on the random forest model. Control group, n = 8; diabetes mellitus group, n = 6; diabetes mellitus + human umbilical cord mesenchymal stem cells group, n = 5. hUC-MSCs: Human umbilical cord mesenchymal stem cells; DM: Diabetes mellitus; ROC: Receiver operating characteristic; AUC: Area under the curve.
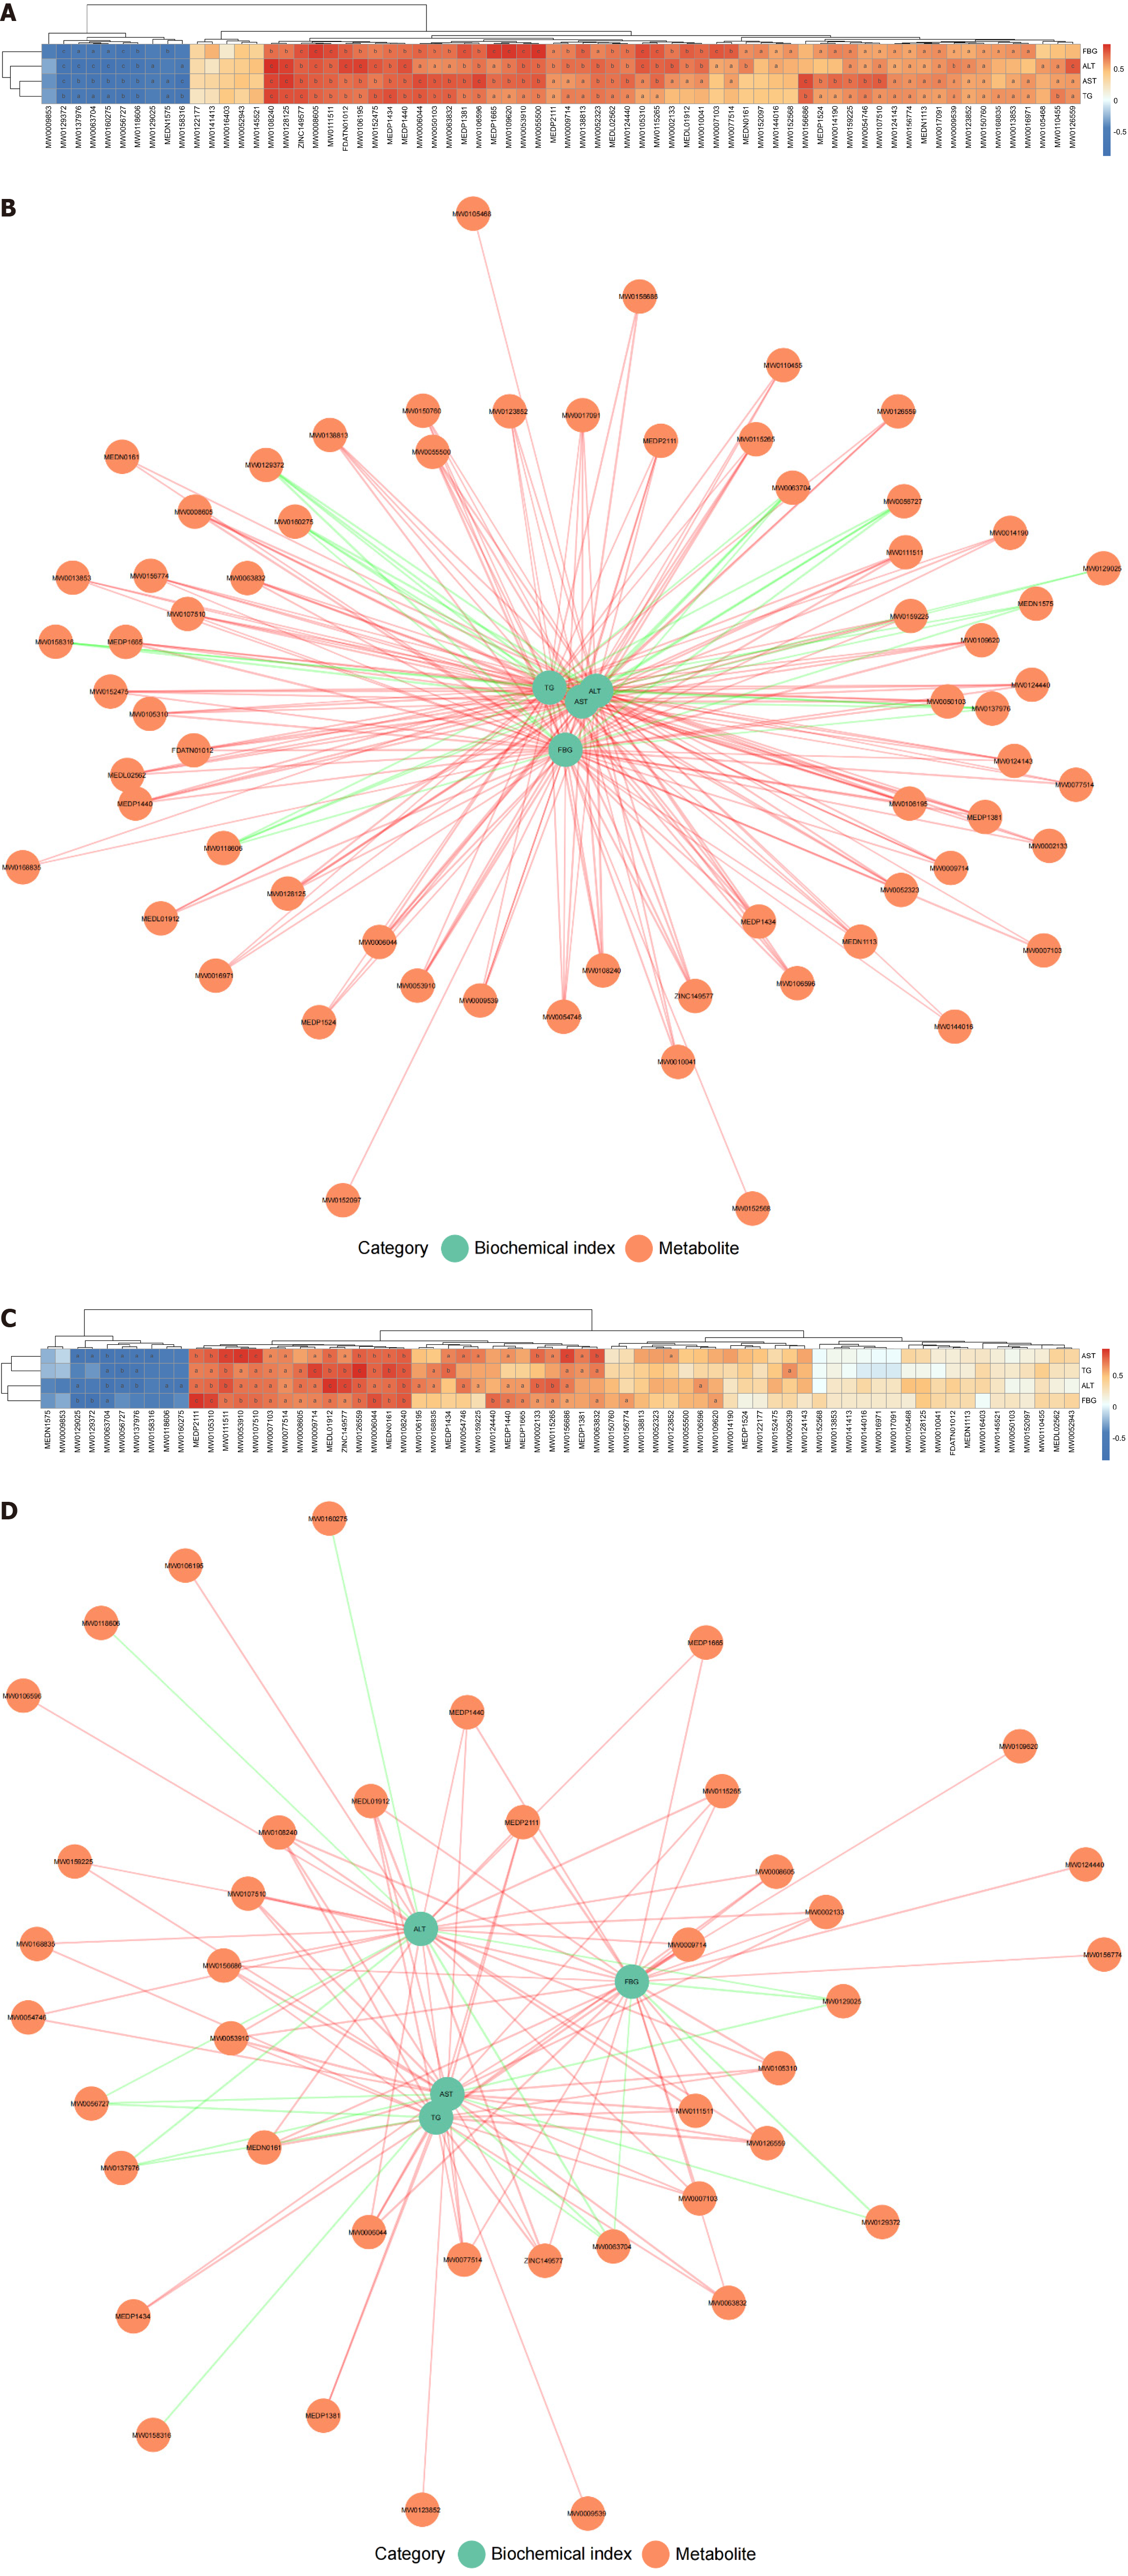
Figure 7 Correlation analysis between biochemical indexes and key differential metabolites in rats of each group.
A: Spearman correlation heatmap of biochemical indexes and key differential metabolites in the diabetes mellitus (DM) group vs control group comparison. Orange represents positive correlations and blue represents negative correlations; the depth of the color indicates the strength of the correlation; B: Spearman correlation network between biochemical indexes and key differential metabolites in the DM group vs control group comparison. Red lines represent positive correlations and green lines represent negative correlations; the thickness of the lines indicates the strength of the correlation; C: Spearman correlation heatmap of biochemical indexes and key differential metabolites in the DM group vs DM + human umbilical cord mesenchymal stem cells group comparison; D: Spearman correlation network between biochemical indexes and key differential metabolites in the DM group vs DM + human umbilical cord mesenchymal stem cells group comparison. aP < 0.05, bP < 0.01, cP < 0.001. Control group, n = 8; diabetes mellitus group, n = 6; diabetes mellitus + human umbilical cord mesenchymal stem cells group, n = 5. FBG: Fasting blood glucose; ALT: Alanine aminotransferase; AST: Aspartate aminotransferase; TG: Triglyceride.
- Citation: Zhou KB, Nie L, Wang ML, Xiao DH, Zhang HY, Yang X, Liao DF, Yang XF. Human umbilical cord mesenchymal stem cells ameliorate liver metabolism in diabetic rats with metabolic-associated fatty liver disease. World J Stem Cells 2025; 17(5): 105266
- URL: https://www.wjgnet.com/1948-0210/full/v17/i5/105266.htm
- DOI: https://dx.doi.org/10.4252/wjsc.v17.i5.105266


