Copyright
©The Author(s) 2025.
World J Stem Cells. May 26, 2025; 17(5): 105266
Published online May 26, 2025. doi: 10.4252/wjsc.v17.i5.105266
Published online May 26, 2025. doi: 10.4252/wjsc.v17.i5.105266
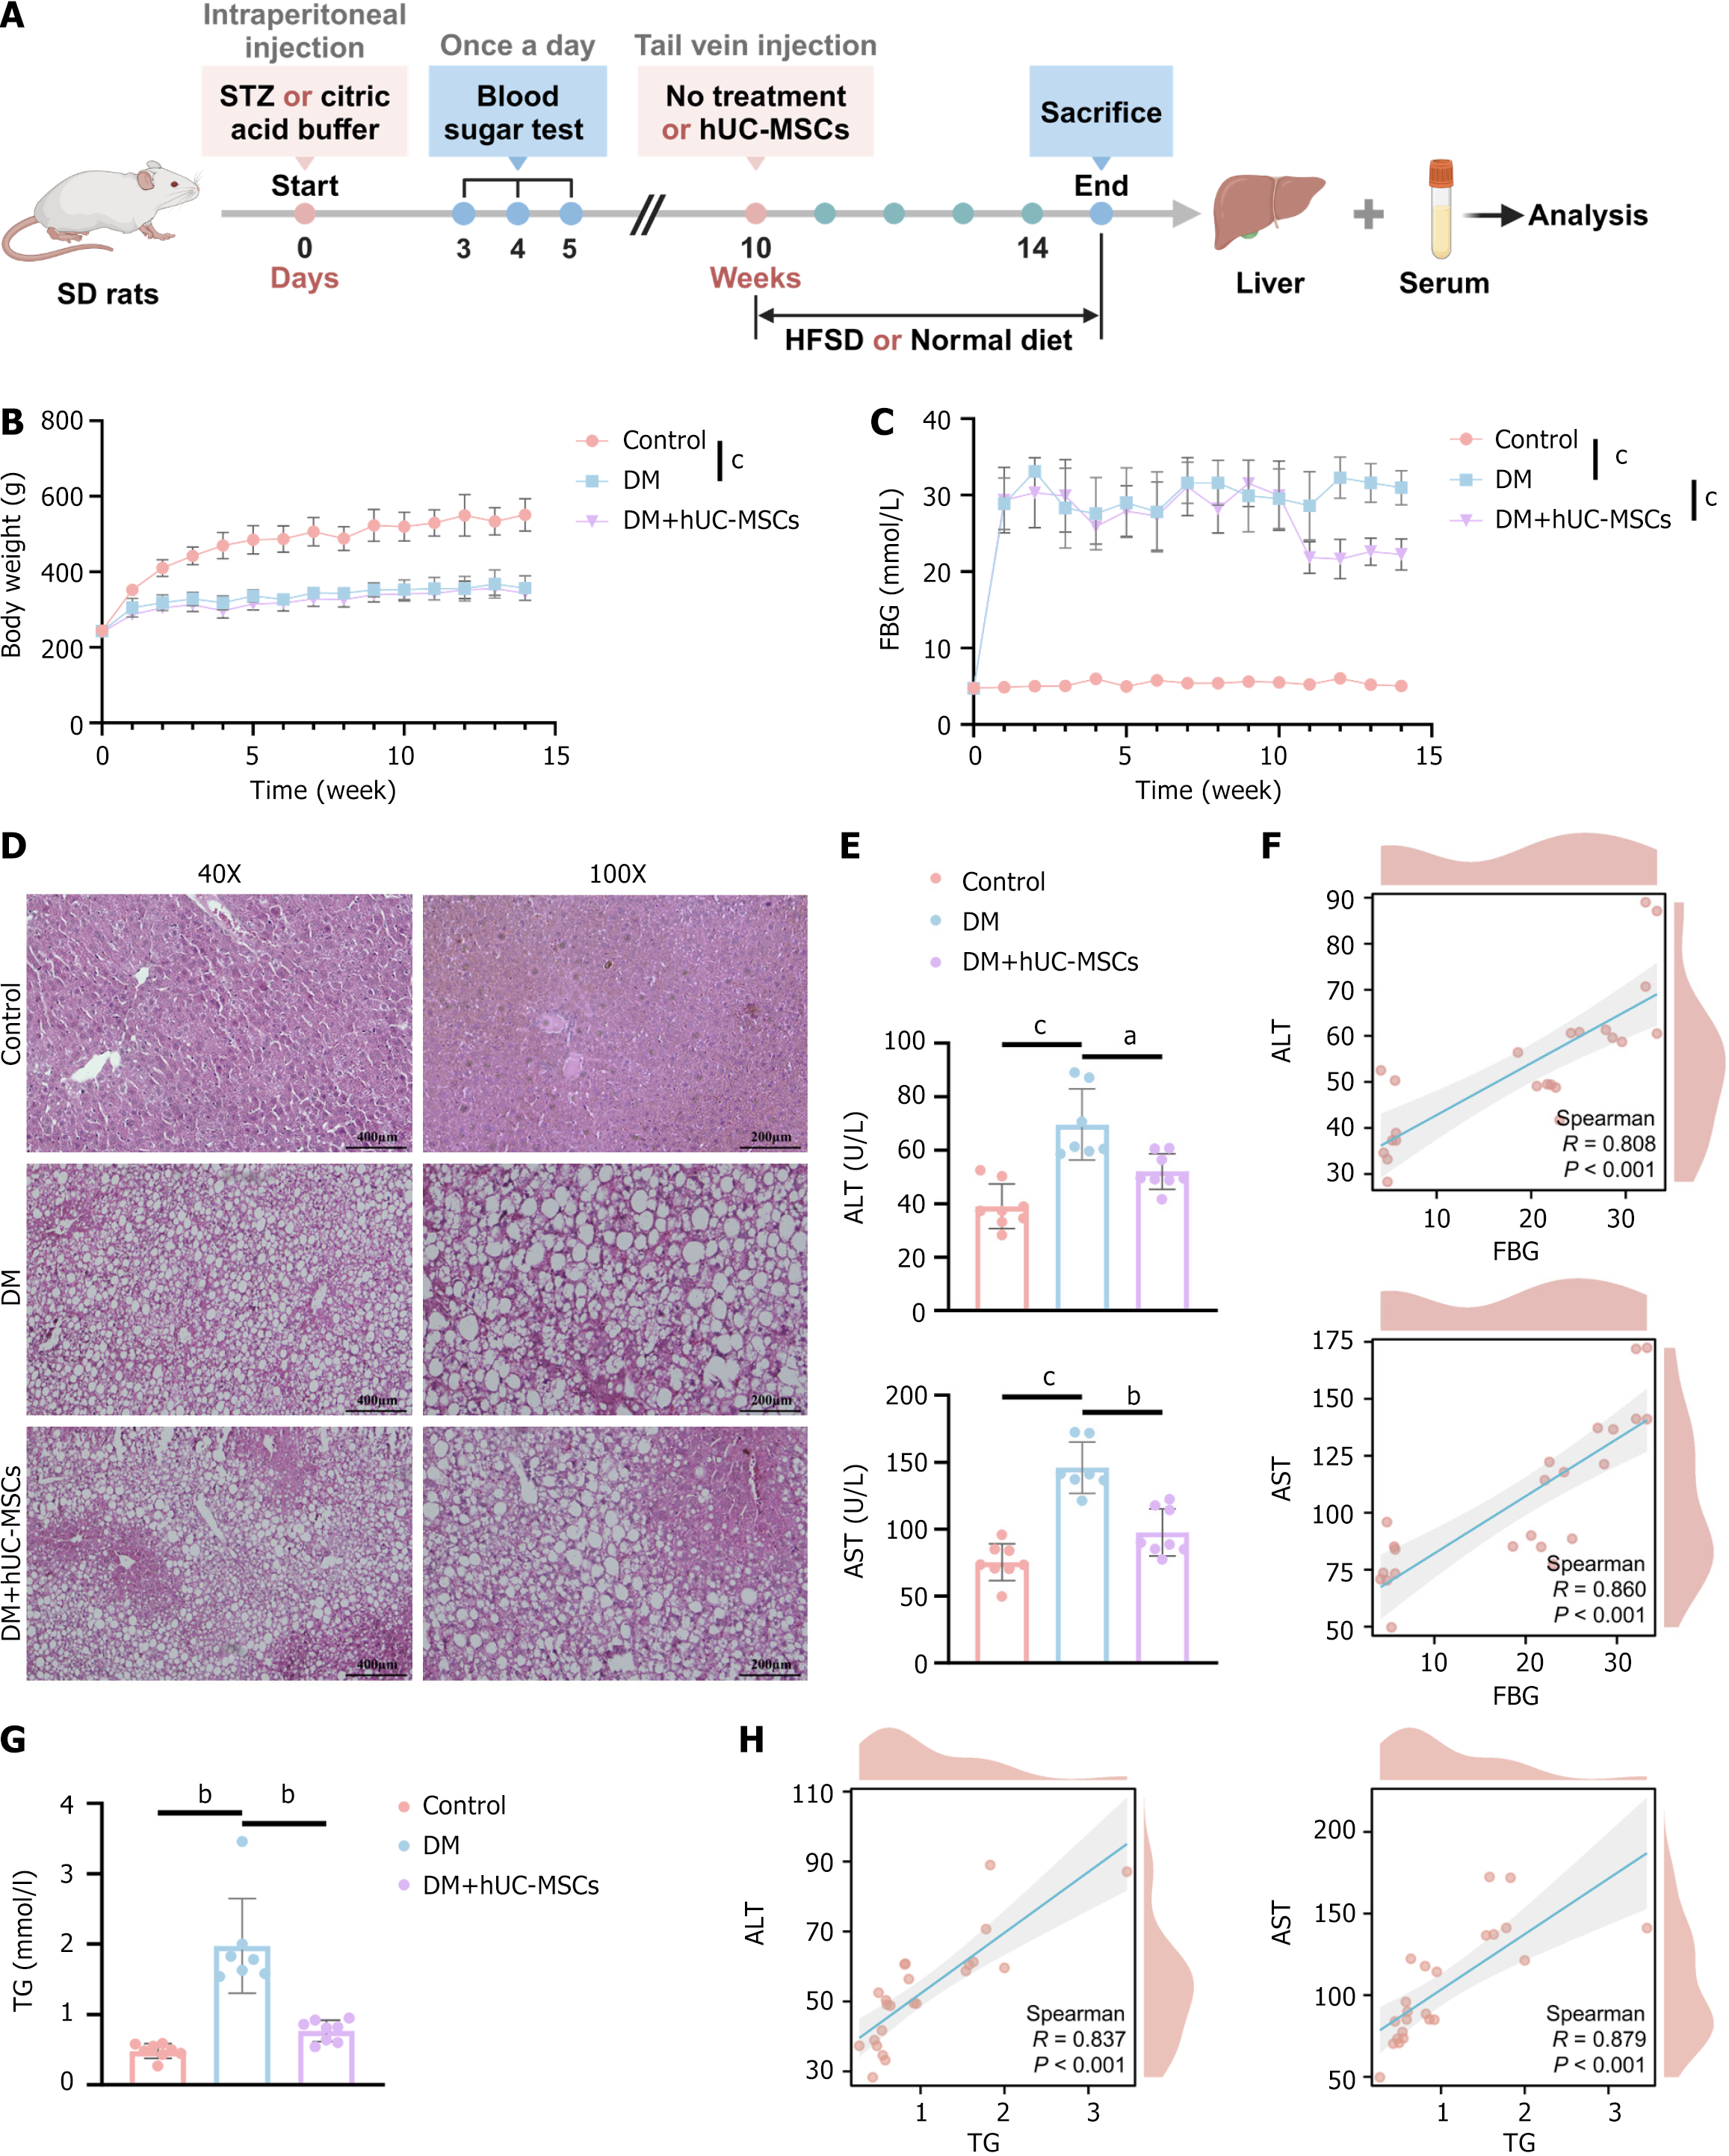
Figure 1 The effects of human umbilical cord mesenchymal stem cells on body weight, blood glucose, and the liver in diabetes mellitus model rats.
A: Schematic diagram of human umbilical cord mesenchymal stem cell treatment in diabetes mellitus rats; B: Changes in body weight over time in each group of rats; C: Changes in fasting blood glucose levels over time in each group of rats; D: Representative images of hematoxylin and eosin-stained liver tissue from each group of rats; scale bars = 400 μm (left) and 200 μm (right); E: Serum levels of alanine aminotransferase and aspartate aminotransferase in each group of rats; F: Spearman correlation analysis between fasting blood glucose levels and liver injury-related indicators; G: Serum triglyceride levels in each group of rats; H: Spearman correlation analysis between triglyceride levels and liver injury-related indicators. aP < 0.01, bP < 0.001, cP < 0.0001. Control group, n = 8; diabetes mellitus group, n = 7; diabetes mellitus + human umbilical cord mesenchymal stem cells group, n = 8. STZ: Streptozotocin; hUC-MSCs: Human umbilical cord mesenchymal stem cells; HFSD: High-fat, high-sugar diet; DM: Diabetes mellitus; FBG: Fasting blood glucose; ALT: Alanine aminotransferase; AST: Aspartate aminotransferase; TG: Triglyceride.
- Citation: Zhou KB, Nie L, Wang ML, Xiao DH, Zhang HY, Yang X, Liao DF, Yang XF. Human umbilical cord mesenchymal stem cells ameliorate liver metabolism in diabetic rats with metabolic-associated fatty liver disease. World J Stem Cells 2025; 17(5): 105266
- URL: https://www.wjgnet.com/1948-0210/full/v17/i5/105266.htm
- DOI: https://dx.doi.org/10.4252/wjsc.v17.i5.105266


