Copyright
©The Author(s) 2025.
World J Stem Cells. May 26, 2025; 17(5): 105266
Published online May 26, 2025. doi: 10.4252/wjsc.v17.i5.105266
Published online May 26, 2025. doi: 10.4252/wjsc.v17.i5.105266
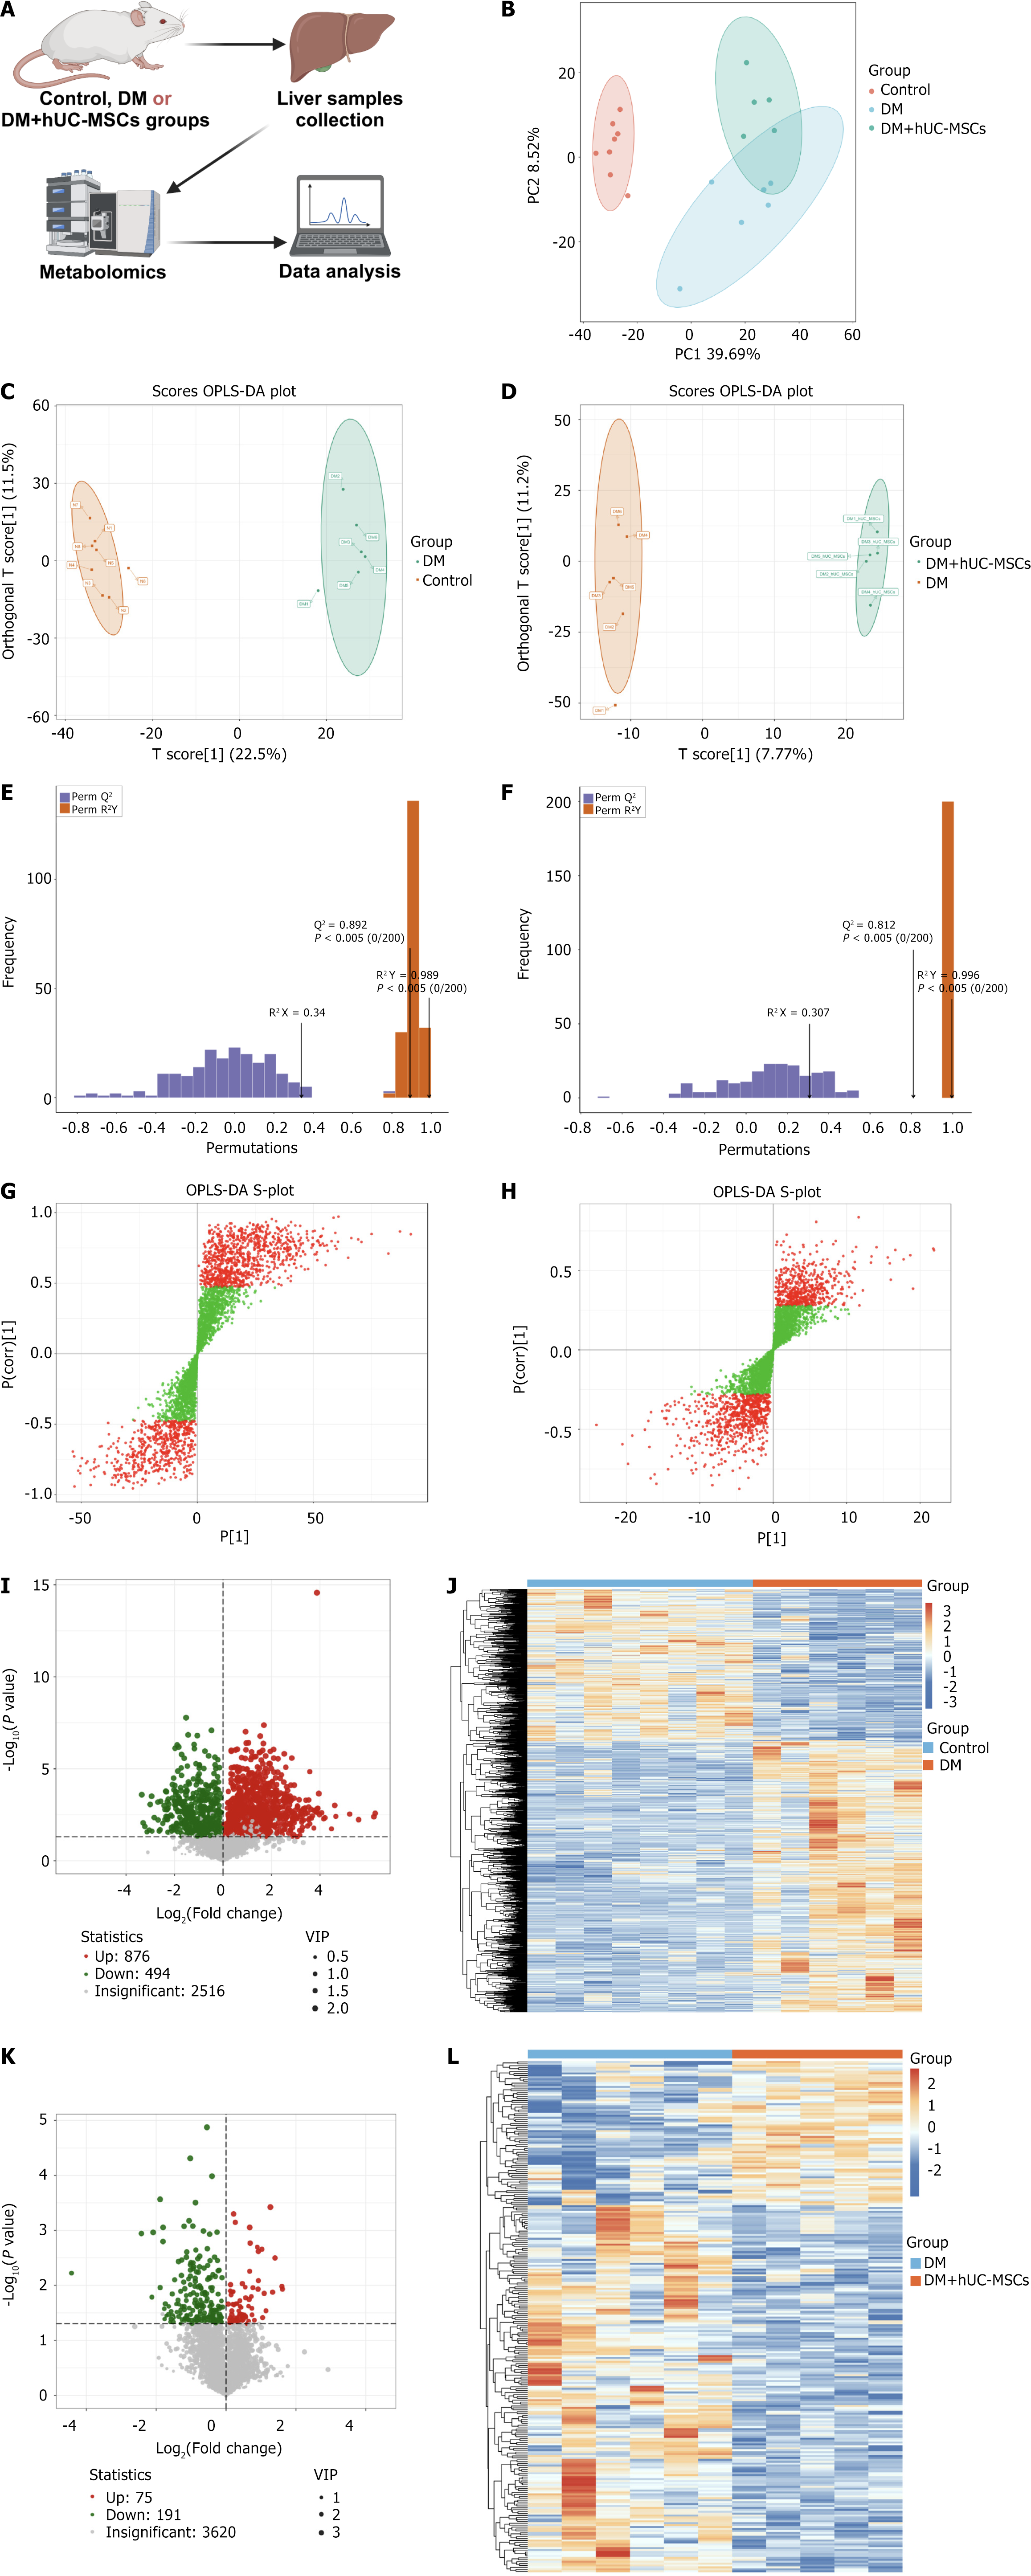
Figure 2 Differential metabolite analysis of liver samples among the different groups of rats.
A: Schematic diagram of the liver metabolomics analysis; B: Two-dimensional principal coordinate analysis plots of the metabolomic profiles of rats in each group; C and D: Orthogonal partial least squares discriminant analysis (OPLS-DA) score plots for the comparison between the control and diabetes mellitus (DM) groups (C) and between the DM and DM + human umbilical cord mesenchymal stem cells (hUC-MSCs) groups (D); E and F: OPLS-DA model validation plots for the control group vs DM group comparison (E) and the DM group vs DM + hUC-MSCs group comparison (F); G and H: OPLS-DA S-plots for the control group vs DM group comparison (G) and the DM group vs DM + hUC-MSCs group comparison (H); red dots represent metabolites with VIP values > 1, and green dots represent metabolites with VIP values ≤ 1; I: Volcano plot of the differential metabolites between the DM group and the control group; J: Clustering heatmap of the differential metabolites between the DM group and the control group; K: Volcano plot of the differential metabolites between the DM and the DM + hUC-MSCs groups; L: Clustering heatmap of the differential metabolites between the DM and the DM + hUC-MSCs groups. Control group, n = 8; diabetes mellitus group, n = 6; diabetes mellitus + human umbilical cord mesenchymal stem cells group, n = 5. hUC-MSCs: Human umbilical cord mesenchymal stem cells; DM: Diabetes mellitus; OPLS-DA: Orthogonal partial least squares discriminant analysis.
- Citation: Zhou KB, Nie L, Wang ML, Xiao DH, Zhang HY, Yang X, Liao DF, Yang XF. Human umbilical cord mesenchymal stem cells ameliorate liver metabolism in diabetic rats with metabolic-associated fatty liver disease. World J Stem Cells 2025; 17(5): 105266
- URL: https://www.wjgnet.com/1948-0210/full/v17/i5/105266.htm
- DOI: https://dx.doi.org/10.4252/wjsc.v17.i5.105266


