Copyright
©The Author(s) 2025.
World J Stem Cells. May 26, 2025; 17(5): 105266
Published online May 26, 2025. doi: 10.4252/wjsc.v17.i5.105266
Published online May 26, 2025. doi: 10.4252/wjsc.v17.i5.105266
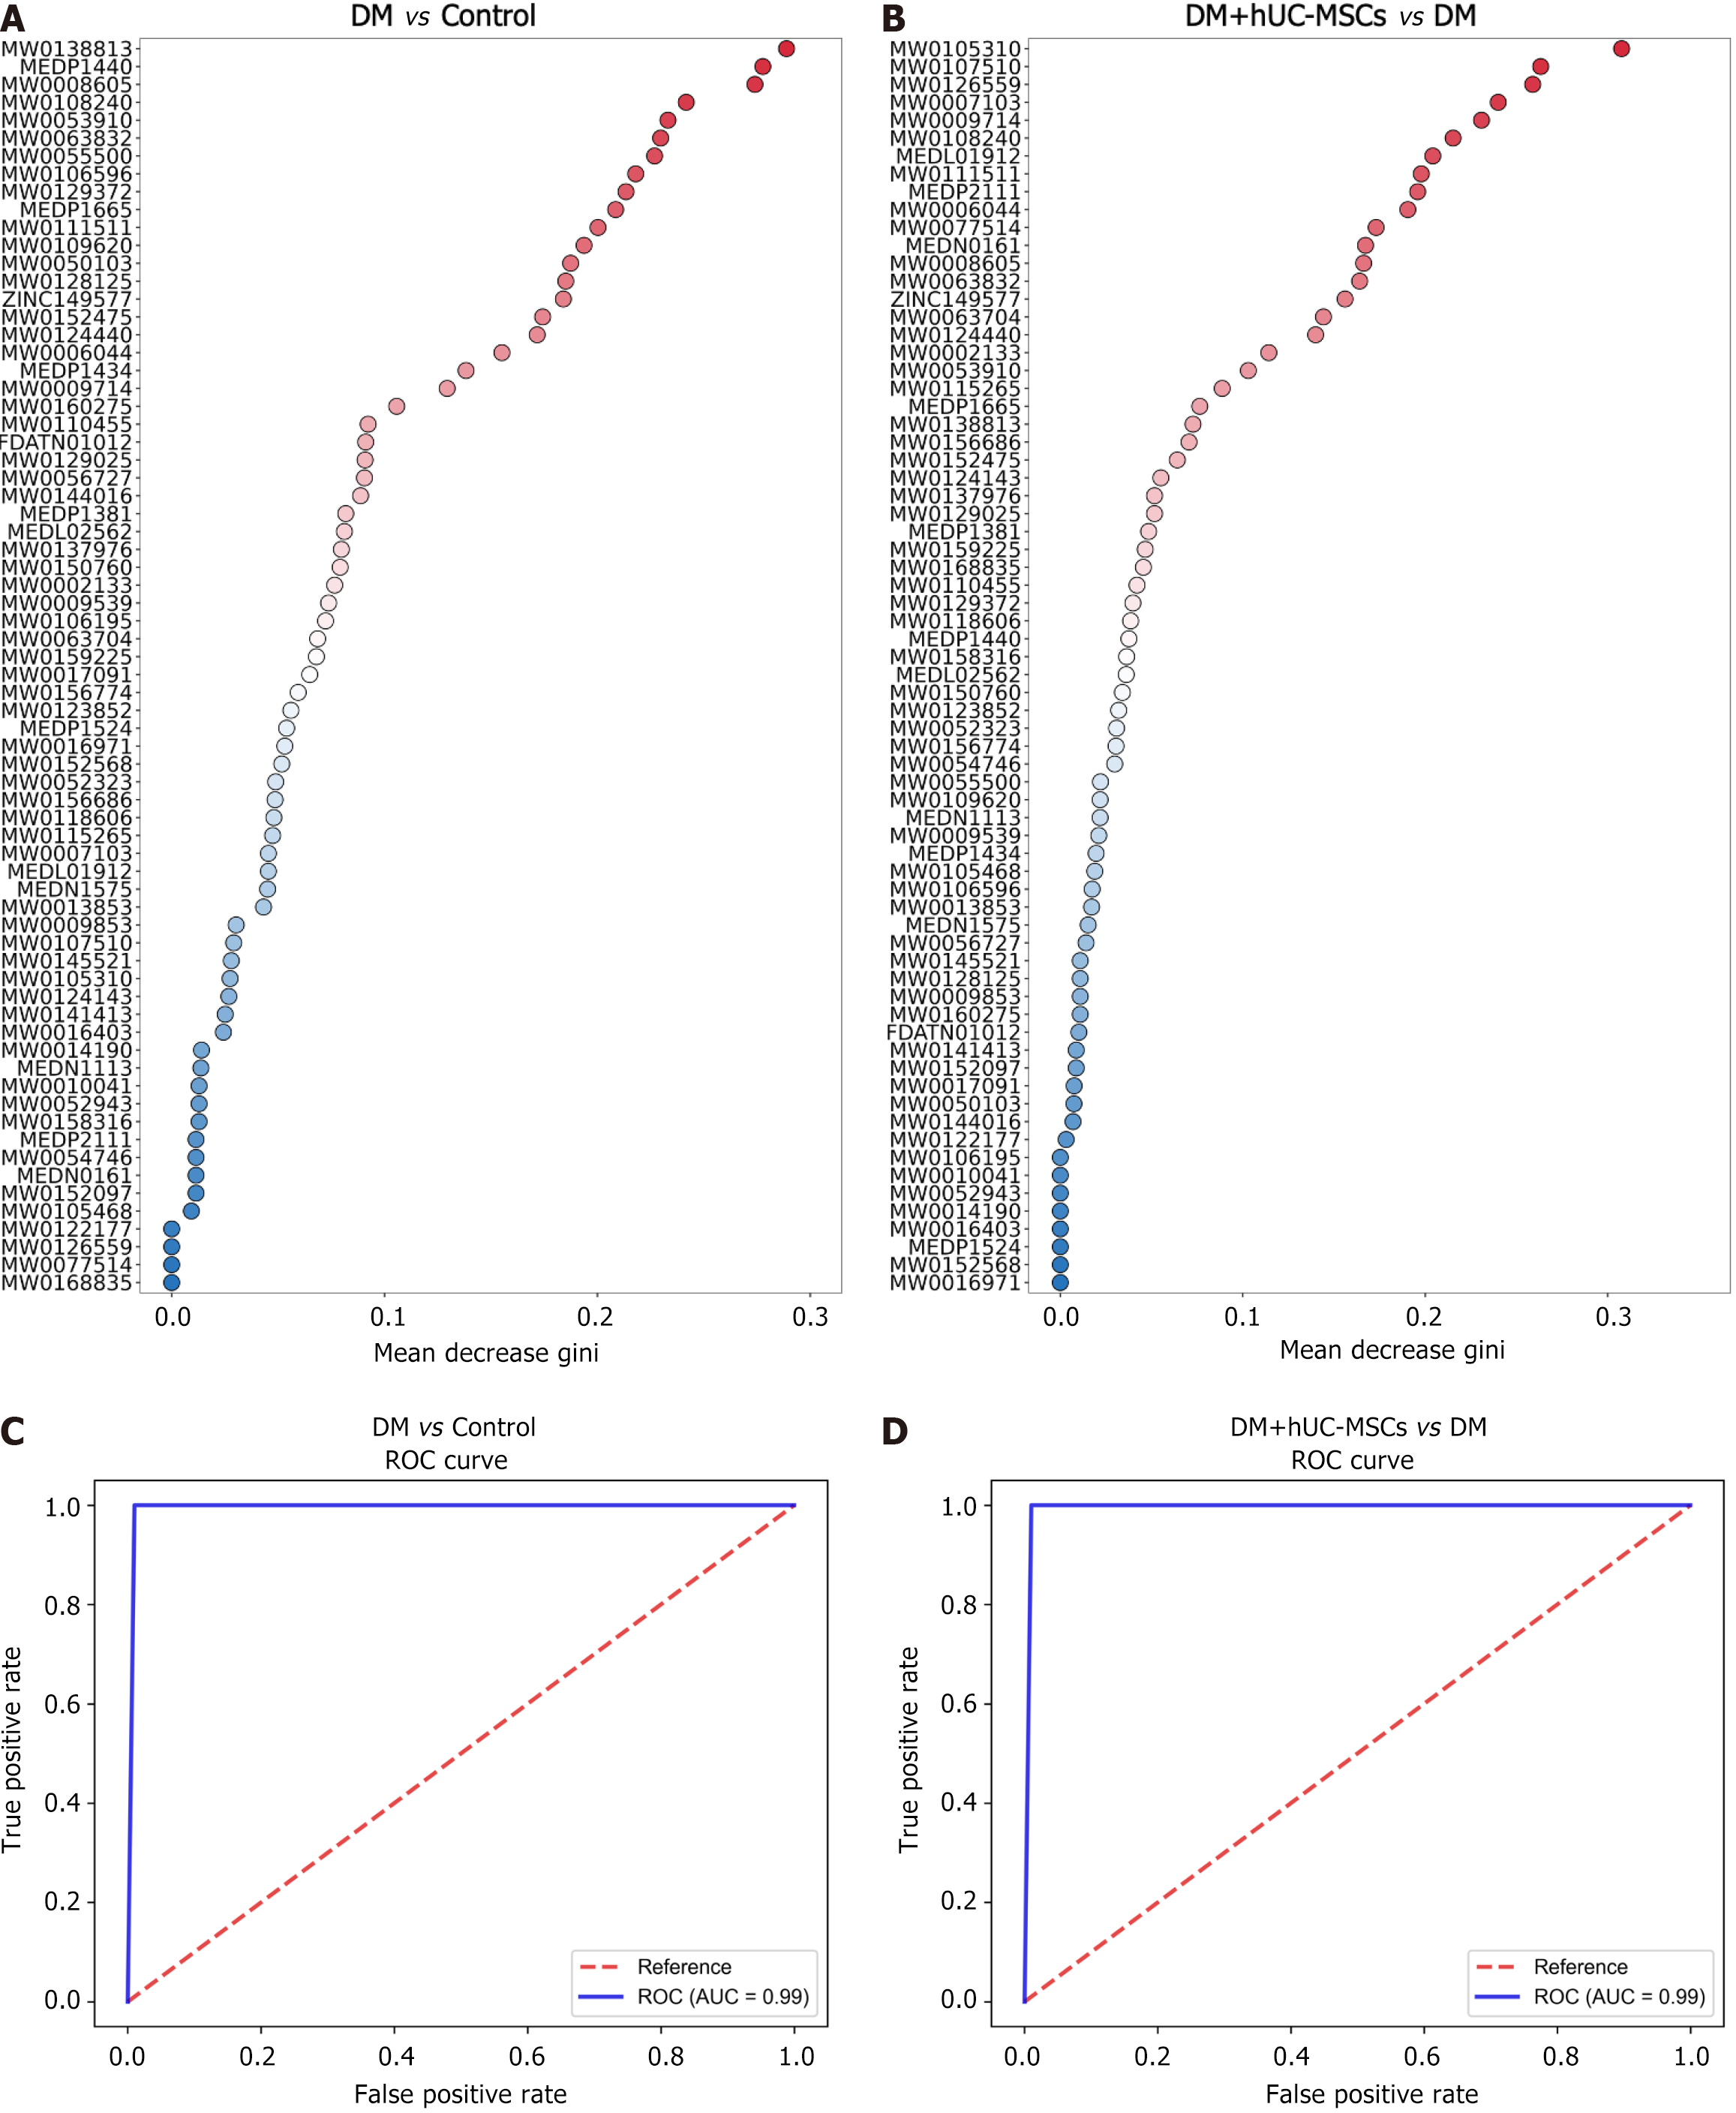
Figure 6 Importance ranking and receiver operating characteristic curves for key differential metabolites for each group based on the random forest model.
A and B: Random forest importance ranking dot plots for key differential metabolites between the different comparison groups. The X axis represents the importance indicator values; C and D: Composite receiver operating characteristic curves generated for key differential metabolites between the different comparison groups based on the random forest model. Control group, n = 8; diabetes mellitus group, n = 6; diabetes mellitus + human umbilical cord mesenchymal stem cells group, n = 5. hUC-MSCs: Human umbilical cord mesenchymal stem cells; DM: Diabetes mellitus; ROC: Receiver operating characteristic; AUC: Area under the curve.
- Citation: Zhou KB, Nie L, Wang ML, Xiao DH, Zhang HY, Yang X, Liao DF, Yang XF. Human umbilical cord mesenchymal stem cells ameliorate liver metabolism in diabetic rats with metabolic-associated fatty liver disease. World J Stem Cells 2025; 17(5): 105266
- URL: https://www.wjgnet.com/1948-0210/full/v17/i5/105266.htm
- DOI: https://dx.doi.org/10.4252/wjsc.v17.i5.105266


