Copyright
©The Author(s) 2025.
World J Stem Cells. May 26, 2025; 17(5): 105266
Published online May 26, 2025. doi: 10.4252/wjsc.v17.i5.105266
Published online May 26, 2025. doi: 10.4252/wjsc.v17.i5.105266
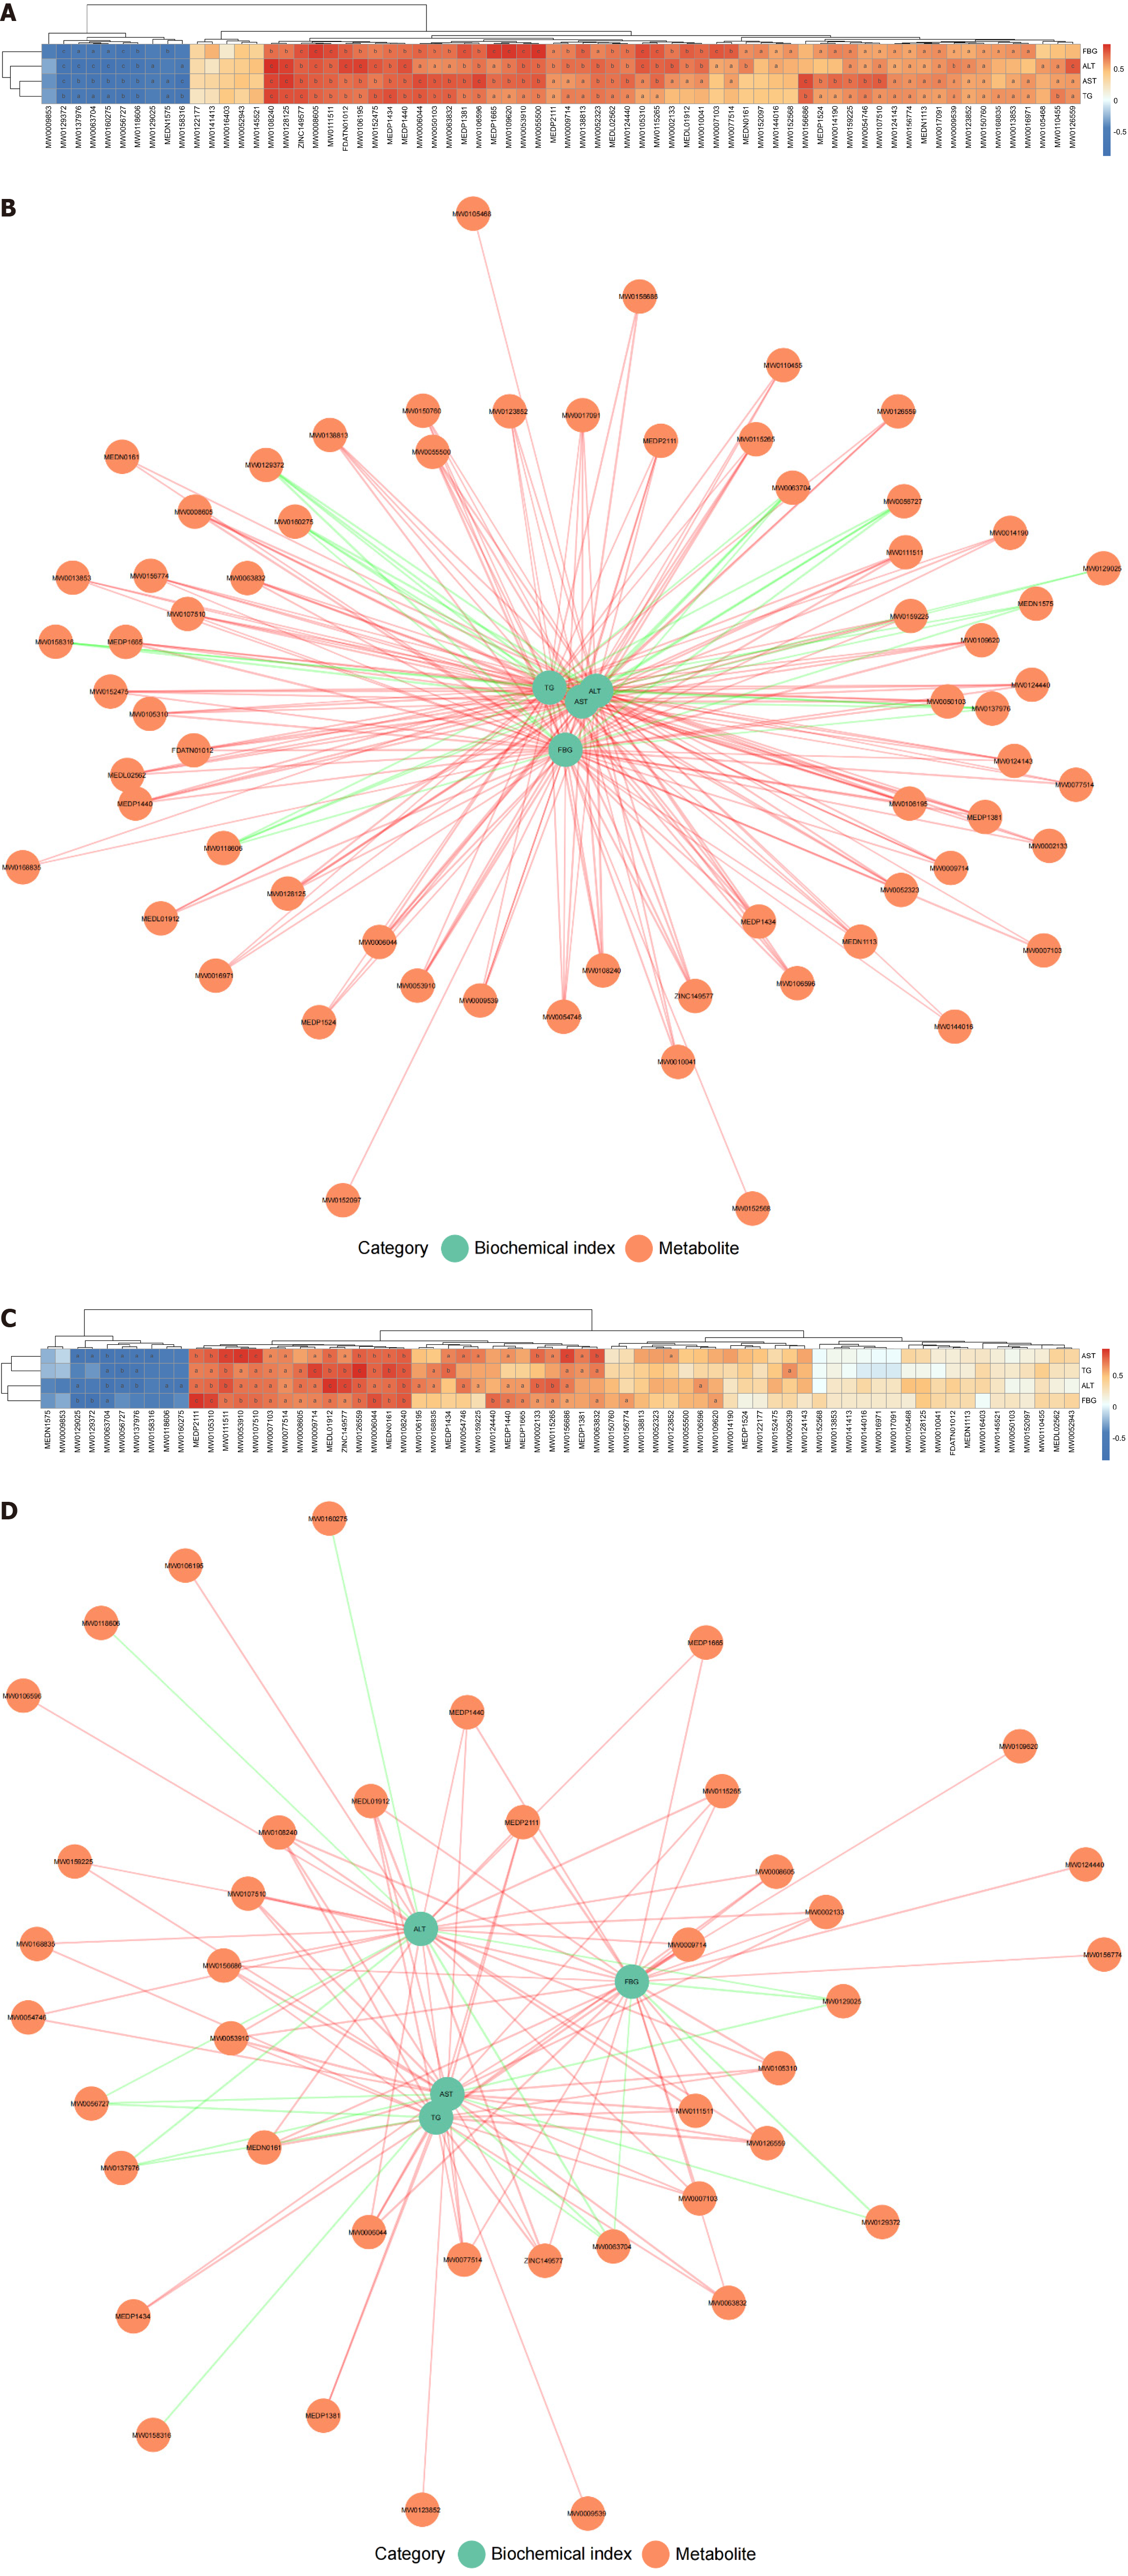
Figure 7 Correlation analysis between biochemical indexes and key differential metabolites in rats of each group.
A: Spearman correlation heatmap of biochemical indexes and key differential metabolites in the diabetes mellitus (DM) group vs control group comparison. Orange represents positive correlations and blue represents negative correlations; the depth of the color indicates the strength of the correlation; B: Spearman correlation network between biochemical indexes and key differential metabolites in the DM group vs control group comparison. Red lines represent positive correlations and green lines represent negative correlations; the thickness of the lines indicates the strength of the correlation; C: Spearman correlation heatmap of biochemical indexes and key differential metabolites in the DM group vs DM + human umbilical cord mesenchymal stem cells group comparison; D: Spearman correlation network between biochemical indexes and key differential metabolites in the DM group vs DM + human umbilical cord mesenchymal stem cells group comparison. aP < 0.05, bP < 0.01, cP < 0.001. Control group, n = 8; diabetes mellitus group, n = 6; diabetes mellitus + human umbilical cord mesenchymal stem cells group, n = 5. FBG: Fasting blood glucose; ALT: Alanine aminotransferase; AST: Aspartate aminotransferase; TG: Triglyceride.
- Citation: Zhou KB, Nie L, Wang ML, Xiao DH, Zhang HY, Yang X, Liao DF, Yang XF. Human umbilical cord mesenchymal stem cells ameliorate liver metabolism in diabetic rats with metabolic-associated fatty liver disease. World J Stem Cells 2025; 17(5): 105266
- URL: https://www.wjgnet.com/1948-0210/full/v17/i5/105266.htm
- DOI: https://dx.doi.org/10.4252/wjsc.v17.i5.105266


