Copyright
©The Author(s) 2019.
World J Stem Cells. Oct 26, 2019; 11(10): 831-858
Published online Oct 26, 2019. doi: 10.4252/wjsc.v11.i10.831
Published online Oct 26, 2019. doi: 10.4252/wjsc.v11.i10.831
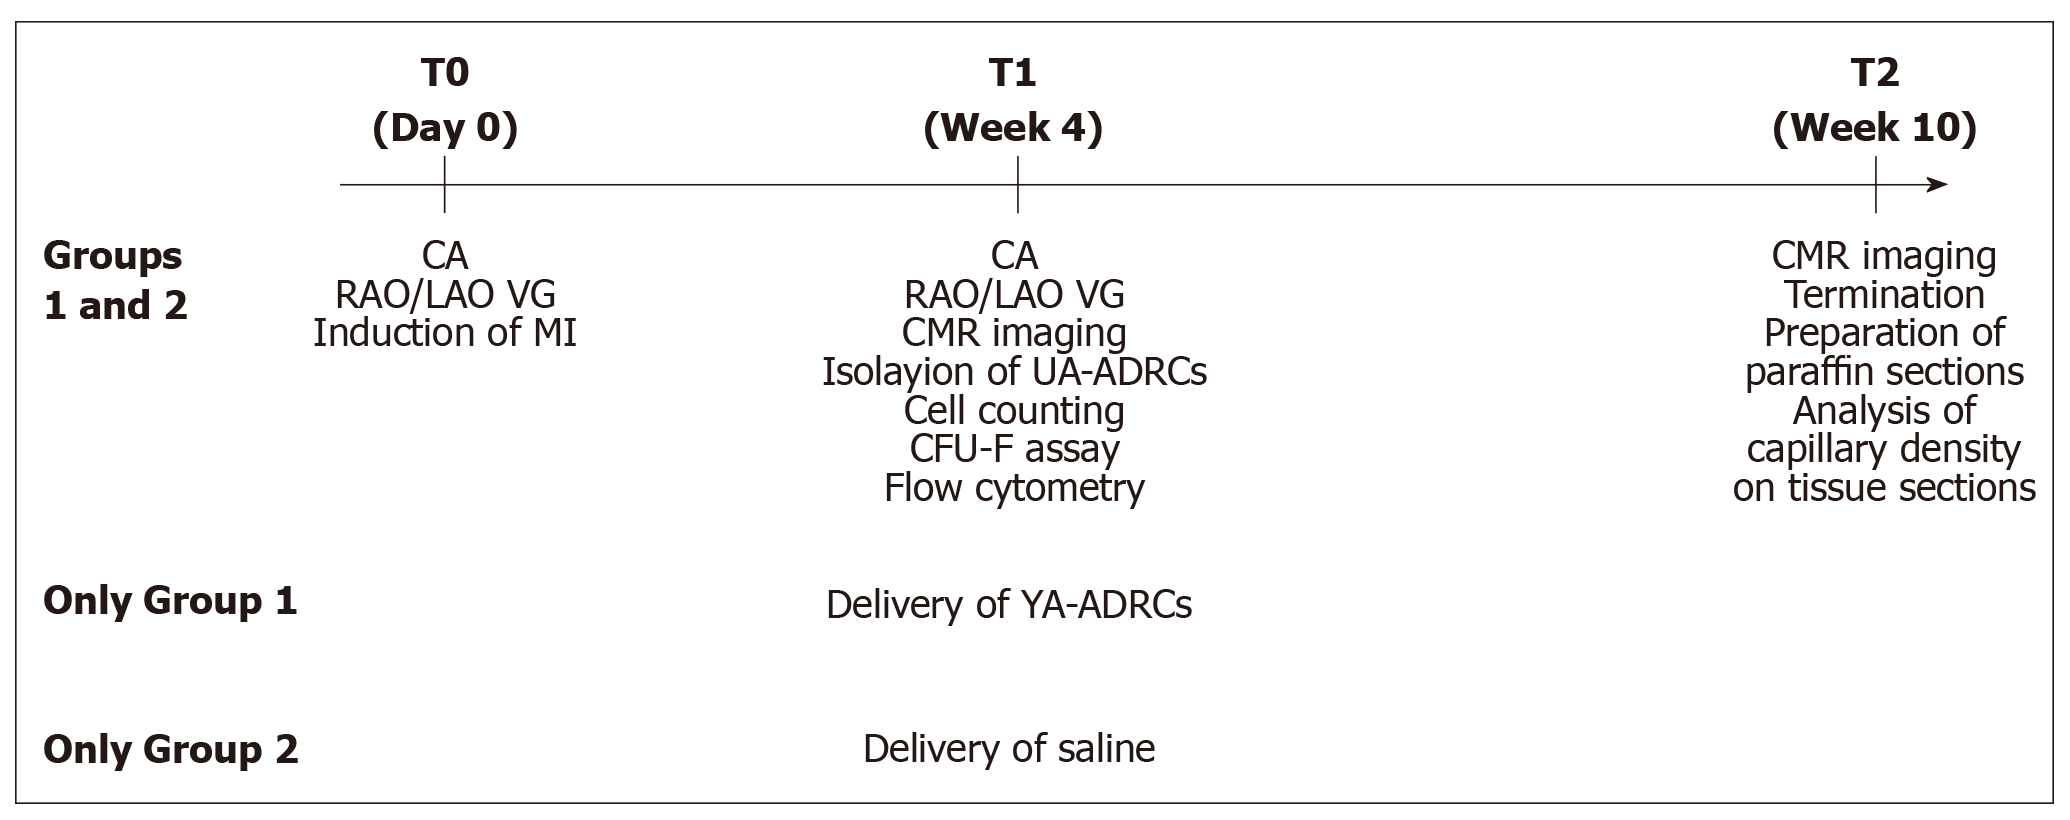
Figure 1 Experimental details of the present study.
CA: Coronary angiography; RAO/LAO VG: Ventriculography in right and left anterior oblique views; MI: Myocardial infarction; CMR: Cardiac magnetic resonance; UA-ADRCs: Fresh, uncultured, unmodified, autologous adipose-derived regenerative cells.
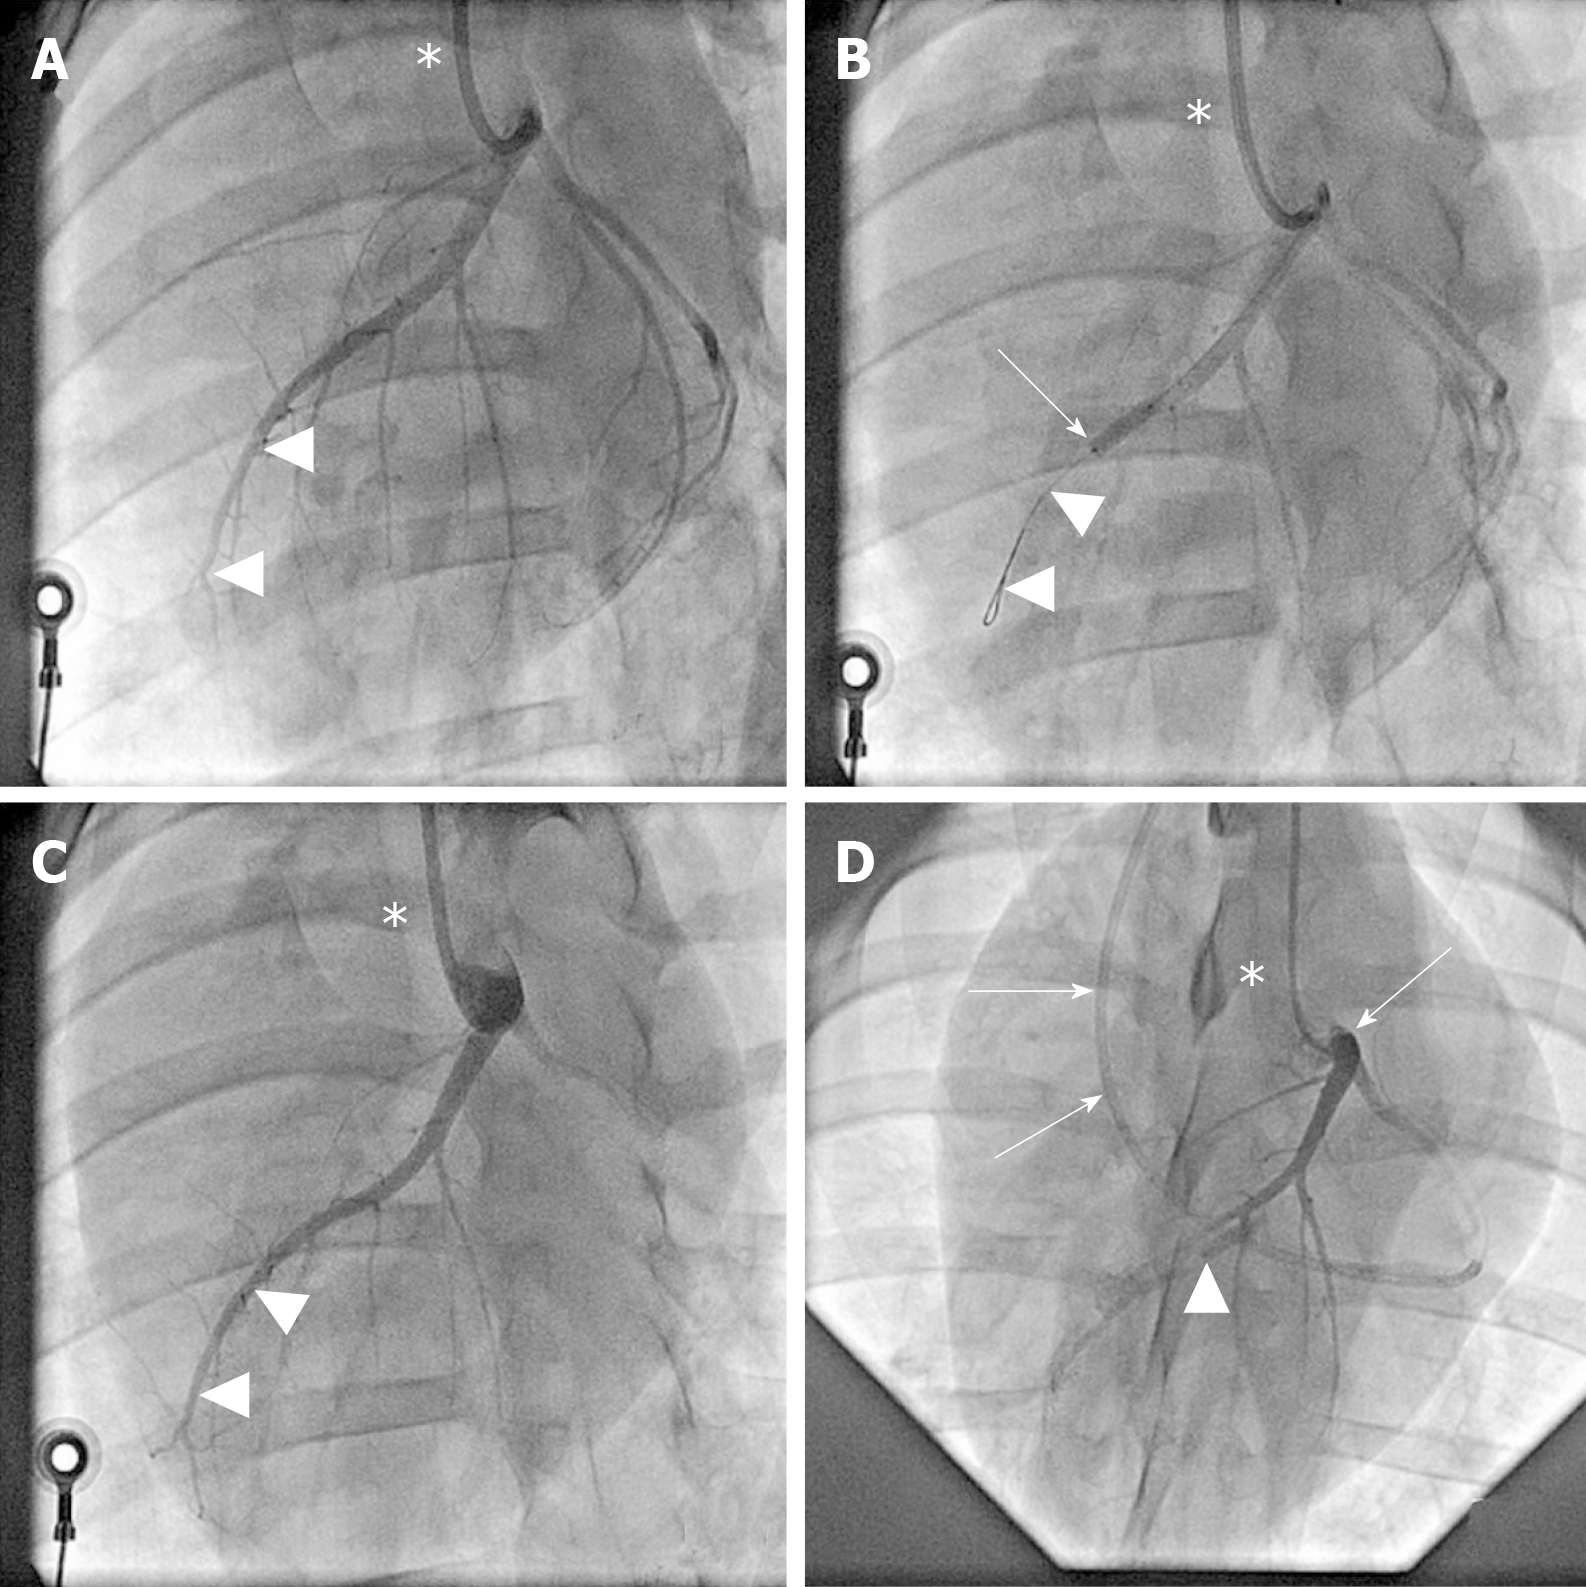
Figure 2 Angiographic details of the present study.
A: Baseline coronary angiography of a porcine heart in a left anterior oblique view (in all panels, the white asterisk indicates the angiography catheter positioned in the left main coronary ostium). The white arrowheads indicate the distal LAD artery; B: Induction of myocardial infarction by occlusion of the LAD artery for three hours through an inflated balloon catheter at time point T0. The white arrow indicates the position of the inflated balloon inside the mid LAD artery, whereas the white arrowheads show the guidewire in the distally occluded LAD artery; C: Complete reperfusion of the LAD artery (white arrowheads) three hours after removal of the balloon occlusion; D: Delivery of fresh, uncultured, unmodified, autologous adipose-derived regenerative cells (or saline as control, respectively) through the LAD vein (matching the initial LAD artery occlusion site) into the infarction area 4 wk later (i.e. at time point T1). To this end, the LAD vein was occluded with an inflated “over the wire” balloon catheter advanced through a guiding catheter (black arrows), placed from the right jugular vein into the right atrium and then into the coronary sinus. The inflated balloon (filled with contrast dye; white arrowhead) in the coronary LAD vein had the aim to prevent the backflow of cells when they were delivered through the distal orifice of the central lumen of this balloon catheter. LAD: Left anterior descending.
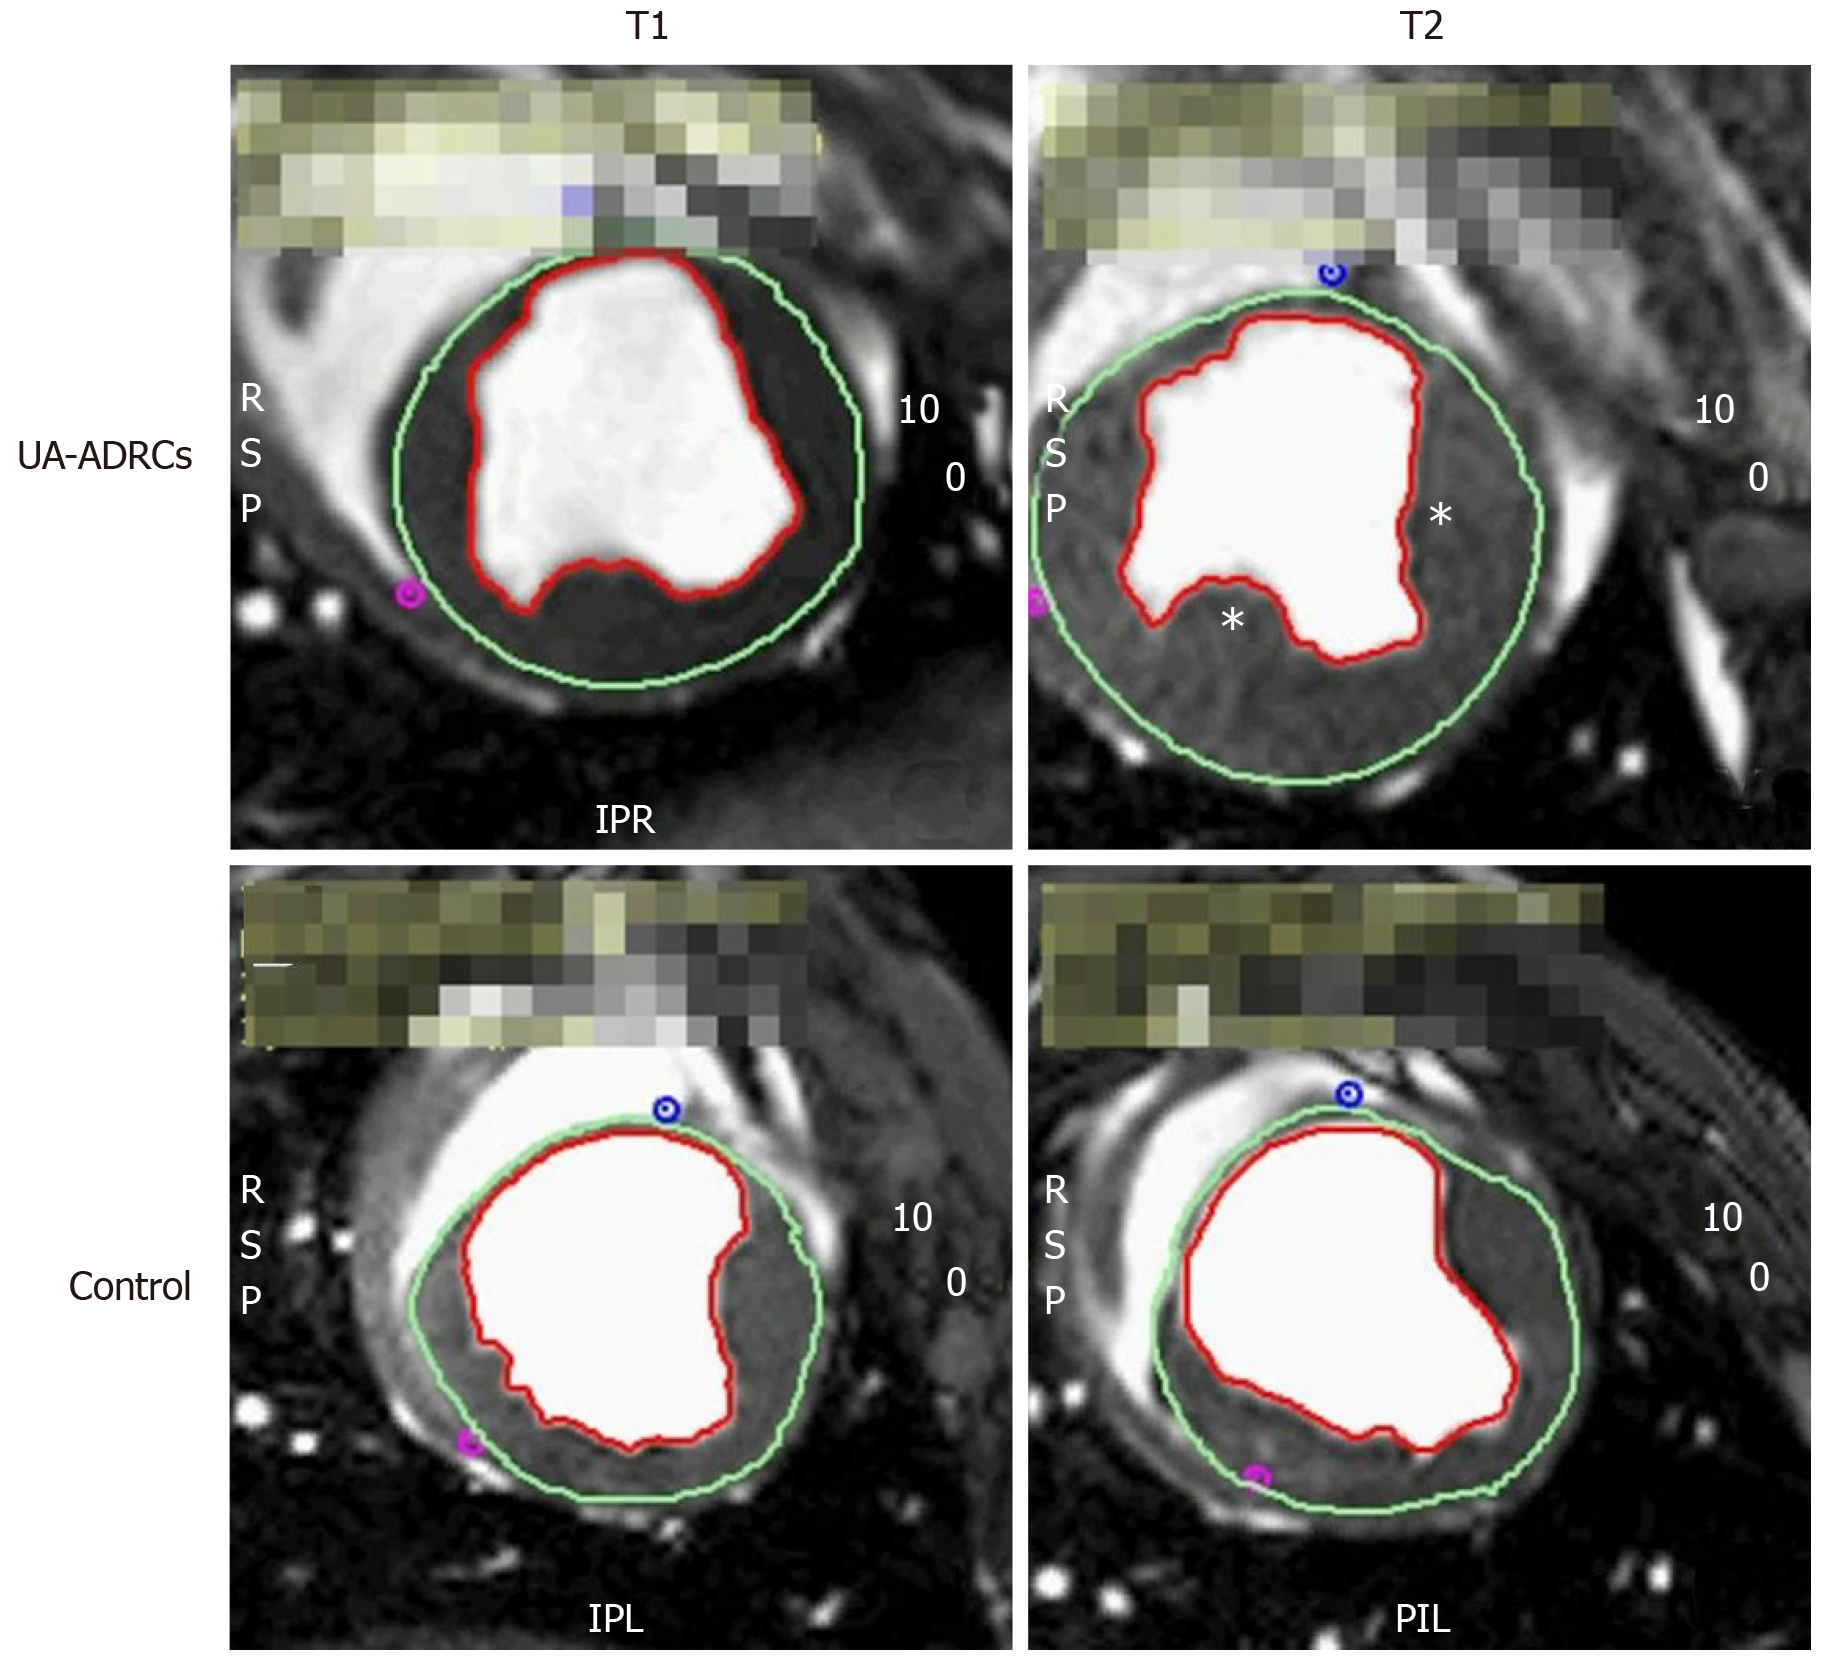
Figure 3 Steady-state free precession CMR imaging of the porcine heart.
A-D: Representative examples of end-systolic, short axis, transversal images through the mid left ventricle of a porcine heart obtained with SSFP CMR imaging for analyzing hemodynamic parameters and wall motility at time points T1 (A, C) and T2 (B, D) of a representative animal in group 1 (delivery of UA-ADRCs) (A, B) and a representative animal in group 2 (control) (C, D) (details are provided in the main text). In all panels, the epicardial contours are highlighted in green, and the endocardial contours in red. Note the increased end-systolic thickness of the left ventricular wall at T2 after delivery of UA-ADRCs at T1 (asterisks in B) compared to the delivery of saline at T1 (D). In the examples presented here, the left ventricular ejection fraction was 27.2% in (A), 39.7% in (B), 22.5% in (C), and 27.2% in (D). CMR: Cardiac magnetic resonance; SSFP CMR: Steady-state free precession cardiac magnetic resonance; UA-ADRCs: Fresh, uncultured, unmodified, autologous adipose-derived regenerative cells.
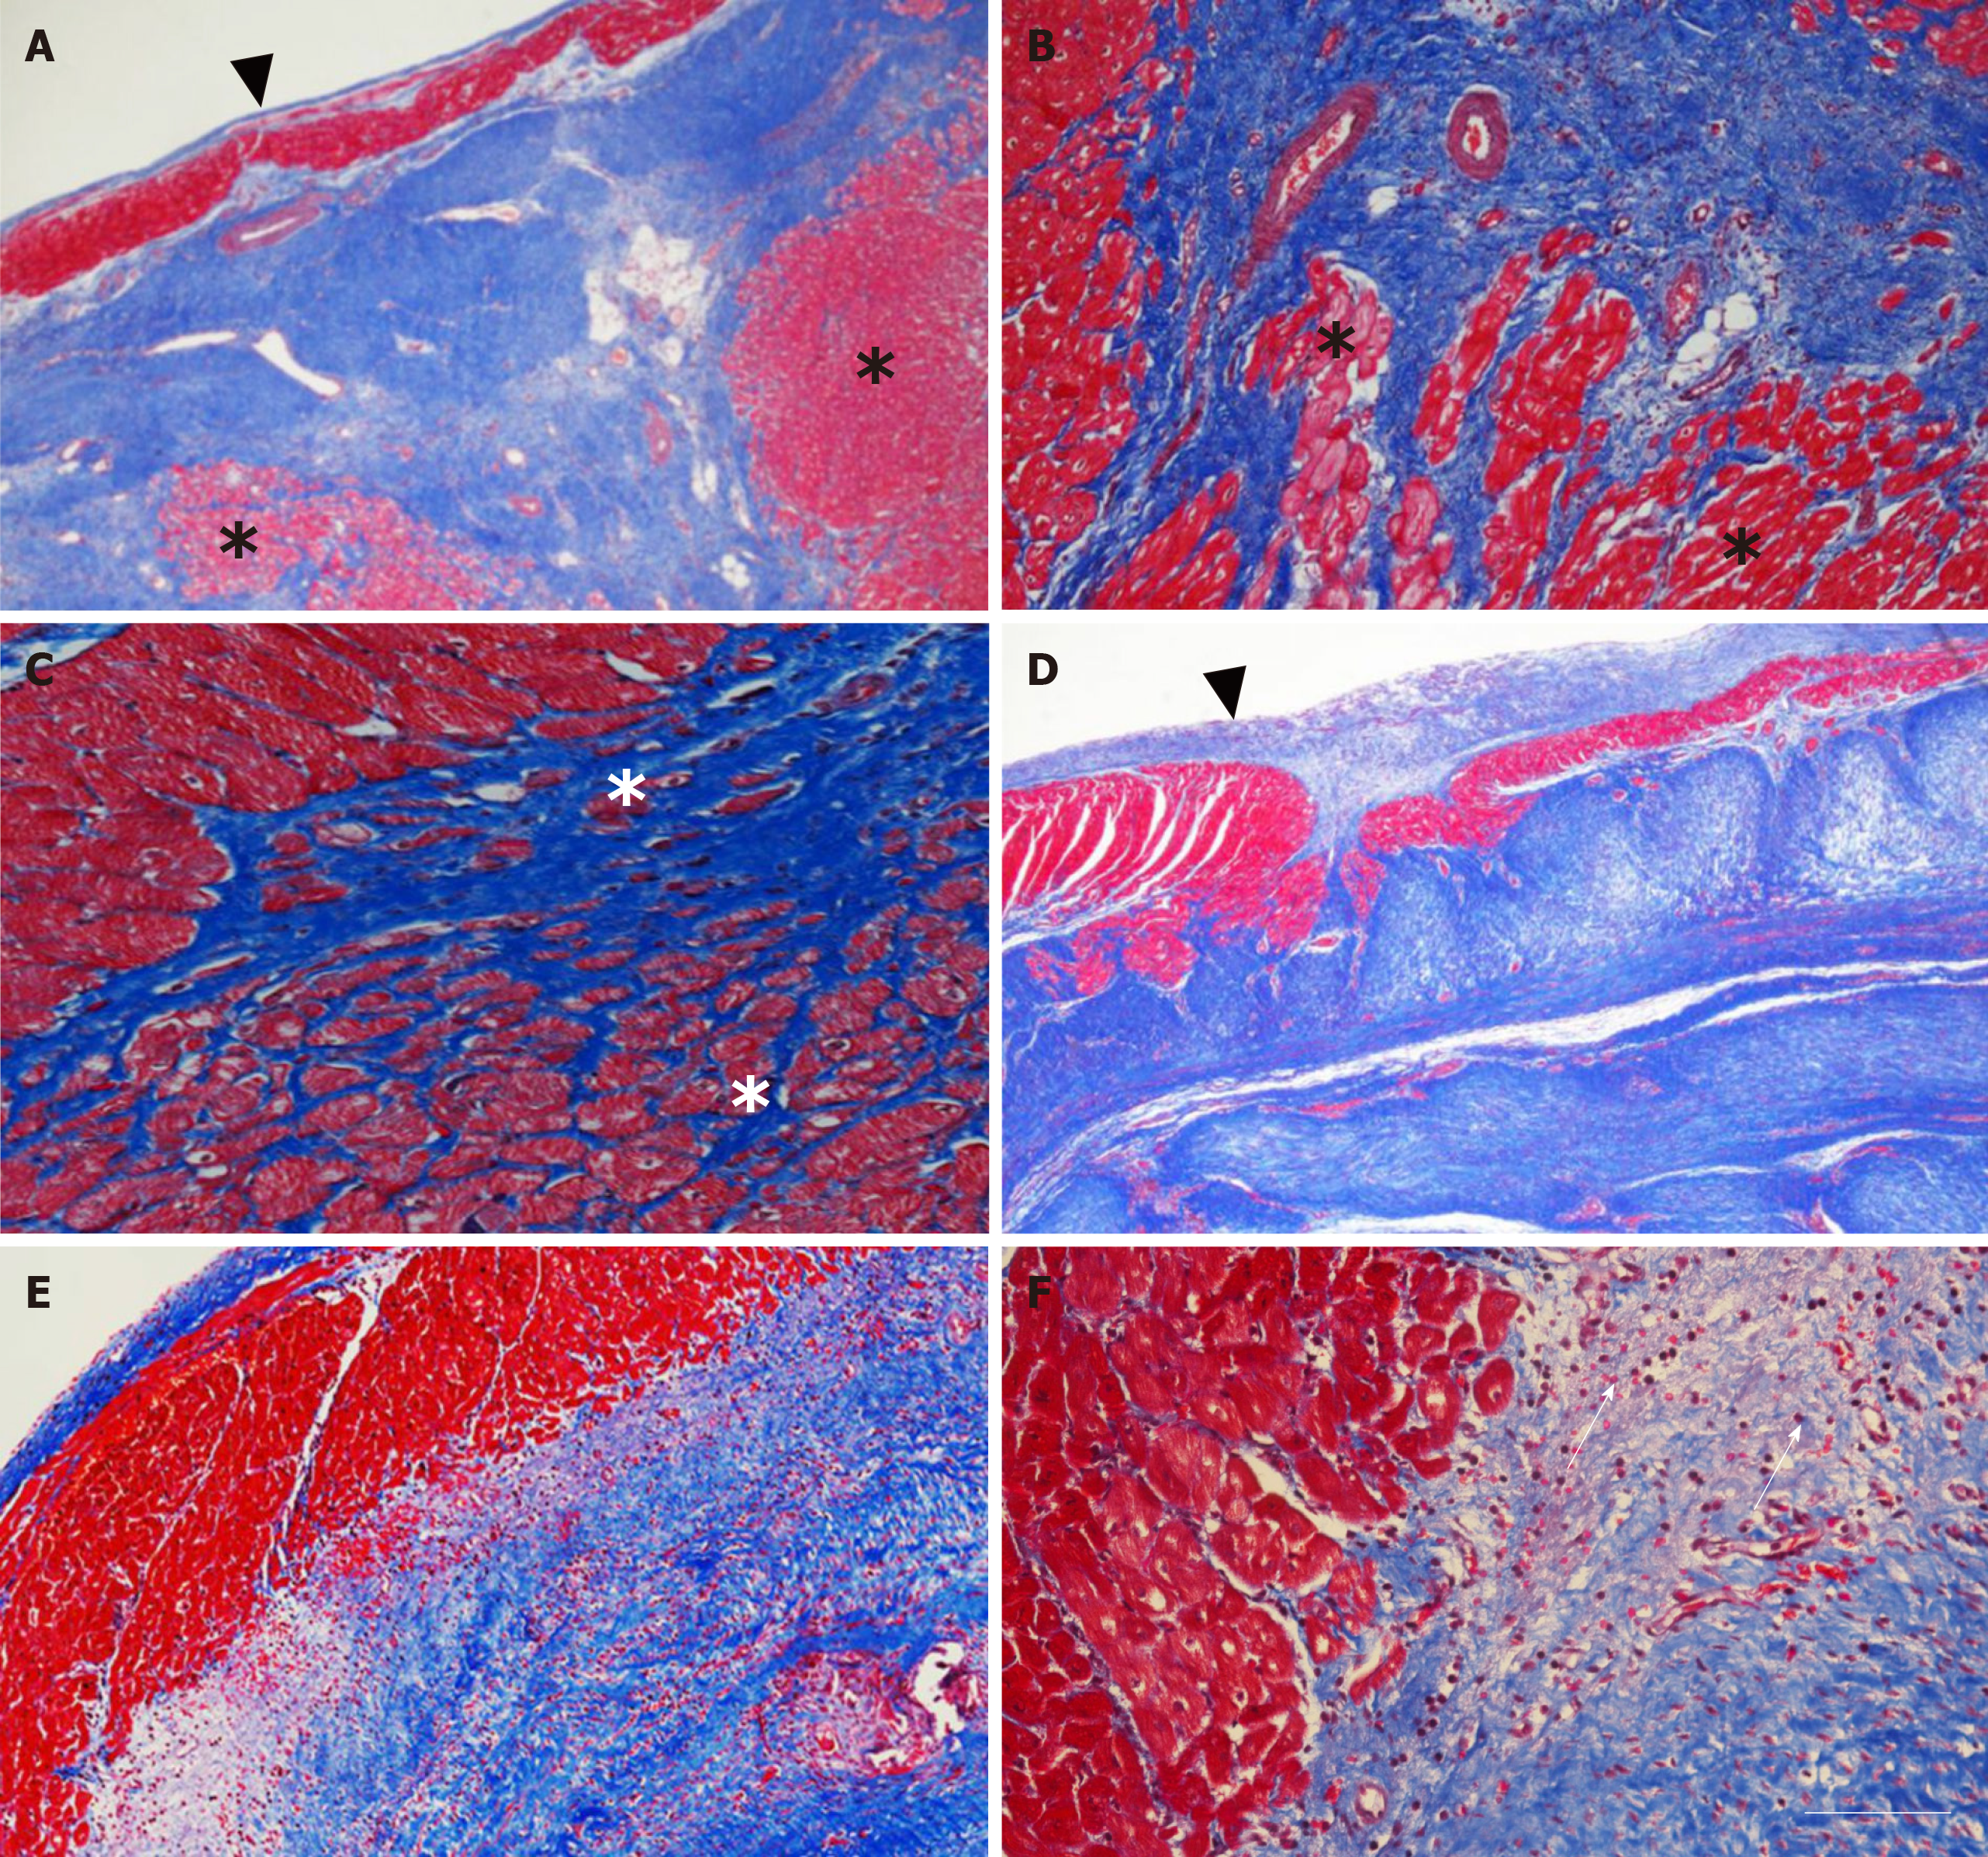
Figure 4 Microstructure of cardiac tissue after delivery of UA-ADRCs or saline.
A-F: Representative photomicrographs of paraffin-embedded, 5 µm thick tissue sections stained with Masson’s Trichrome staining of post mortem hearts from pigs in group 1 (delivery of fresh, uncultured, unmodified, autologous adipose-derived regenerative cells) (A-C) and group 2 (delivery of saline as control) (D-F) at T2. The arrowheads in (A, D) point to the endocardium, the asterisks in (A-C) indicate patchy islets of cardiomyocytes located within areas of fibrous tissue, and the arrows in (F) point to an infiltration with inflammatory cells. The scale bar in (F) represents 500 µm in (A, D), 200 µm in (B, E), and 100 µm in (C, F). UA-ADRCs: Fresh, uncultured, unmodified, autologous adipose-derived regenerative cells.
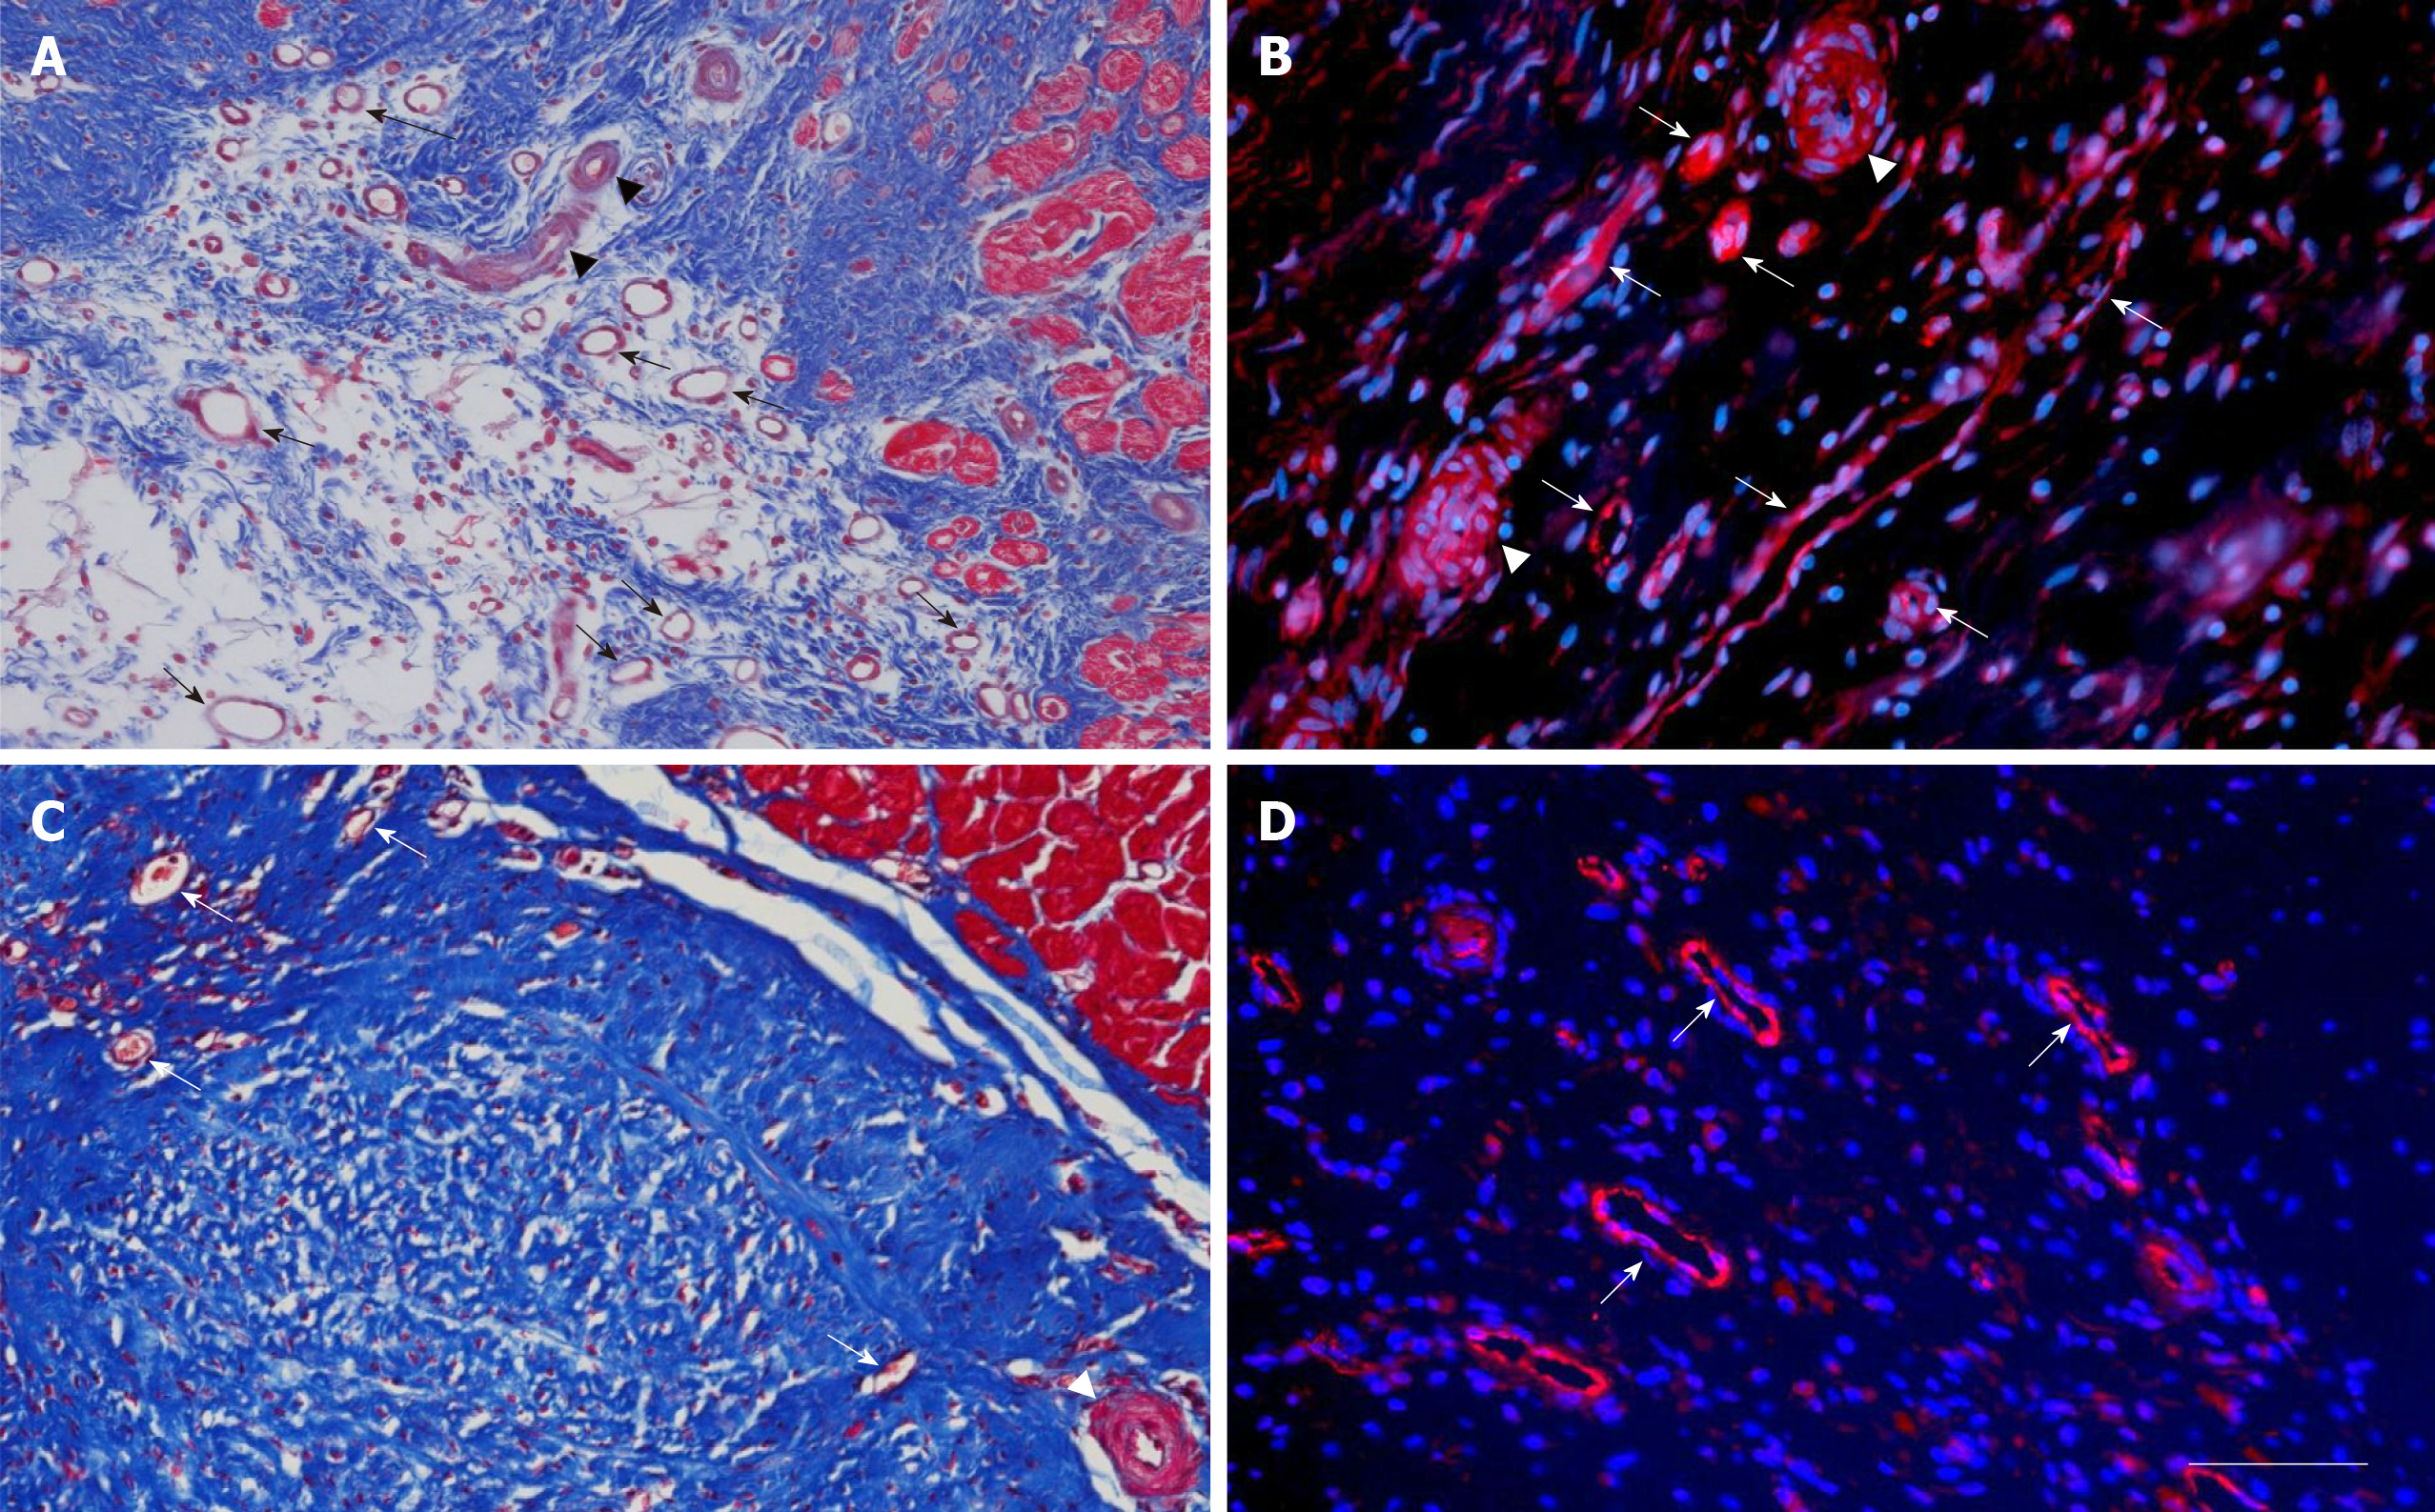
Figure 5 Microvessel density after delivery of UA-ADRCs or saline.
The panels show representative photomicrographs of paraffin-embedded, 5 µm thick tissue sections of post mortem hearts from pigs in group 1 (delivery of fresh, uncultured, unmodified, autologous adipose-derived regenerative cells) (A, B) and group 2 (delivery of saline as control) (C, D) at T2. In (A, C), tissue sections were stained with Masson’s Trichrome staining. In (B, D), tissue sections were processed with fluorescence immunohistochemistry in order to detect von Willebrand factor (red) (counterstaining with DAPI in blue). The arrows point to microvessels, and the arrowheads to small arterioles. The scale bar shown in D represents 100 µm in (A, C) and 35 µm in (B, D). UA-ADRCs: Fresh, uncultured, unmodified, autologous adipose-derived regenerative cells.
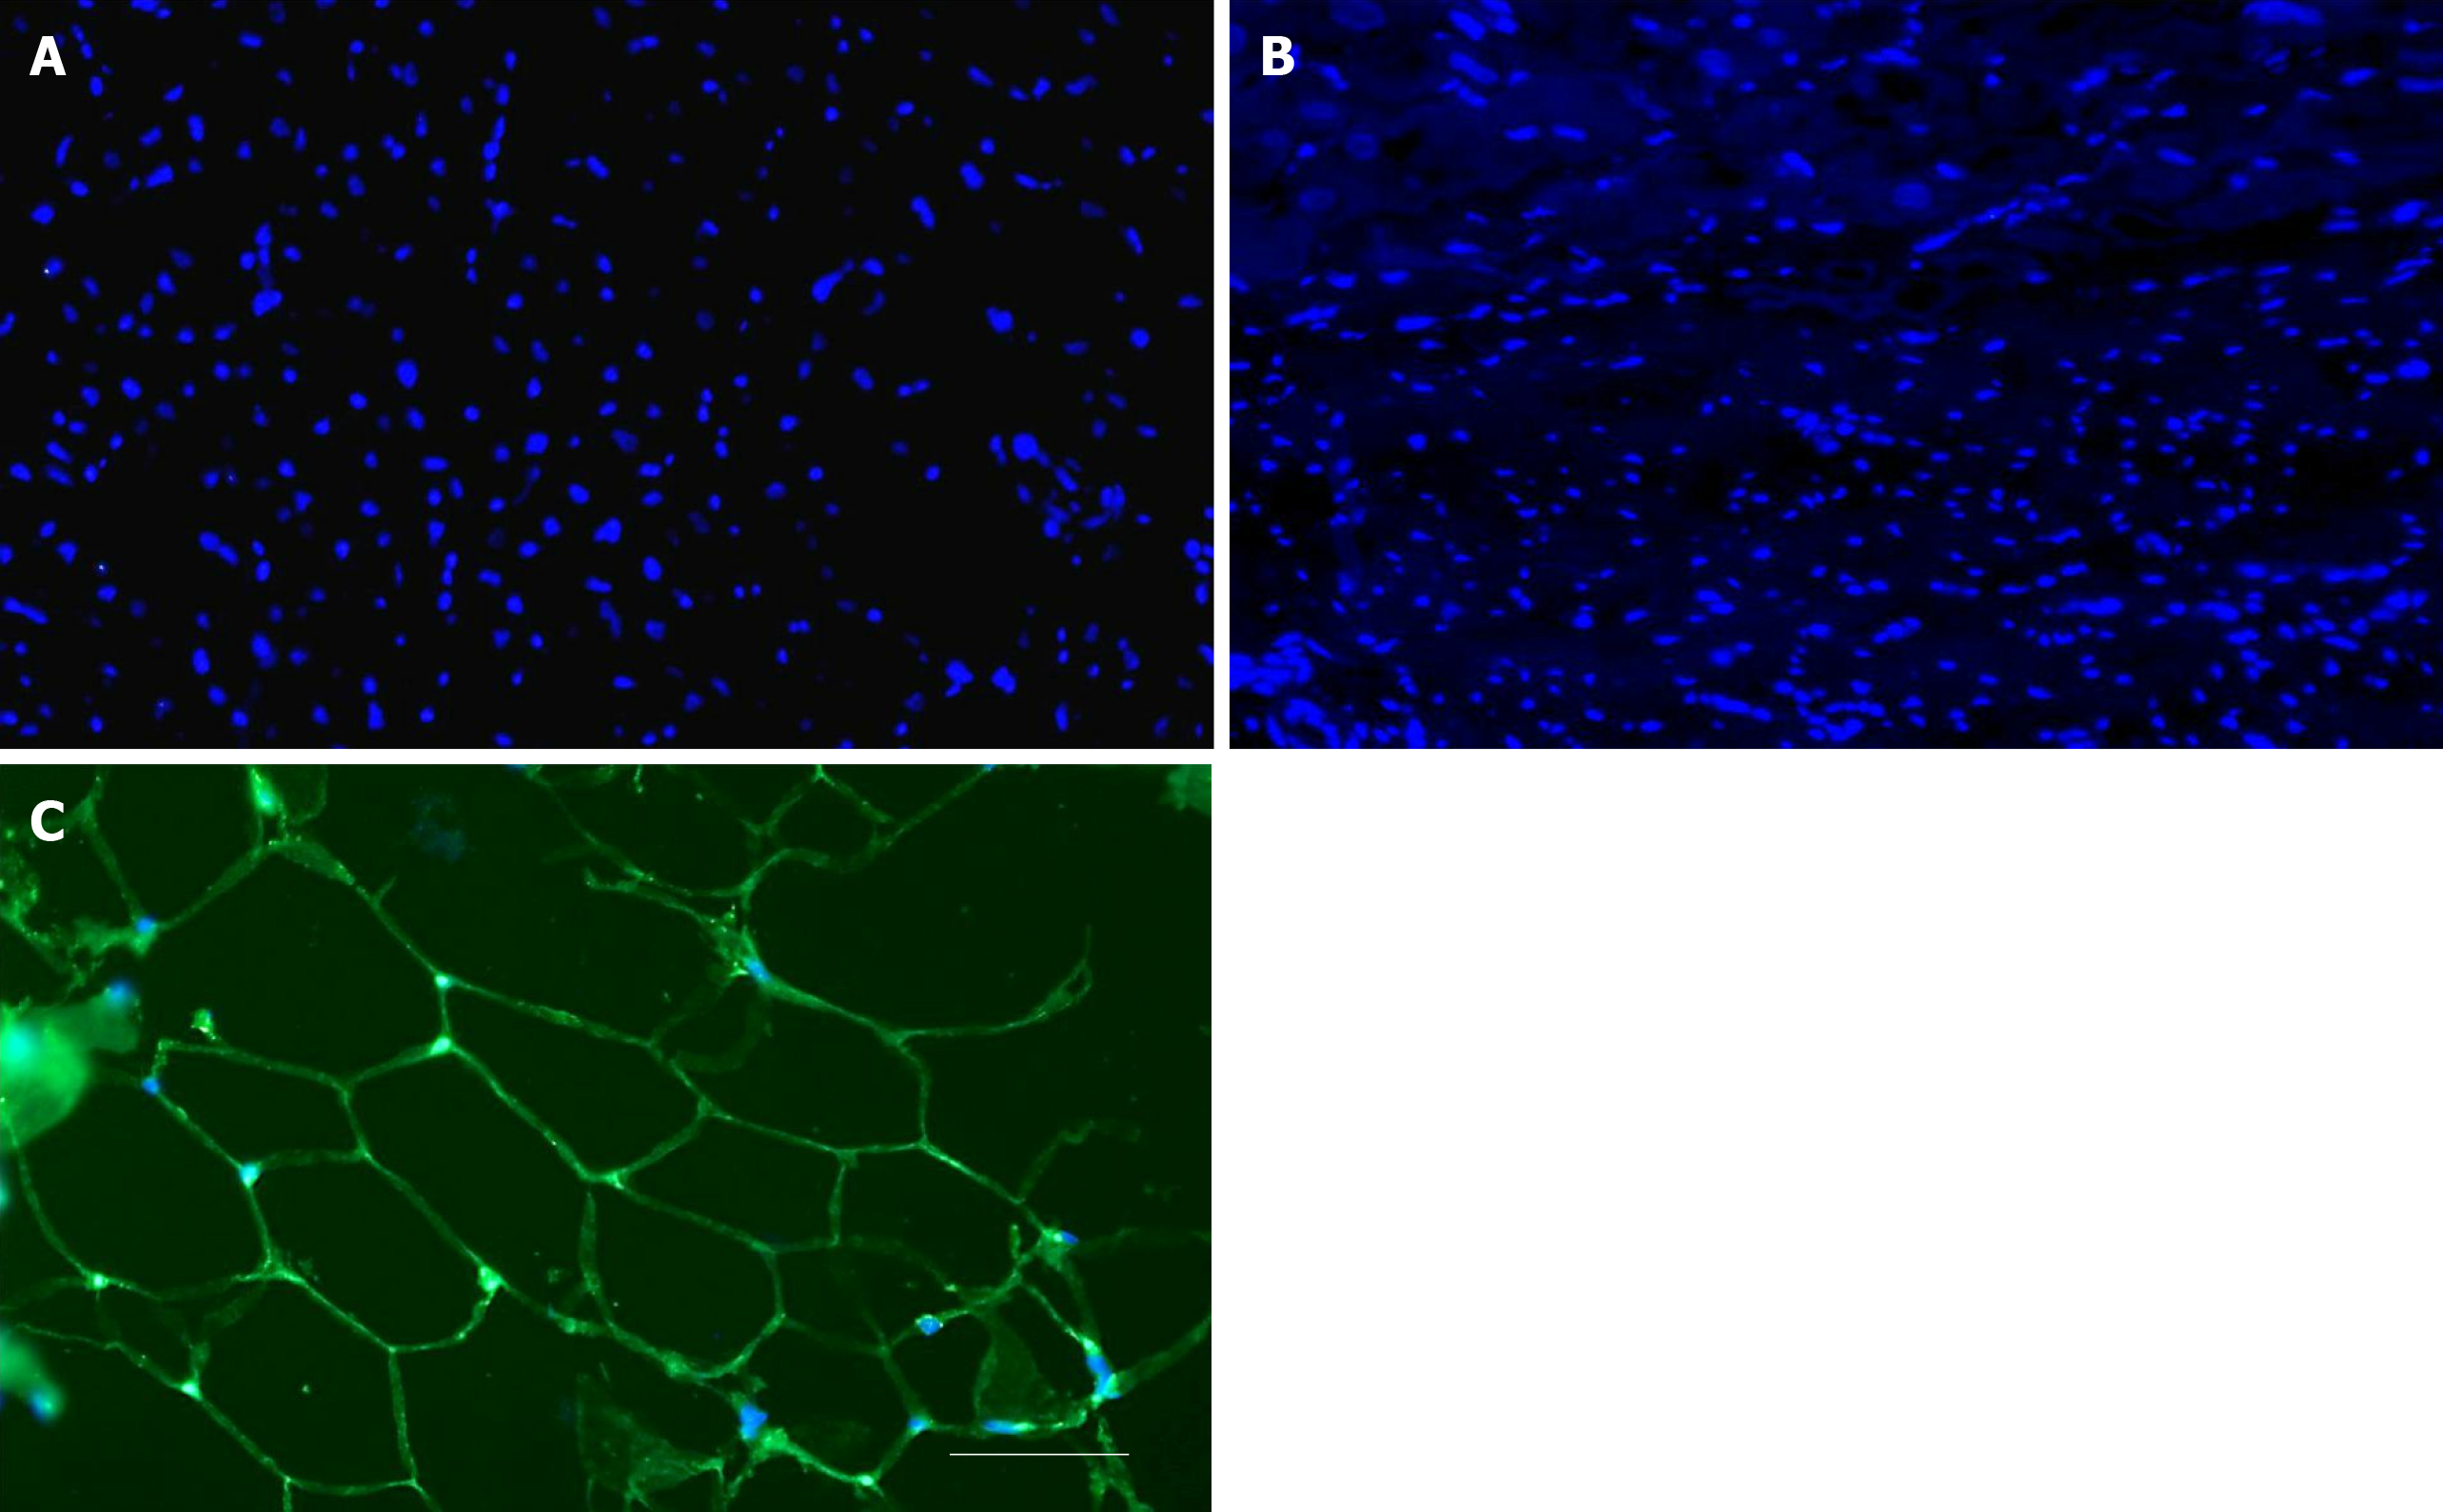
Figure 6 No differentiation of stem cells into adipocytes after delivery of UA-ADRCs.
A, B: Representative photomicrographs of paraffin-embedded, 5 µm thick tissue sections of post mortem hearts from pigs in group 1 (delivery of fresh, uncultured, unmodified, autologous adipose-derived regenerative cells) (A) and group 2 (delivery of saline as control) (B), taken from the left ventricular border zone of myocardial infarction at 10 wk. (C) Representative photomicrograph of a paraffin-embedded, 5 µm thick tissue section of subcutaneous adipose tissue from a pig. The sections were stained with DAPI (blue), and processed for immunofluorescent detection of adiponectin (green). The scale bar represents 100 µm. UA-ADRCs: Fresh, uncultured, unmodified, autologous adipose-derived regenerative cells.
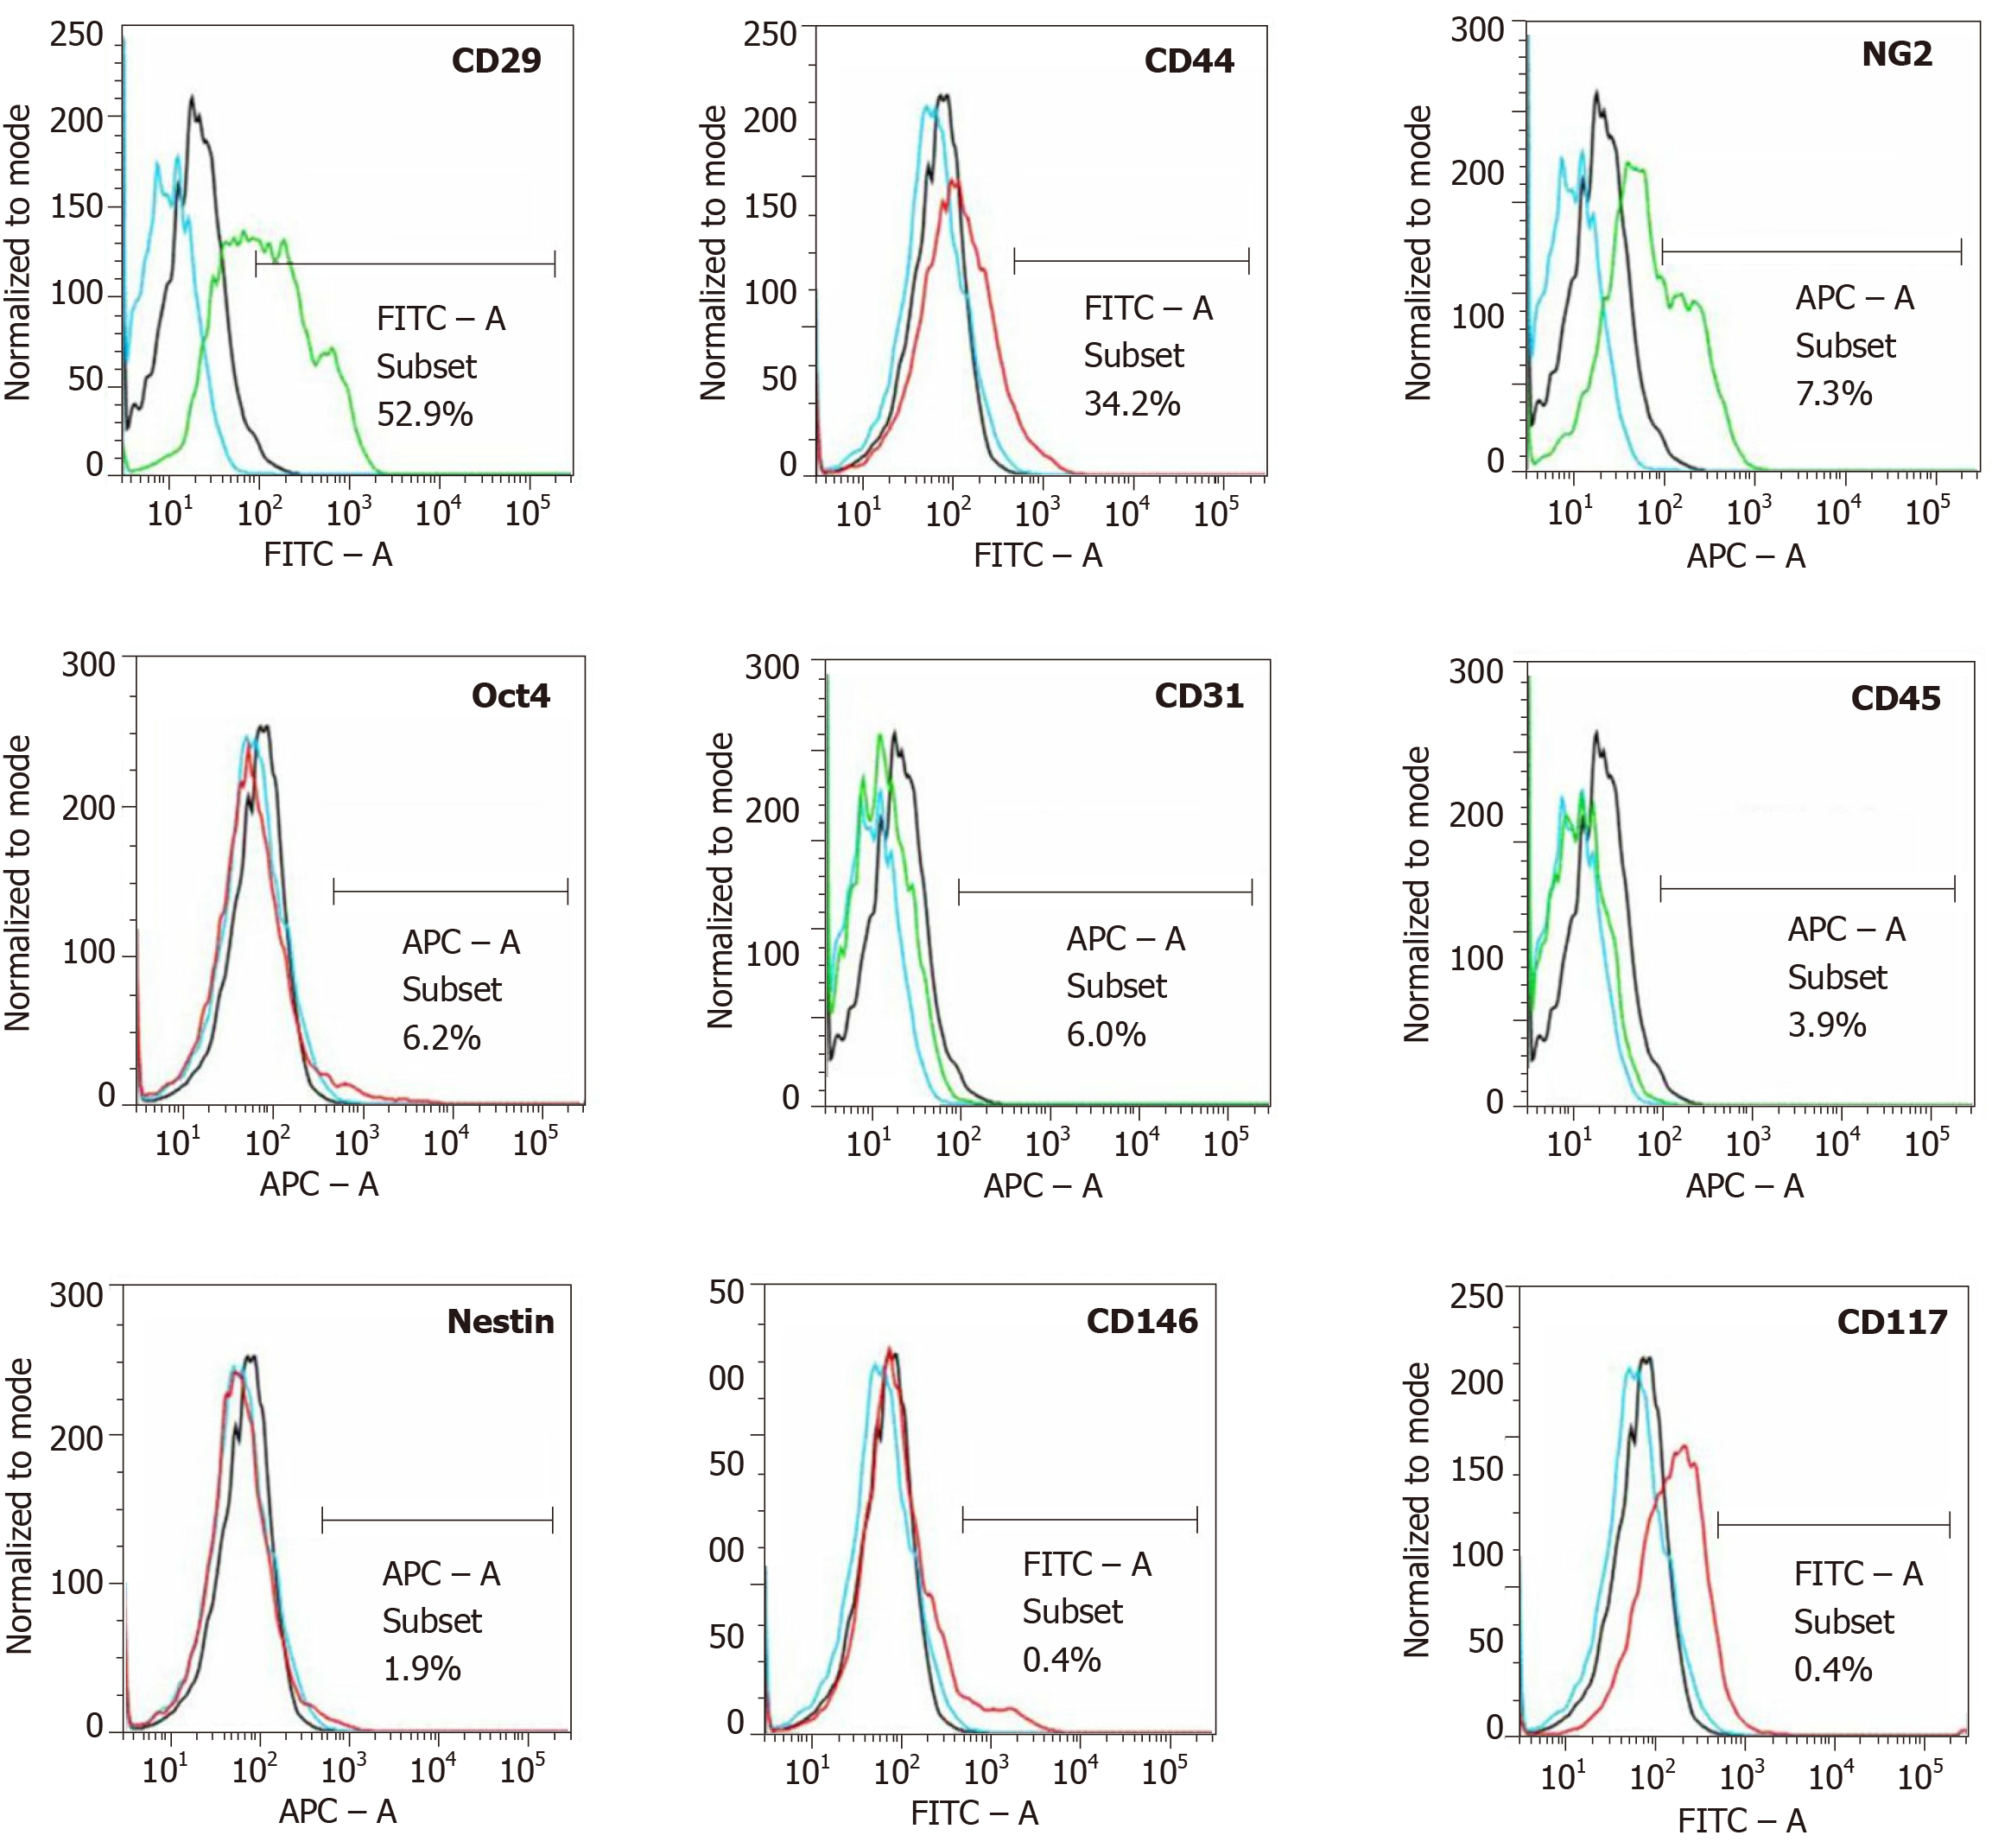
Figure 7 Analysis of cell surface markers of fresh, uncultured, unmodified, autologous adipose-derived regenerative cells from an animal in group 1 using flow cytometry.
The cells were stained with monoclonal antibodies for CD29, CD44, NG2, Oct4, CD31, CD45, Nestin, CD146 and CD117 at passage 0. Flow cytometric histographs are representative of triplicate experiments.
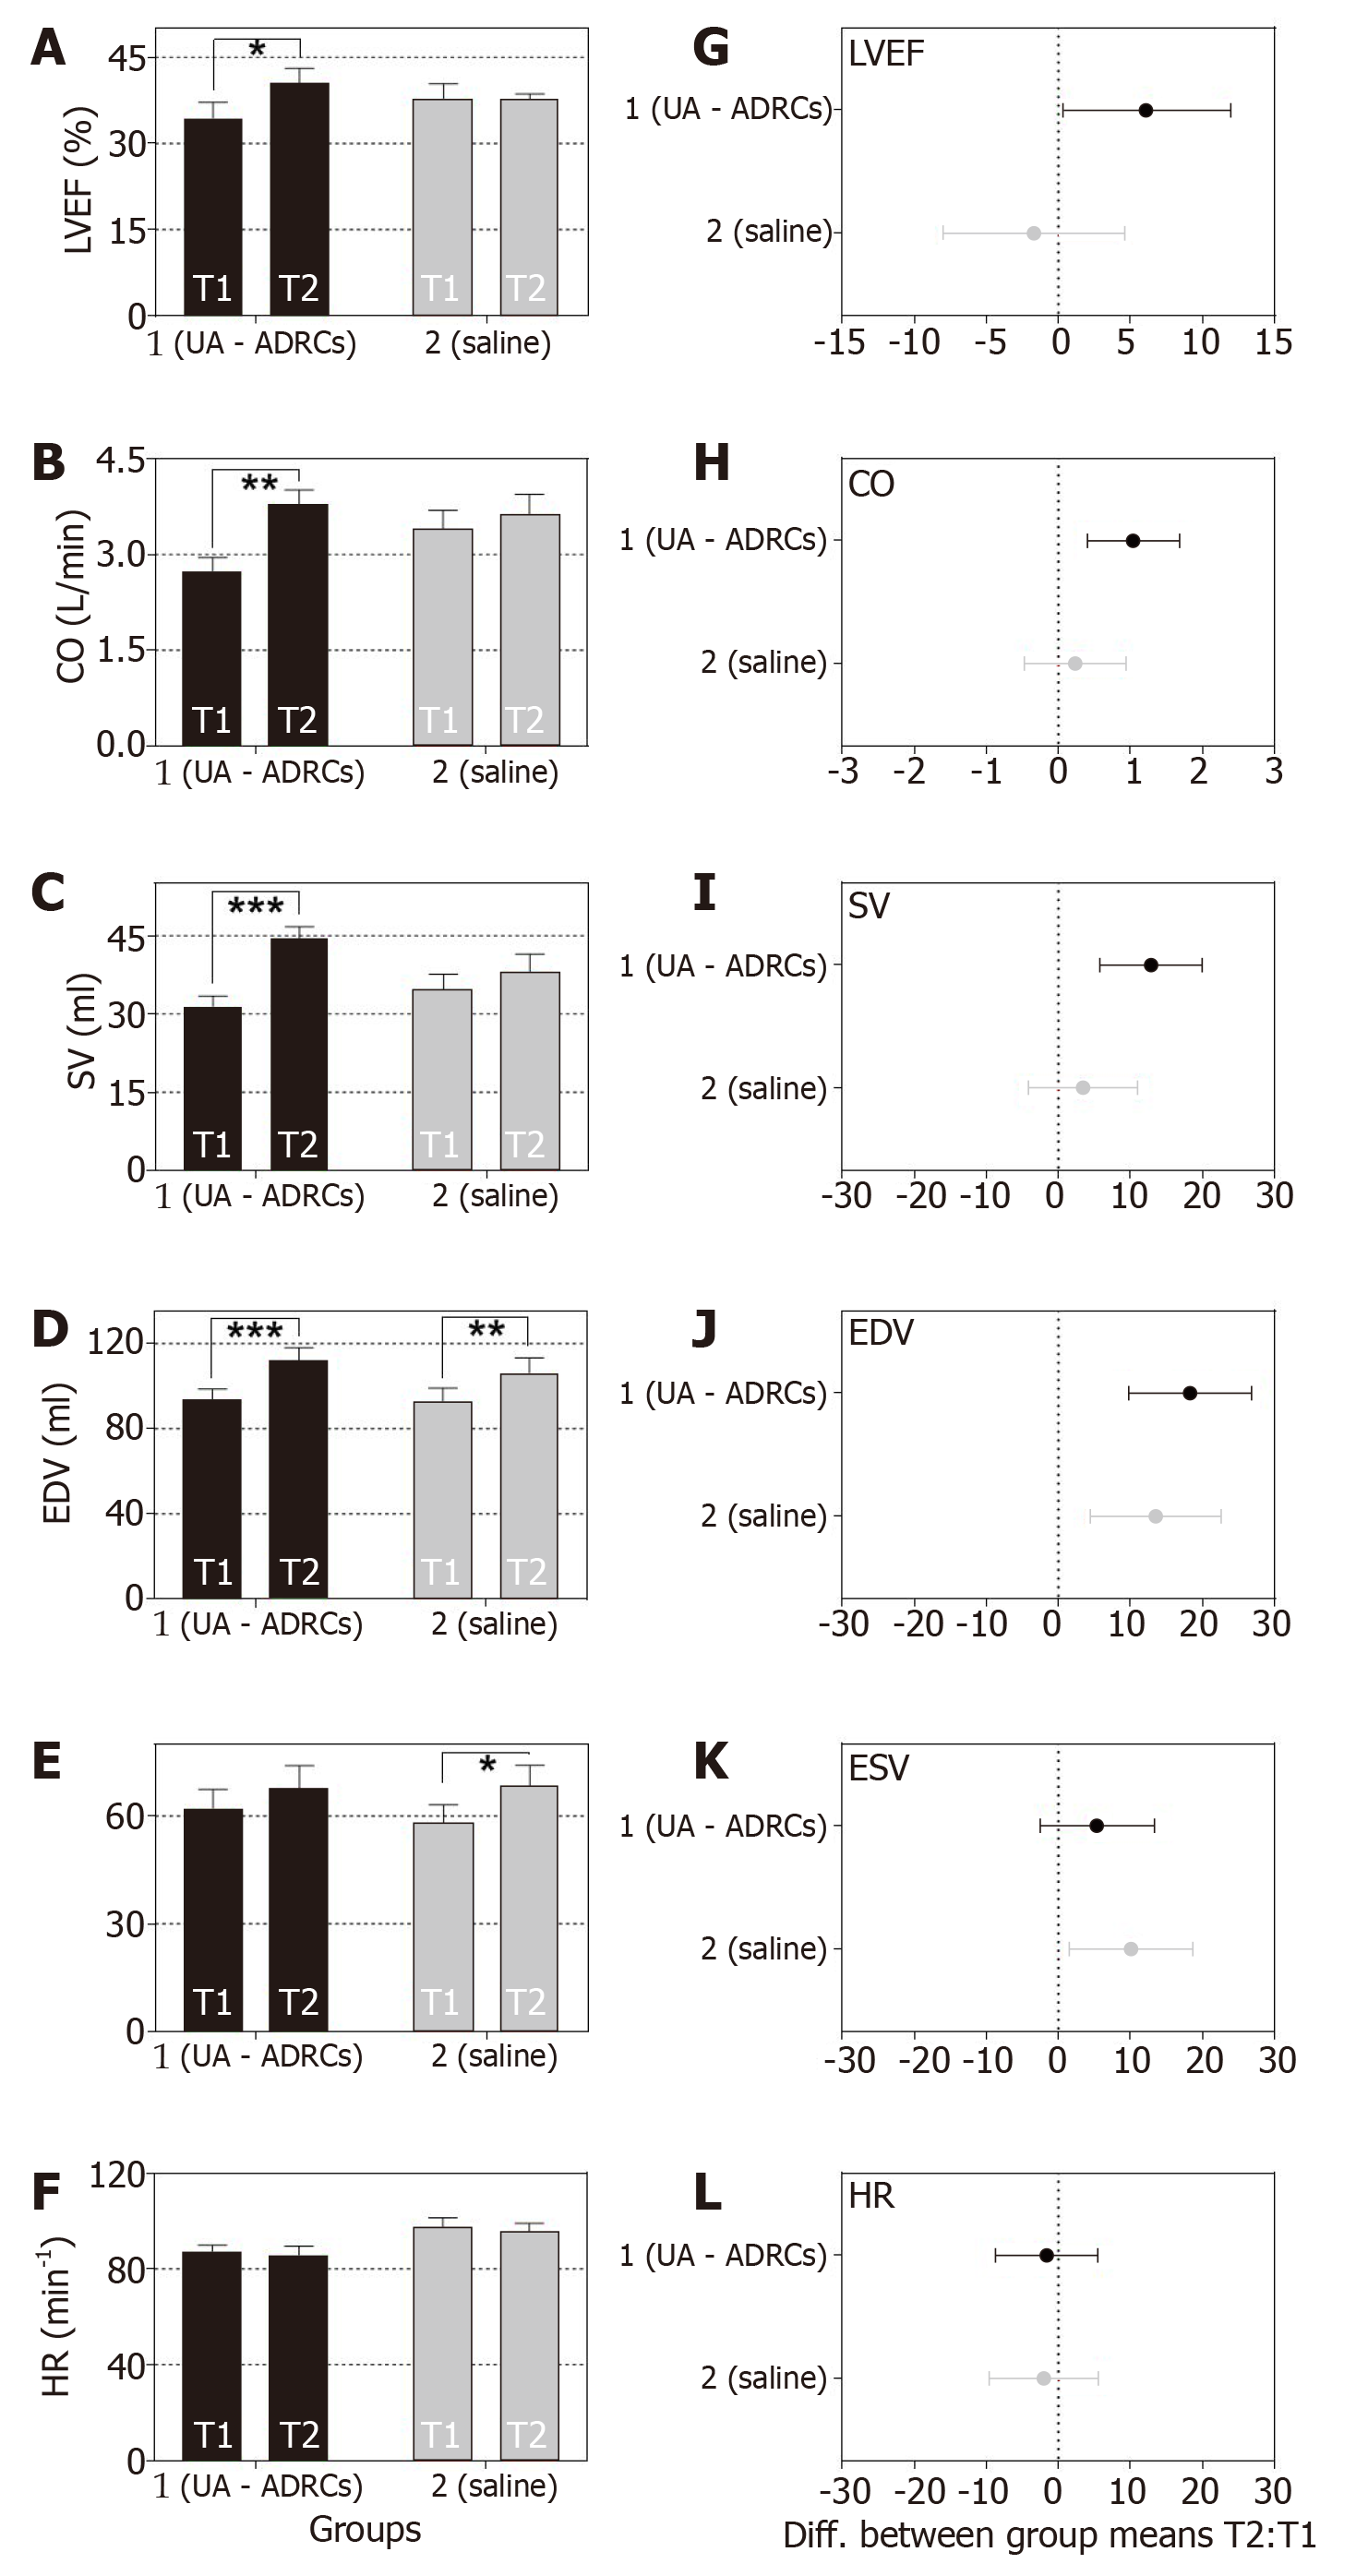
Figure 8 Change in cardiac function after delivery of UA-ADRCs or saline.
The panels show group-specific mean ± SE of (A) left ventricular ejection fraction (LVEF, (B) cardiac output (CO), (C) stroke volume (SV), (D) end-diastolic volume (EDV), (E) end-systolic volume (ESV) and (F) heart rate (HR) of animals in group 1 (delivery of UA-ADRCs) (green bars) and group 2 (delivery of saline as control) (red bars) at 4 wk after infarction (T1) and 6 wk later (T2). P values of repeated measures two-way analysis of variance are provided in Table 1; results of group-specific Bonferroni's multiple comparison tests are indicated (aP < 0.05; bP < 0.01; cP < 0.001). 95% confidence intervals (Bonferroni) of the differences of group-specific mean data between T2 and T1 are shown in (G-L). UA-ADRCs: Fresh, uncultured, unmodified, autologous adipose-derived regenerative cells.
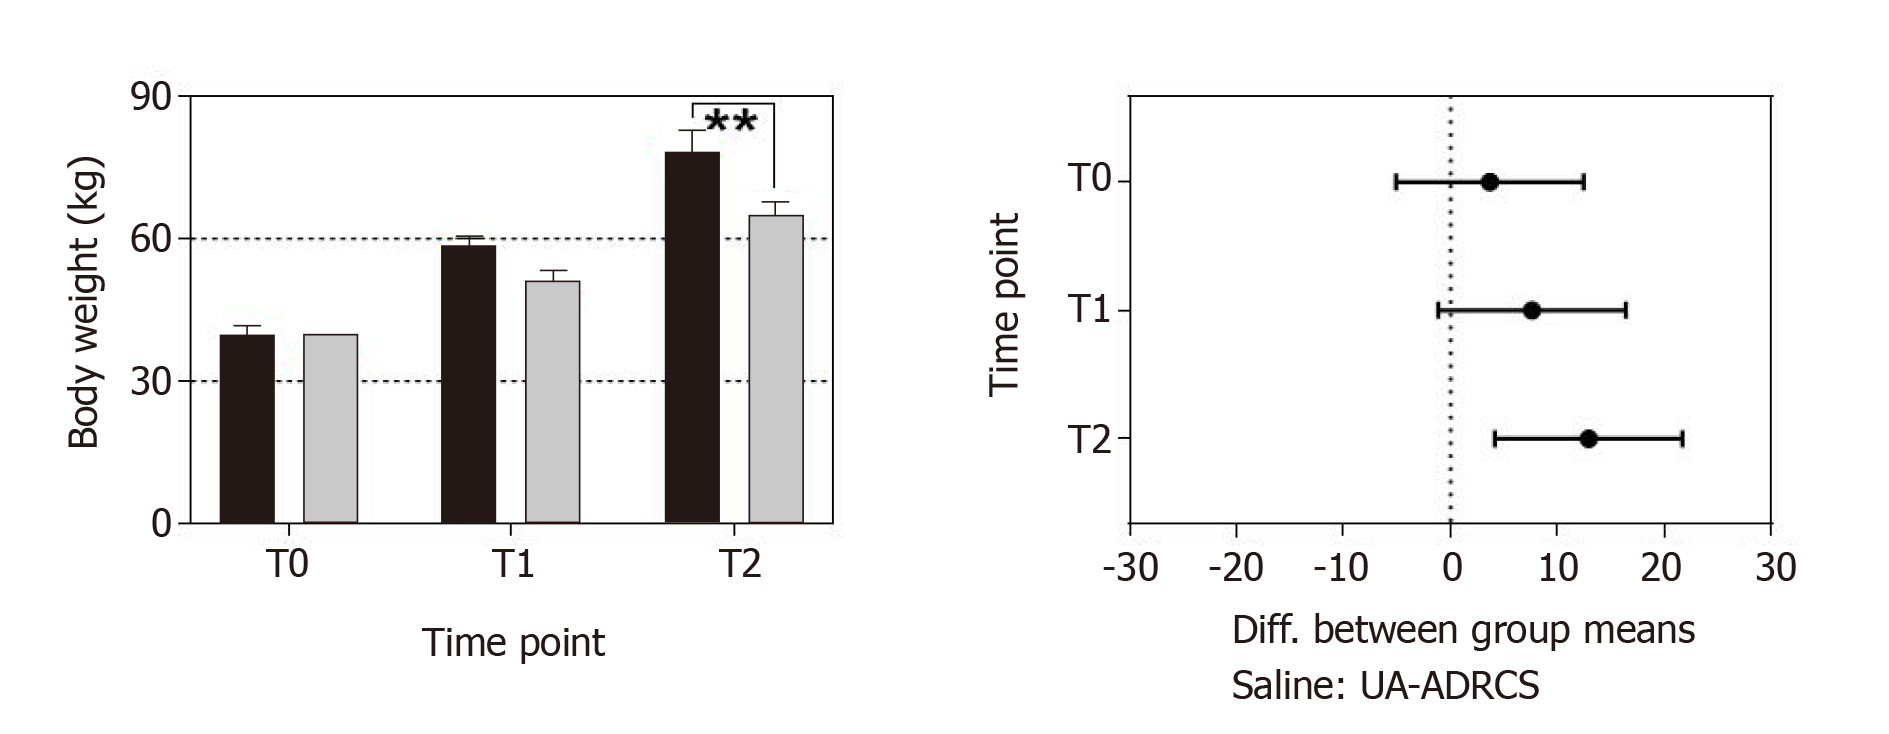
Figure 9 Change in body weight after delivery of UA-ADRCs or saline.
The left panel shows group-specific mean ± SE of the body weight of animals in group 1 (delivery of UA-ADRCs) (green bars) and group 2 (delivery of saline as control) (red bars) at baseline (T0), 4 wk after infarction (T1) and 6 wk later (T2). In both groups, the mean body weight significantly increased during the investigated period (group 1: +48% from T0 to T1 and +97% from T0 to T2; group 2: +42% from T0 to T1 and +81% from T0 to T2; PInteraction = 0.076; PTime < 0.001; PTreatment = 0.009; PSubjects (matching) = 0.007). Post hoc Bonferroni tests for pairwise comparisons demonstrated a significant difference in mean body weight between the groups at T2 (bP < 0.01) but not at T0 or T1. 95% confidence intervals (Bonferroni) of the differences of group-specific mean data are displayed in the right panel. UA-ADRCs: Fresh, uncultured, unmodified, autologous adipose-derived regenerative cells.
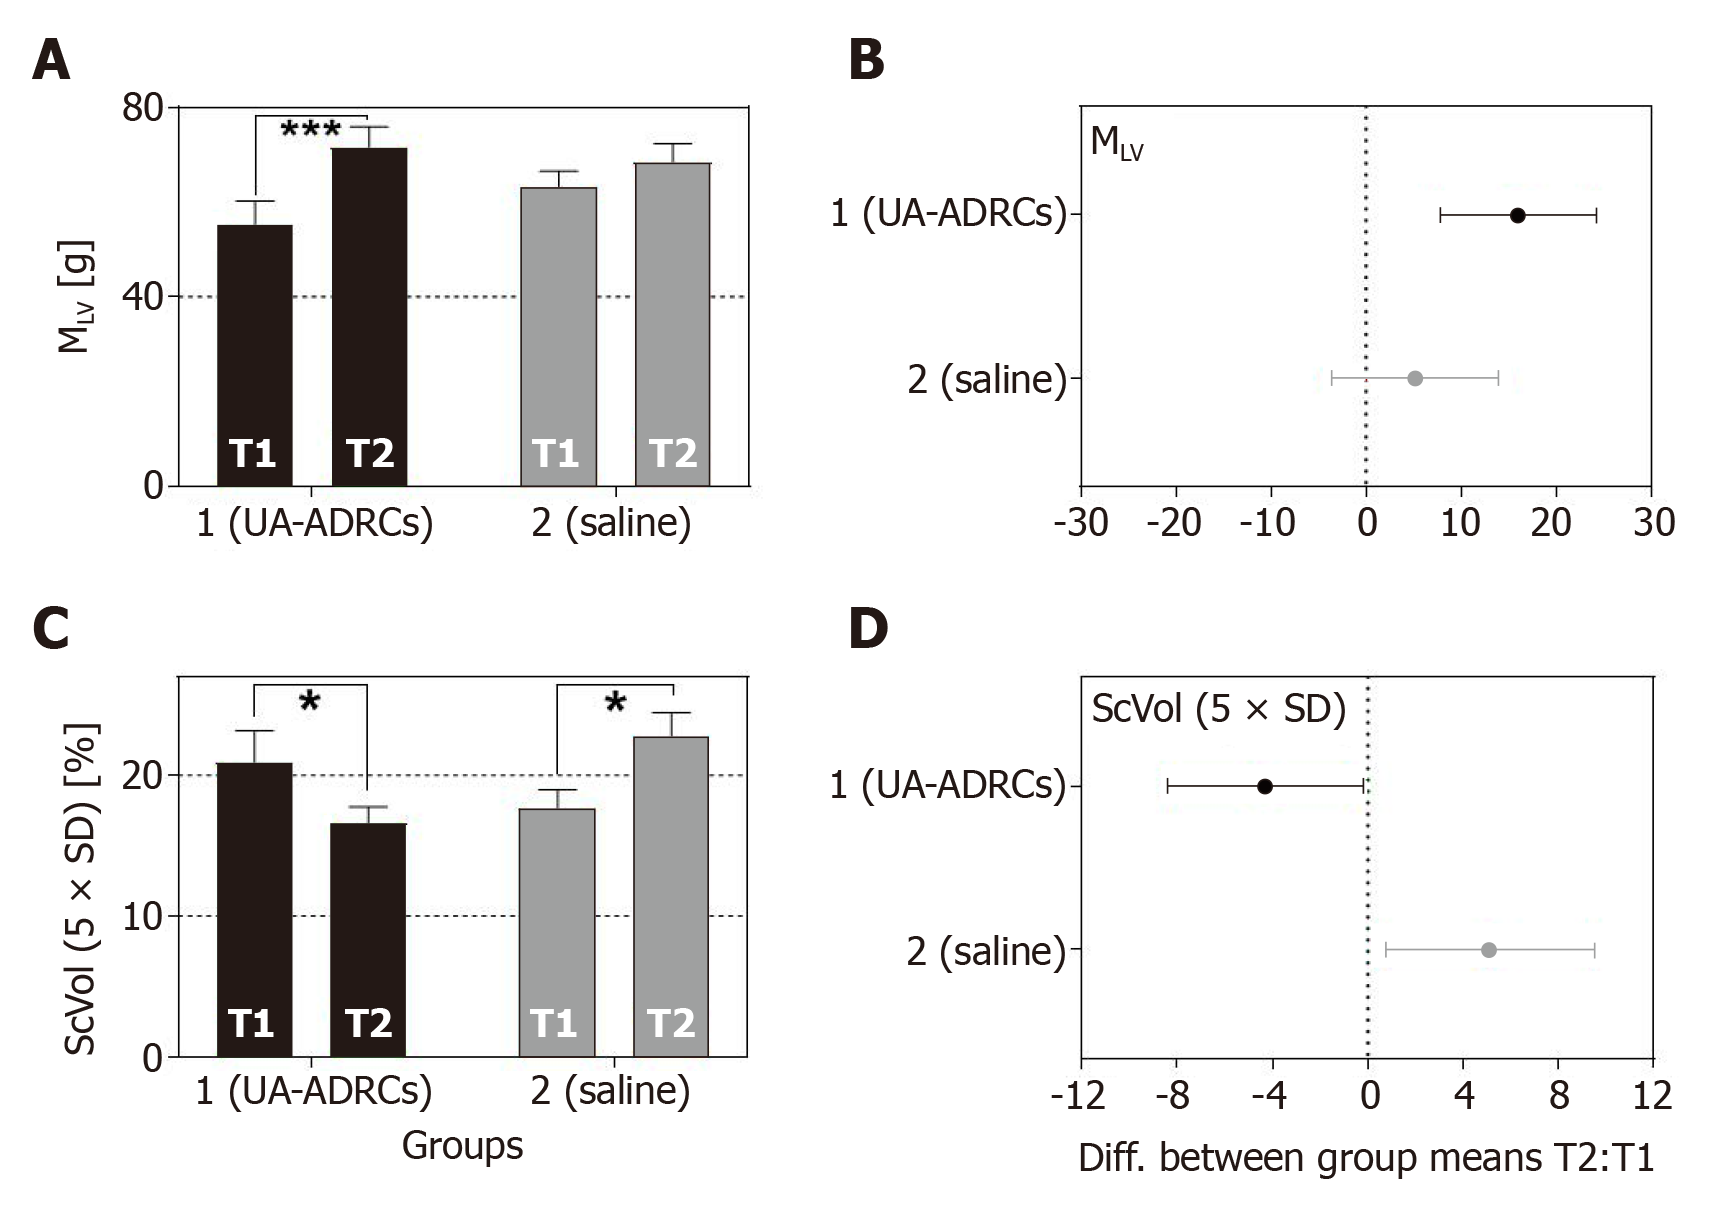
Figure 10 Change in cardiac structure after delivery of UA-ADRCs or saline.
The panels show group-specific mean ± SE of (A) the left ventricular mass (MLV) and (B) the relative amount of scar volume of the left ventricular wall (ScVol) of animals in group 1 (delivery of UA-ADRCs) (green bars) and group 2 (delivery of saline as control) (red bars) at 4 wk after infarction (T1) and 6 wk later (T2). P values of repeated measures two-way analysis of variance are provided in Table 1; results of group-specific Bonferroni's multiple comparison tests are indicated (aP < 0.05; cP < 0.001). 95% confidence intervals (Bonferroni) of the differences of group-specific mean data between T2 and T1 are shown in (C, D). UA-ADRCs: Fresh, uncultured, unmodified, autologous adipose-derived regenerative cells.
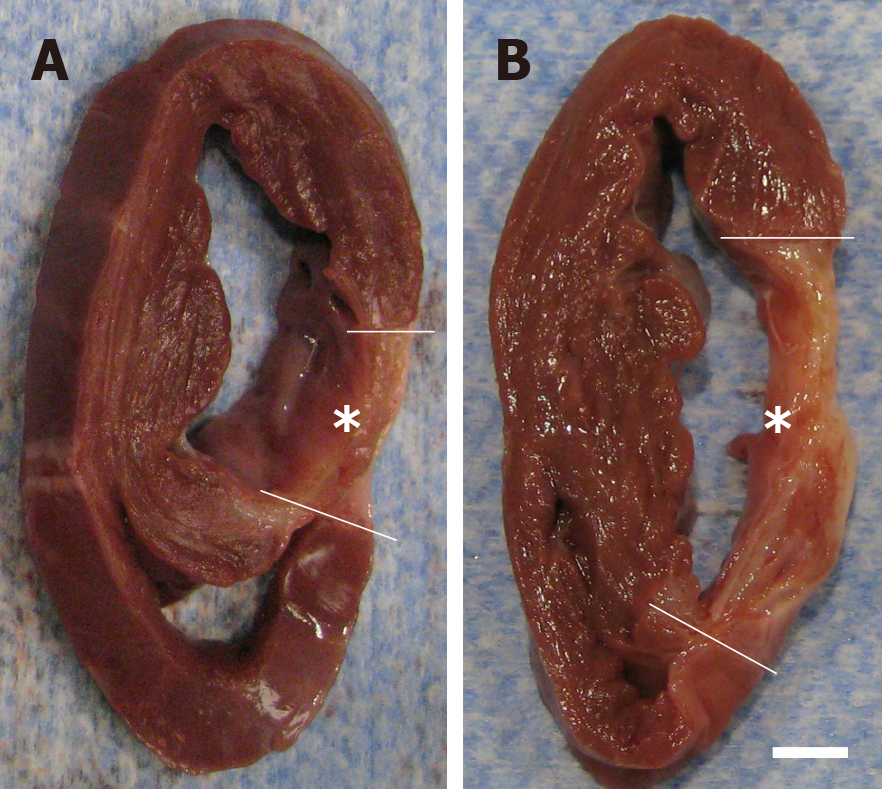
Figure 11 Formation of scar tissue after delivery of UA-ADRCs or saline.
A, B: Representative, transversal, 1 cm-thick slices of post mortem hearts from pigs in group 1 (delivery of fresh, uncultured, unmodified, autologous adipose-derived regenerative cells) (A) and group 2 (delivery of saline as control) (B) at T2. The yellow lines indicate the left ventricular border zones of the myocardial infarction (yellow asterisks). The scale bar represents 1 cm. UA-ADRCs: Fresh, uncultured, unmodified, autologous adipose-derived regenerative cells.
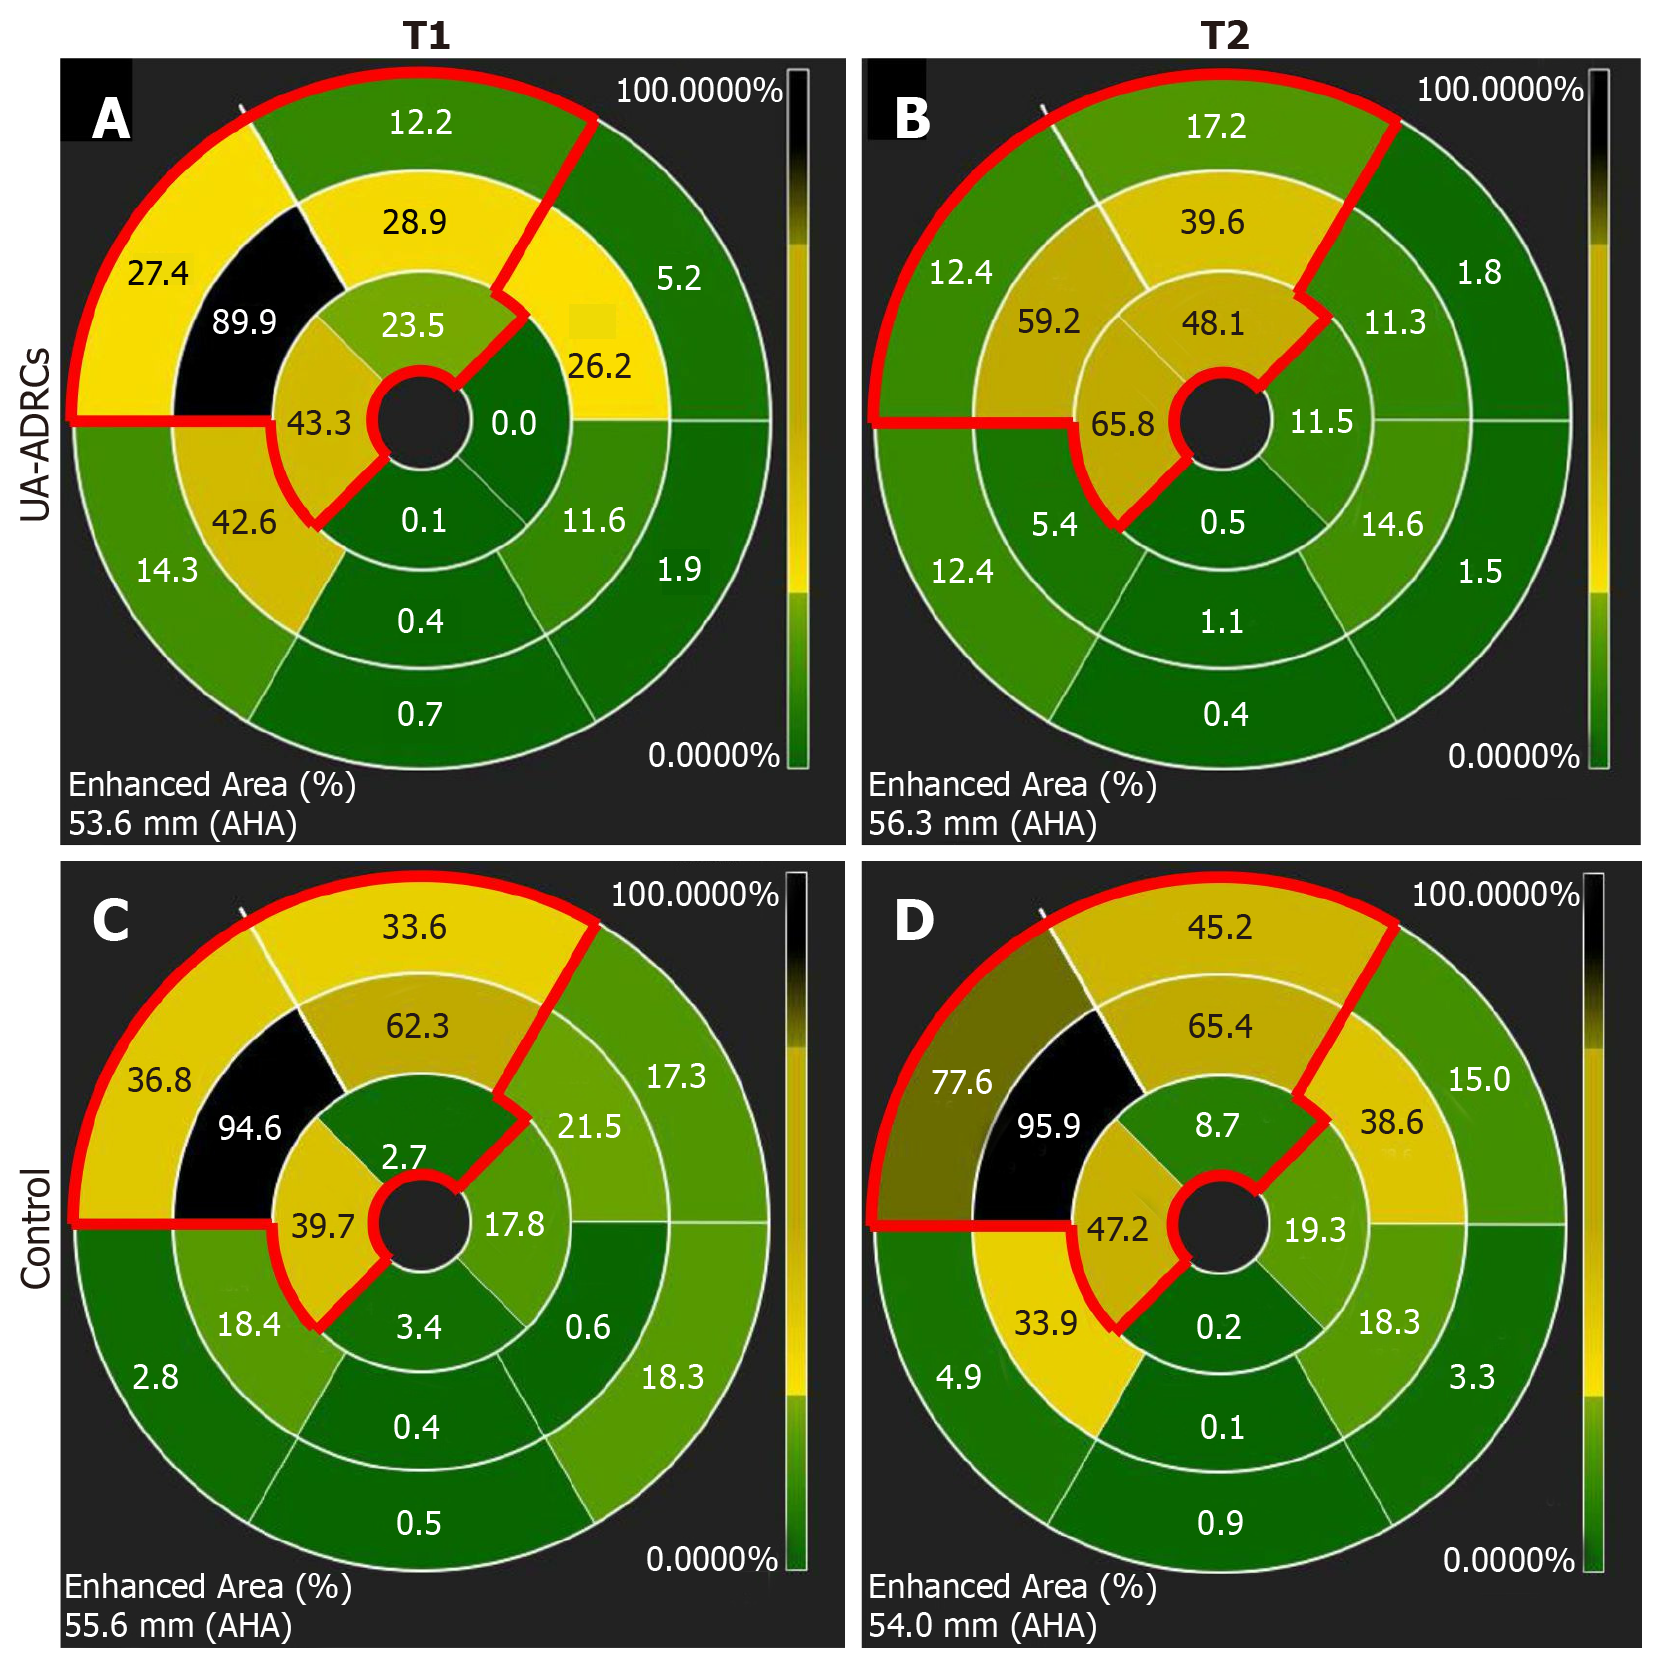
Figure 12 Analysis of regional replacement fibrosis after delivery of UA-ADRCs or saline.
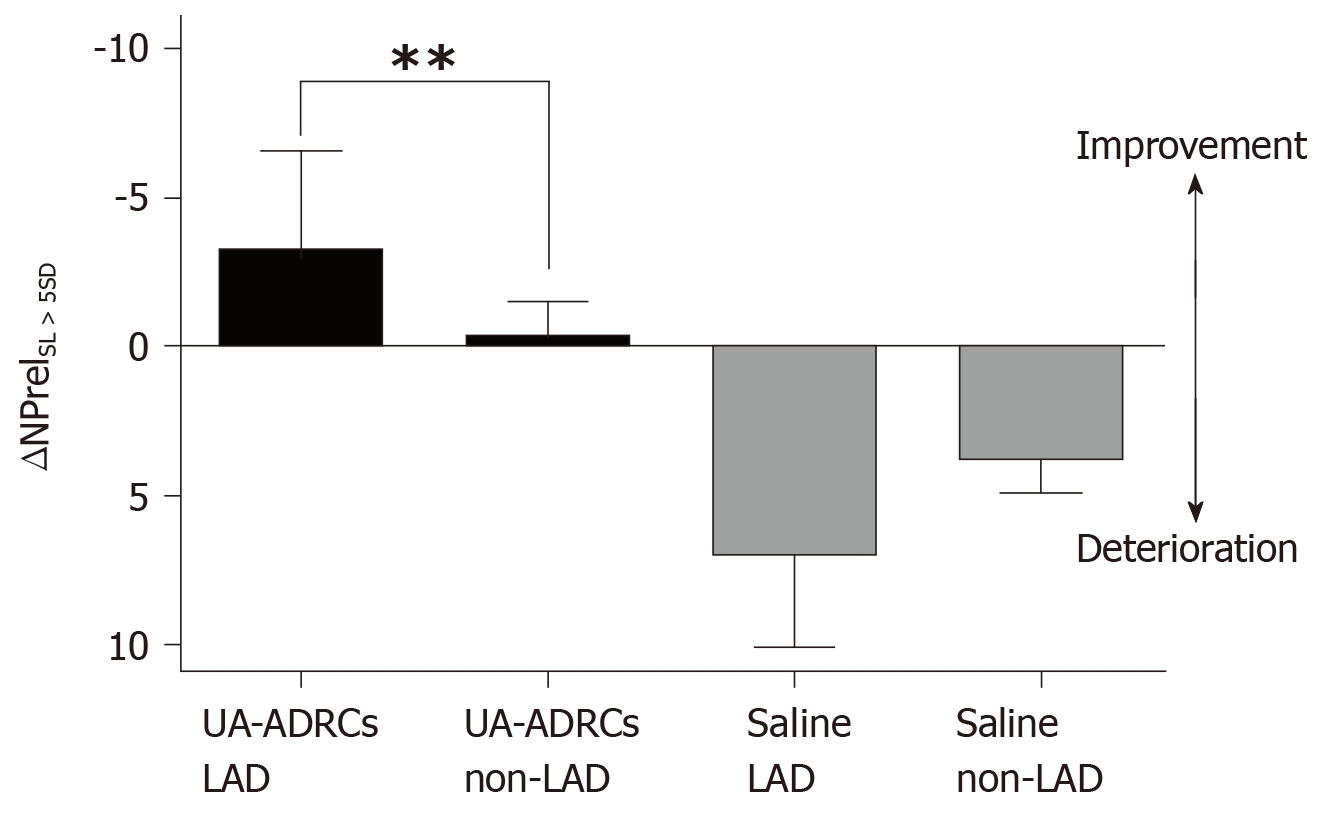
The panels visualize data from a representative animal in group 1 (delivery of UA-ADRCs) (A, B) and a representative animal in group 2 (delivery of saline as control) (C, D) at time points T1 (A, C) and T2 (B, D) using color-coded, AHA 17-segment bullseye plots[35]. Segments marked green showed viable myocardium, whereas segments marked black showed complete fibrosis (i.e. NPrelSI>5SD > 90%; see main text for details). In all panels, the red lines in the upper left parts of the bullseye plots enclose those segments that are assigned to the territory of the left anterior descending artery in the human heart[35]. The asterisks indicate the mid anteroseptal segment #8 that markedly improved between T1 and T2 after delivery of UA-ADRCs (A, B) but not after delivery of saline as control (C, D). UA-ADRCs: Fresh, uncultured, unmodified, autologous adipose-derived regenerative cells.
Figure 13 Improvement or deterioration of regional replacement fibrosis after delivery of UA-ADRCs or saline.
The panel shows mean and standard error of the mean of the results of replacement fibrosis analysis (as explained in detail in the main text) of segments that are assigned to the territory of the left anterior descending artery in the human heart LAD segments; analysis is also shown for segments that are assigned to the territory of the right coronary artery and the left circumflex coronary artery in the human heart (non-LAD segments) of animals in group 1 [delivery of UA-ADRCs) (green boxes) and group 2 (delivery of saline as control) (red boxes). Data above the zero line indicate improvement, and data below the zero line deterioration. Results of Bonferroni's multiple comparison tests are indicated (bP < 0.01). LAD: Left anterior descending; UA-ADRCs: Fresh, uncultured, unmodified, autologous adipose-derived regenerative cells.
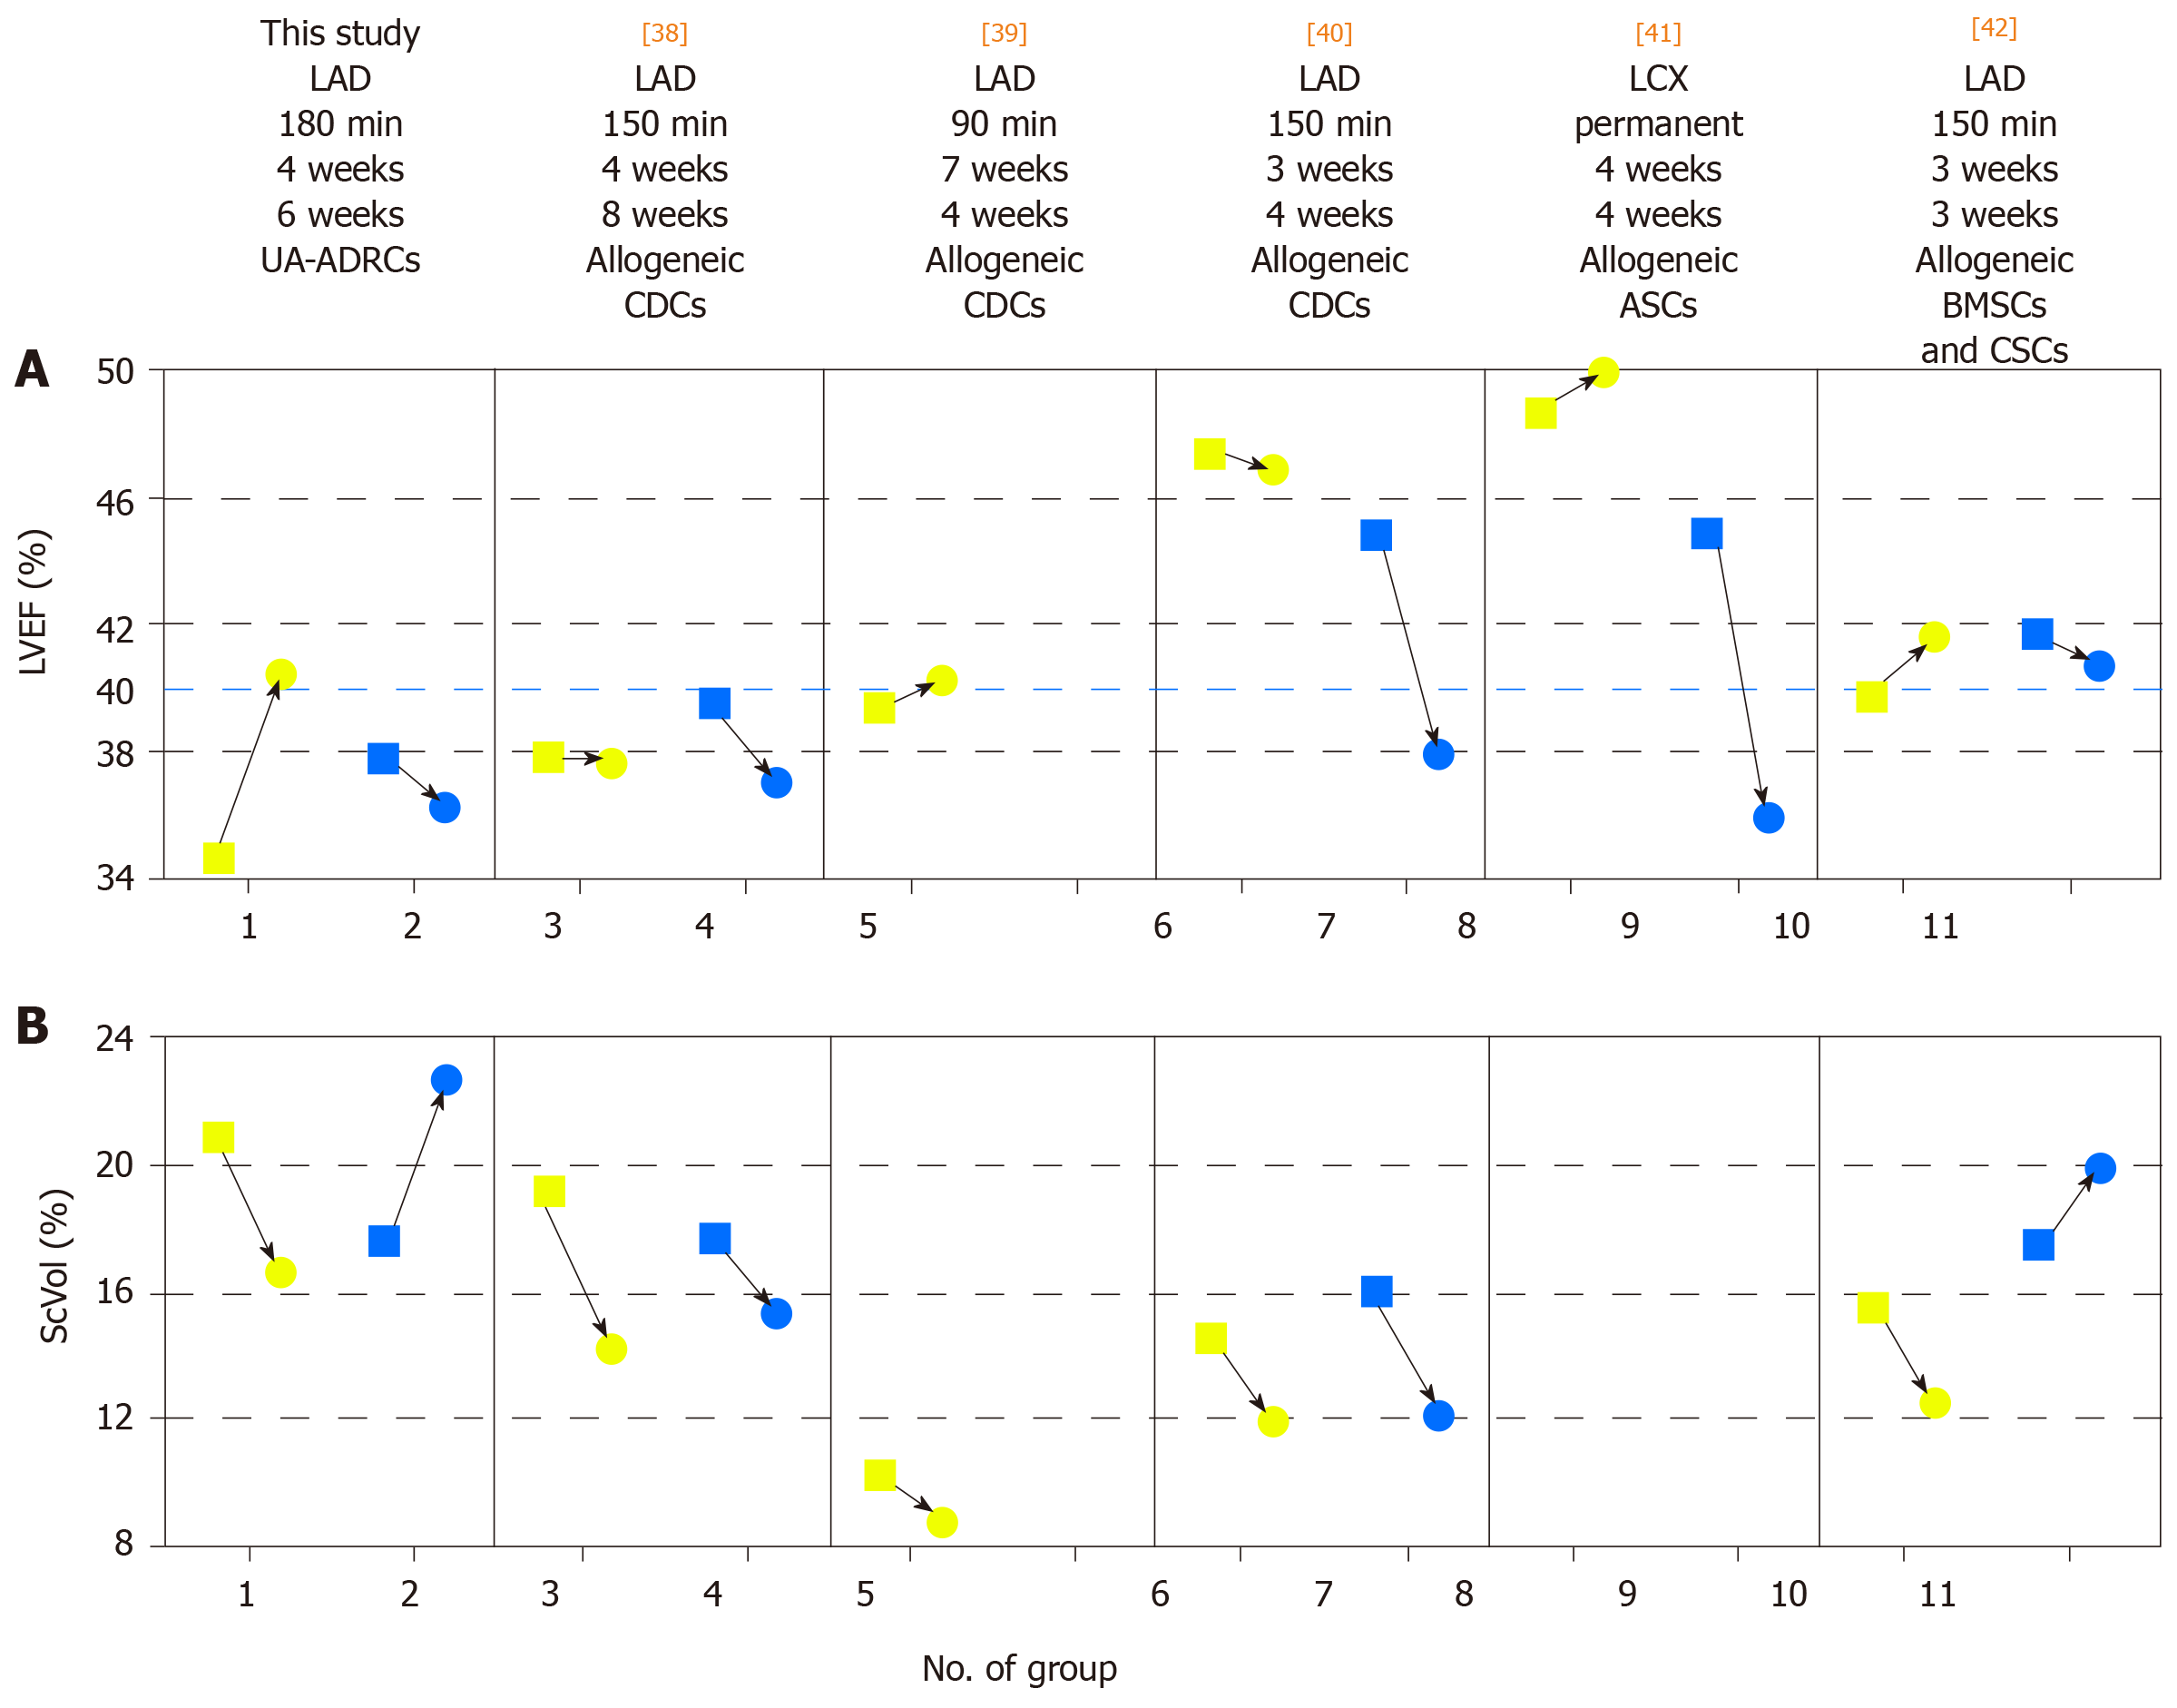
Figure 14 Comparison of studies on cell therapy for chronic MI using porcine models.
A, B: Change in mean left ventricular ejection volume (LVEF) (A) and mean relative amount of scar volume of the left ventricular wall (ScVol) (B) from the time immediately before delivery of cells (yellow squares; groups 1, 3, 5, 6, 8 and 10) or control treatment (blue squares; groups 2. 4. 7, 9 and 11), respectively, to follow-up (yellow and blue dots) in the present study (groups 1 and 2) and in all studies on cell therapy for chronic myocardial infarction (> 4 wk) using porcine models that were published to date (groups 3-11; specified in detail in Table 2; note that no control group was investigated in[39]). If more than one cell therapy was tested in a study (Table 2), the results of the therapy with the most satisfactory outcome are displayed. The information provided on top of Panel A specifies the number of the study in the reference list, the coronary artery that was occluded for experimental MI induction, the duration of occlusion, the interval between experimental MI induction and delivery of cells, and the delivered cell types. The dotted blue line in (A) indicates the border between a moderately reduced LVEF and a reduced LVEF, according to the guidelines for the diagnosis and treatment of acute and chronic heart failure published by the European Society of Cardiology in 2016[36]. MI: Myocardial infarctions; LAD: Left anterior descending artery; LCX: Left circumflex artery; BMSCs: Bone marrow-derived stem cells; CDCs: Cardiosphere-derived stem cells; ASCs: Adipose-derived stem cells; CSCs: Cardiac stem cells; UA-ADRCs: Fresh, uncultured, unmodified autologous adipose-derived regenerative cells.
- Citation: Haenel A, Ghosn M, Karimi T, Vykoukal J, Shah D, Valderrabano M, Schulz DG, Raizner A, Schmitz C, Alt EU. Unmodified autologous stem cells at point of care for chronic myocardial infarction. World J Stem Cells 2019; 11(10): 831-858
- URL: https://www.wjgnet.com/1948-0210/full/v11/i10/831.htm
- DOI: https://dx.doi.org/10.4252/wjsc.v11.i10.831


