Copyright
©The Author(s) 2019.
World J Stem Cells. Oct 26, 2019; 11(10): 831-858
Published online Oct 26, 2019. doi: 10.4252/wjsc.v11.i10.831
Published online Oct 26, 2019. doi: 10.4252/wjsc.v11.i10.831
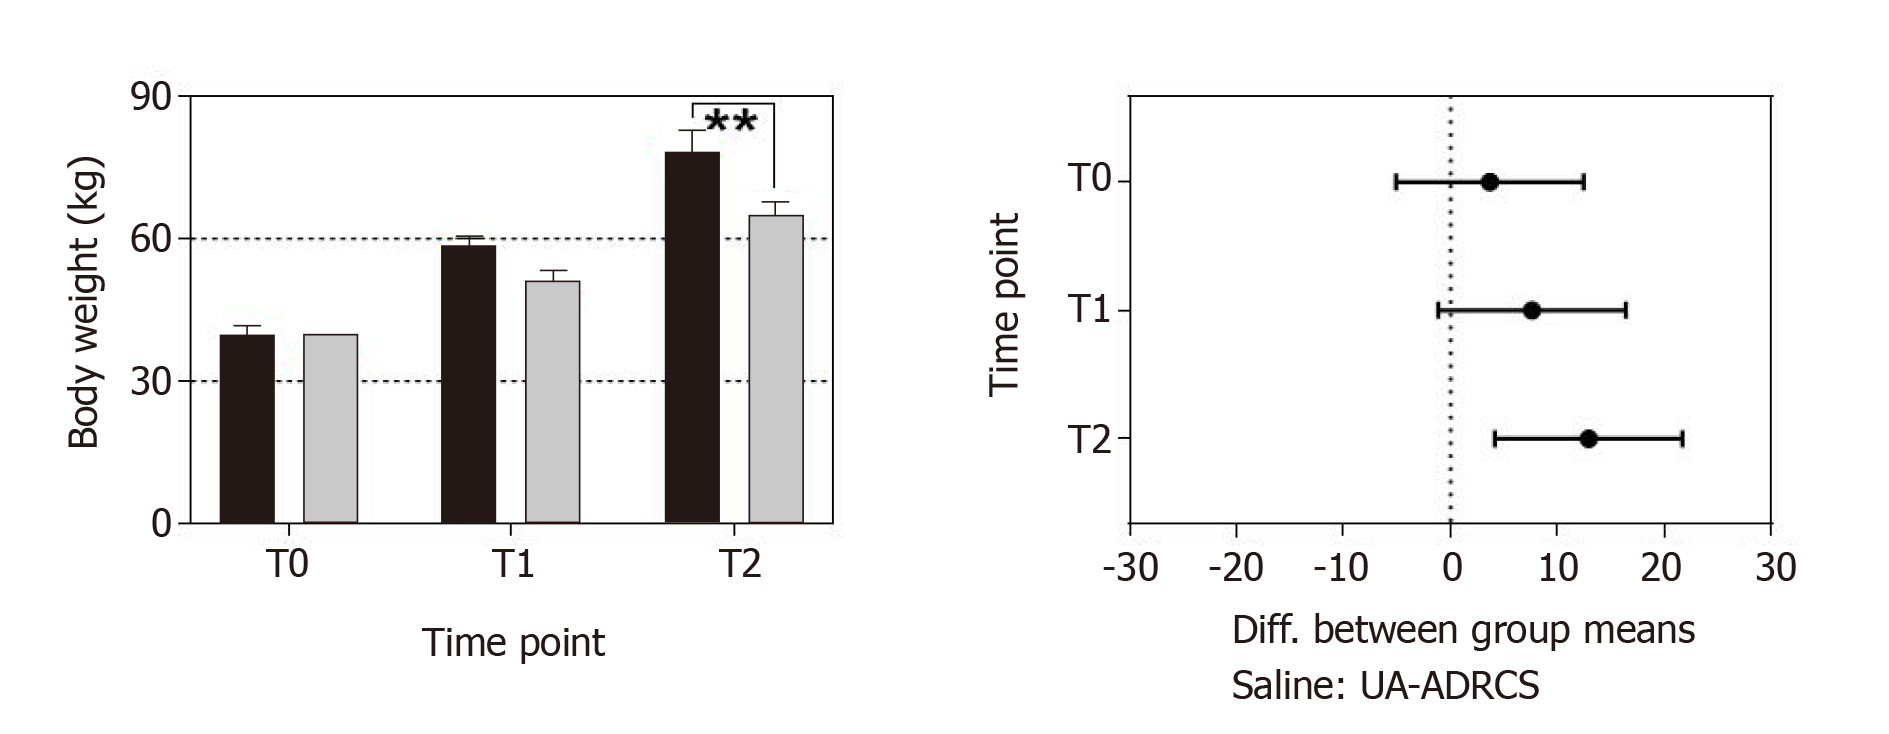
Figure 9 Change in body weight after delivery of UA-ADRCs or saline.
The left panel shows group-specific mean ± SE of the body weight of animals in group 1 (delivery of UA-ADRCs) (green bars) and group 2 (delivery of saline as control) (red bars) at baseline (T0), 4 wk after infarction (T1) and 6 wk later (T2). In both groups, the mean body weight significantly increased during the investigated period (group 1: +48% from T0 to T1 and +97% from T0 to T2; group 2: +42% from T0 to T1 and +81% from T0 to T2; PInteraction = 0.076; PTime < 0.001; PTreatment = 0.009; PSubjects (matching) = 0.007). Post hoc Bonferroni tests for pairwise comparisons demonstrated a significant difference in mean body weight between the groups at T2 (bP < 0.01) but not at T0 or T1. 95% confidence intervals (Bonferroni) of the differences of group-specific mean data are displayed in the right panel. UA-ADRCs: Fresh, uncultured, unmodified, autologous adipose-derived regenerative cells.
- Citation: Haenel A, Ghosn M, Karimi T, Vykoukal J, Shah D, Valderrabano M, Schulz DG, Raizner A, Schmitz C, Alt EU. Unmodified autologous stem cells at point of care for chronic myocardial infarction. World J Stem Cells 2019; 11(10): 831-858
- URL: https://www.wjgnet.com/1948-0210/full/v11/i10/831.htm
- DOI: https://dx.doi.org/10.4252/wjsc.v11.i10.831


