Copyright
©The Author(s) 2019.
World J Stem Cells. Oct 26, 2019; 11(10): 831-858
Published online Oct 26, 2019. doi: 10.4252/wjsc.v11.i10.831
Published online Oct 26, 2019. doi: 10.4252/wjsc.v11.i10.831
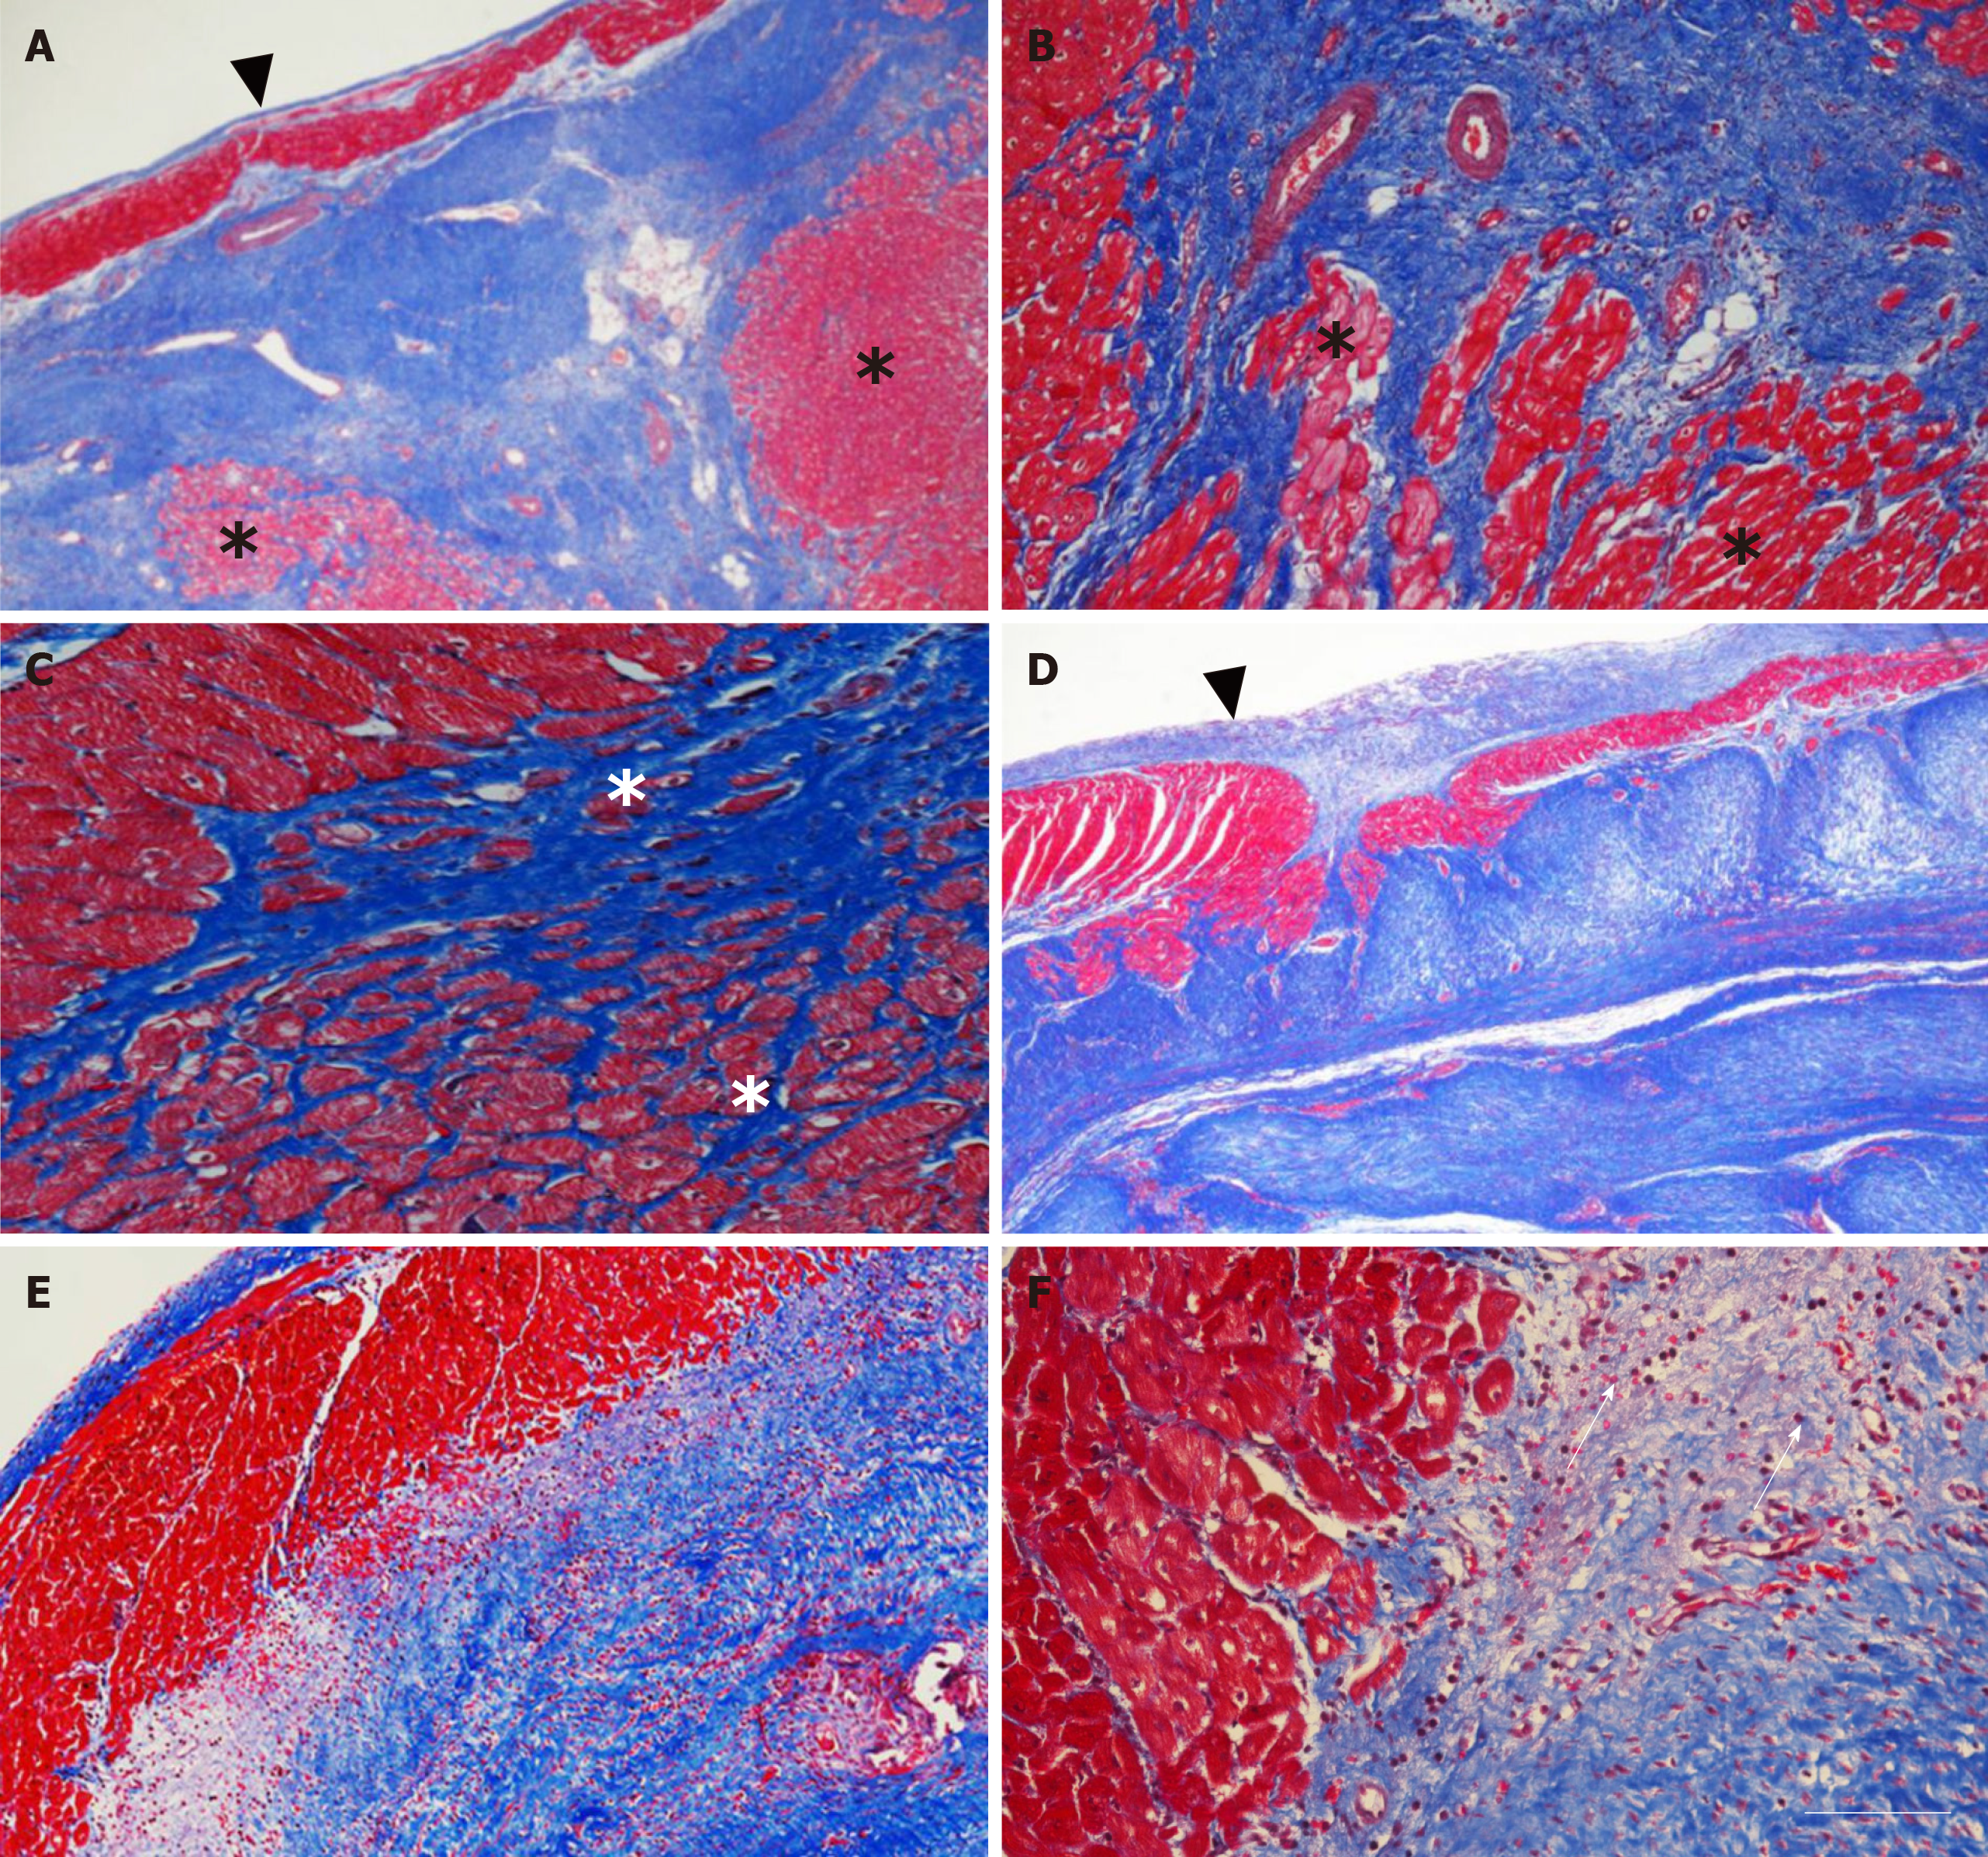
Figure 4 Microstructure of cardiac tissue after delivery of UA-ADRCs or saline.
A-F: Representative photomicrographs of paraffin-embedded, 5 µm thick tissue sections stained with Masson’s Trichrome staining of post mortem hearts from pigs in group 1 (delivery of fresh, uncultured, unmodified, autologous adipose-derived regenerative cells) (A-C) and group 2 (delivery of saline as control) (D-F) at T2. The arrowheads in (A, D) point to the endocardium, the asterisks in (A-C) indicate patchy islets of cardiomyocytes located within areas of fibrous tissue, and the arrows in (F) point to an infiltration with inflammatory cells. The scale bar in (F) represents 500 µm in (A, D), 200 µm in (B, E), and 100 µm in (C, F). UA-ADRCs: Fresh, uncultured, unmodified, autologous adipose-derived regenerative cells.
- Citation: Haenel A, Ghosn M, Karimi T, Vykoukal J, Shah D, Valderrabano M, Schulz DG, Raizner A, Schmitz C, Alt EU. Unmodified autologous stem cells at point of care for chronic myocardial infarction. World J Stem Cells 2019; 11(10): 831-858
- URL: https://www.wjgnet.com/1948-0210/full/v11/i10/831.htm
- DOI: https://dx.doi.org/10.4252/wjsc.v11.i10.831


