Copyright
©The Author(s) 2019.
World J Stem Cells. Oct 26, 2019; 11(10): 831-858
Published online Oct 26, 2019. doi: 10.4252/wjsc.v11.i10.831
Published online Oct 26, 2019. doi: 10.4252/wjsc.v11.i10.831
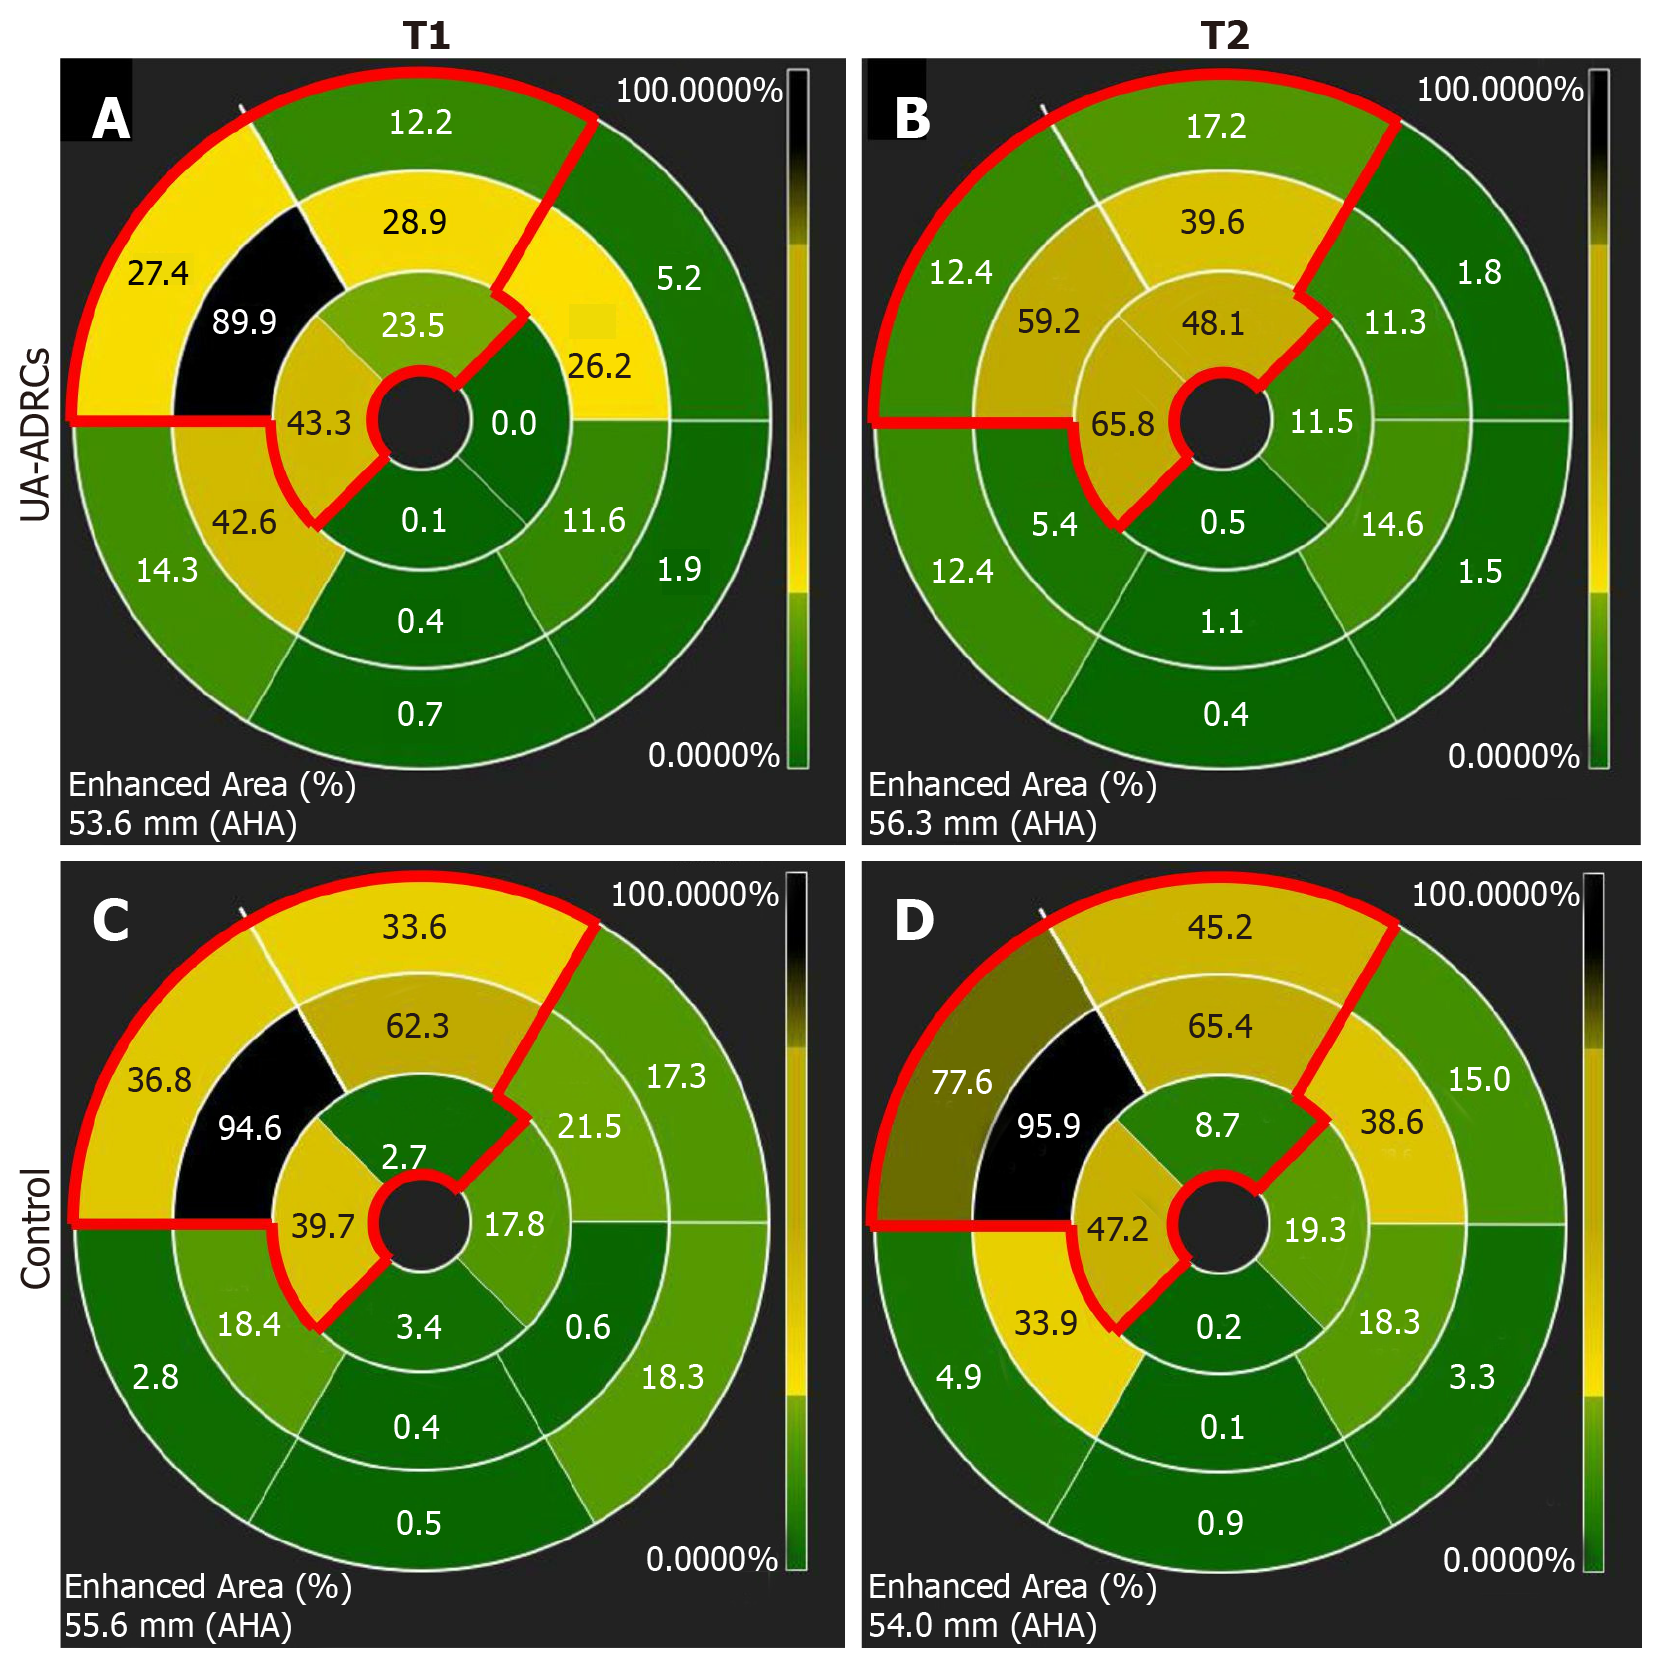
Figure 12 Analysis of regional replacement fibrosis after delivery of UA-ADRCs or saline.
The panels visualize data from a representative animal in group 1 (delivery of UA-ADRCs) (A, B) and a representative animal in group 2 (delivery of saline as control) (C, D) at time points T1 (A, C) and T2 (B, D) using color-coded, AHA 17-segment bullseye plots[35]. Segments marked green showed viable myocardium, whereas segments marked black showed complete fibrosis (i.e. NPrelSI>5SD > 90%; see main text for details). In all panels, the red lines in the upper left parts of the bullseye plots enclose those segments that are assigned to the territory of the left anterior descending artery in the human heart[35]. The asterisks indicate the mid anteroseptal segment #8 that markedly improved between T1 and T2 after delivery of UA-ADRCs (A, B) but not after delivery of saline as control (C, D). UA-ADRCs: Fresh, uncultured, unmodified, autologous adipose-derived regenerative cells.
- Citation: Haenel A, Ghosn M, Karimi T, Vykoukal J, Shah D, Valderrabano M, Schulz DG, Raizner A, Schmitz C, Alt EU. Unmodified autologous stem cells at point of care for chronic myocardial infarction. World J Stem Cells 2019; 11(10): 831-858
- URL: https://www.wjgnet.com/1948-0210/full/v11/i10/831.htm
- DOI: https://dx.doi.org/10.4252/wjsc.v11.i10.831


