
















Copyright: ©Author(s) 2027.
World J Gastroenterol. Jan 7, 2027; 33(1): 123358
Published online Jan 7, 2027. doi: 10.3748/wjg.123358
Published online Jan 7, 2027. doi: 10.3748/wjg.123358
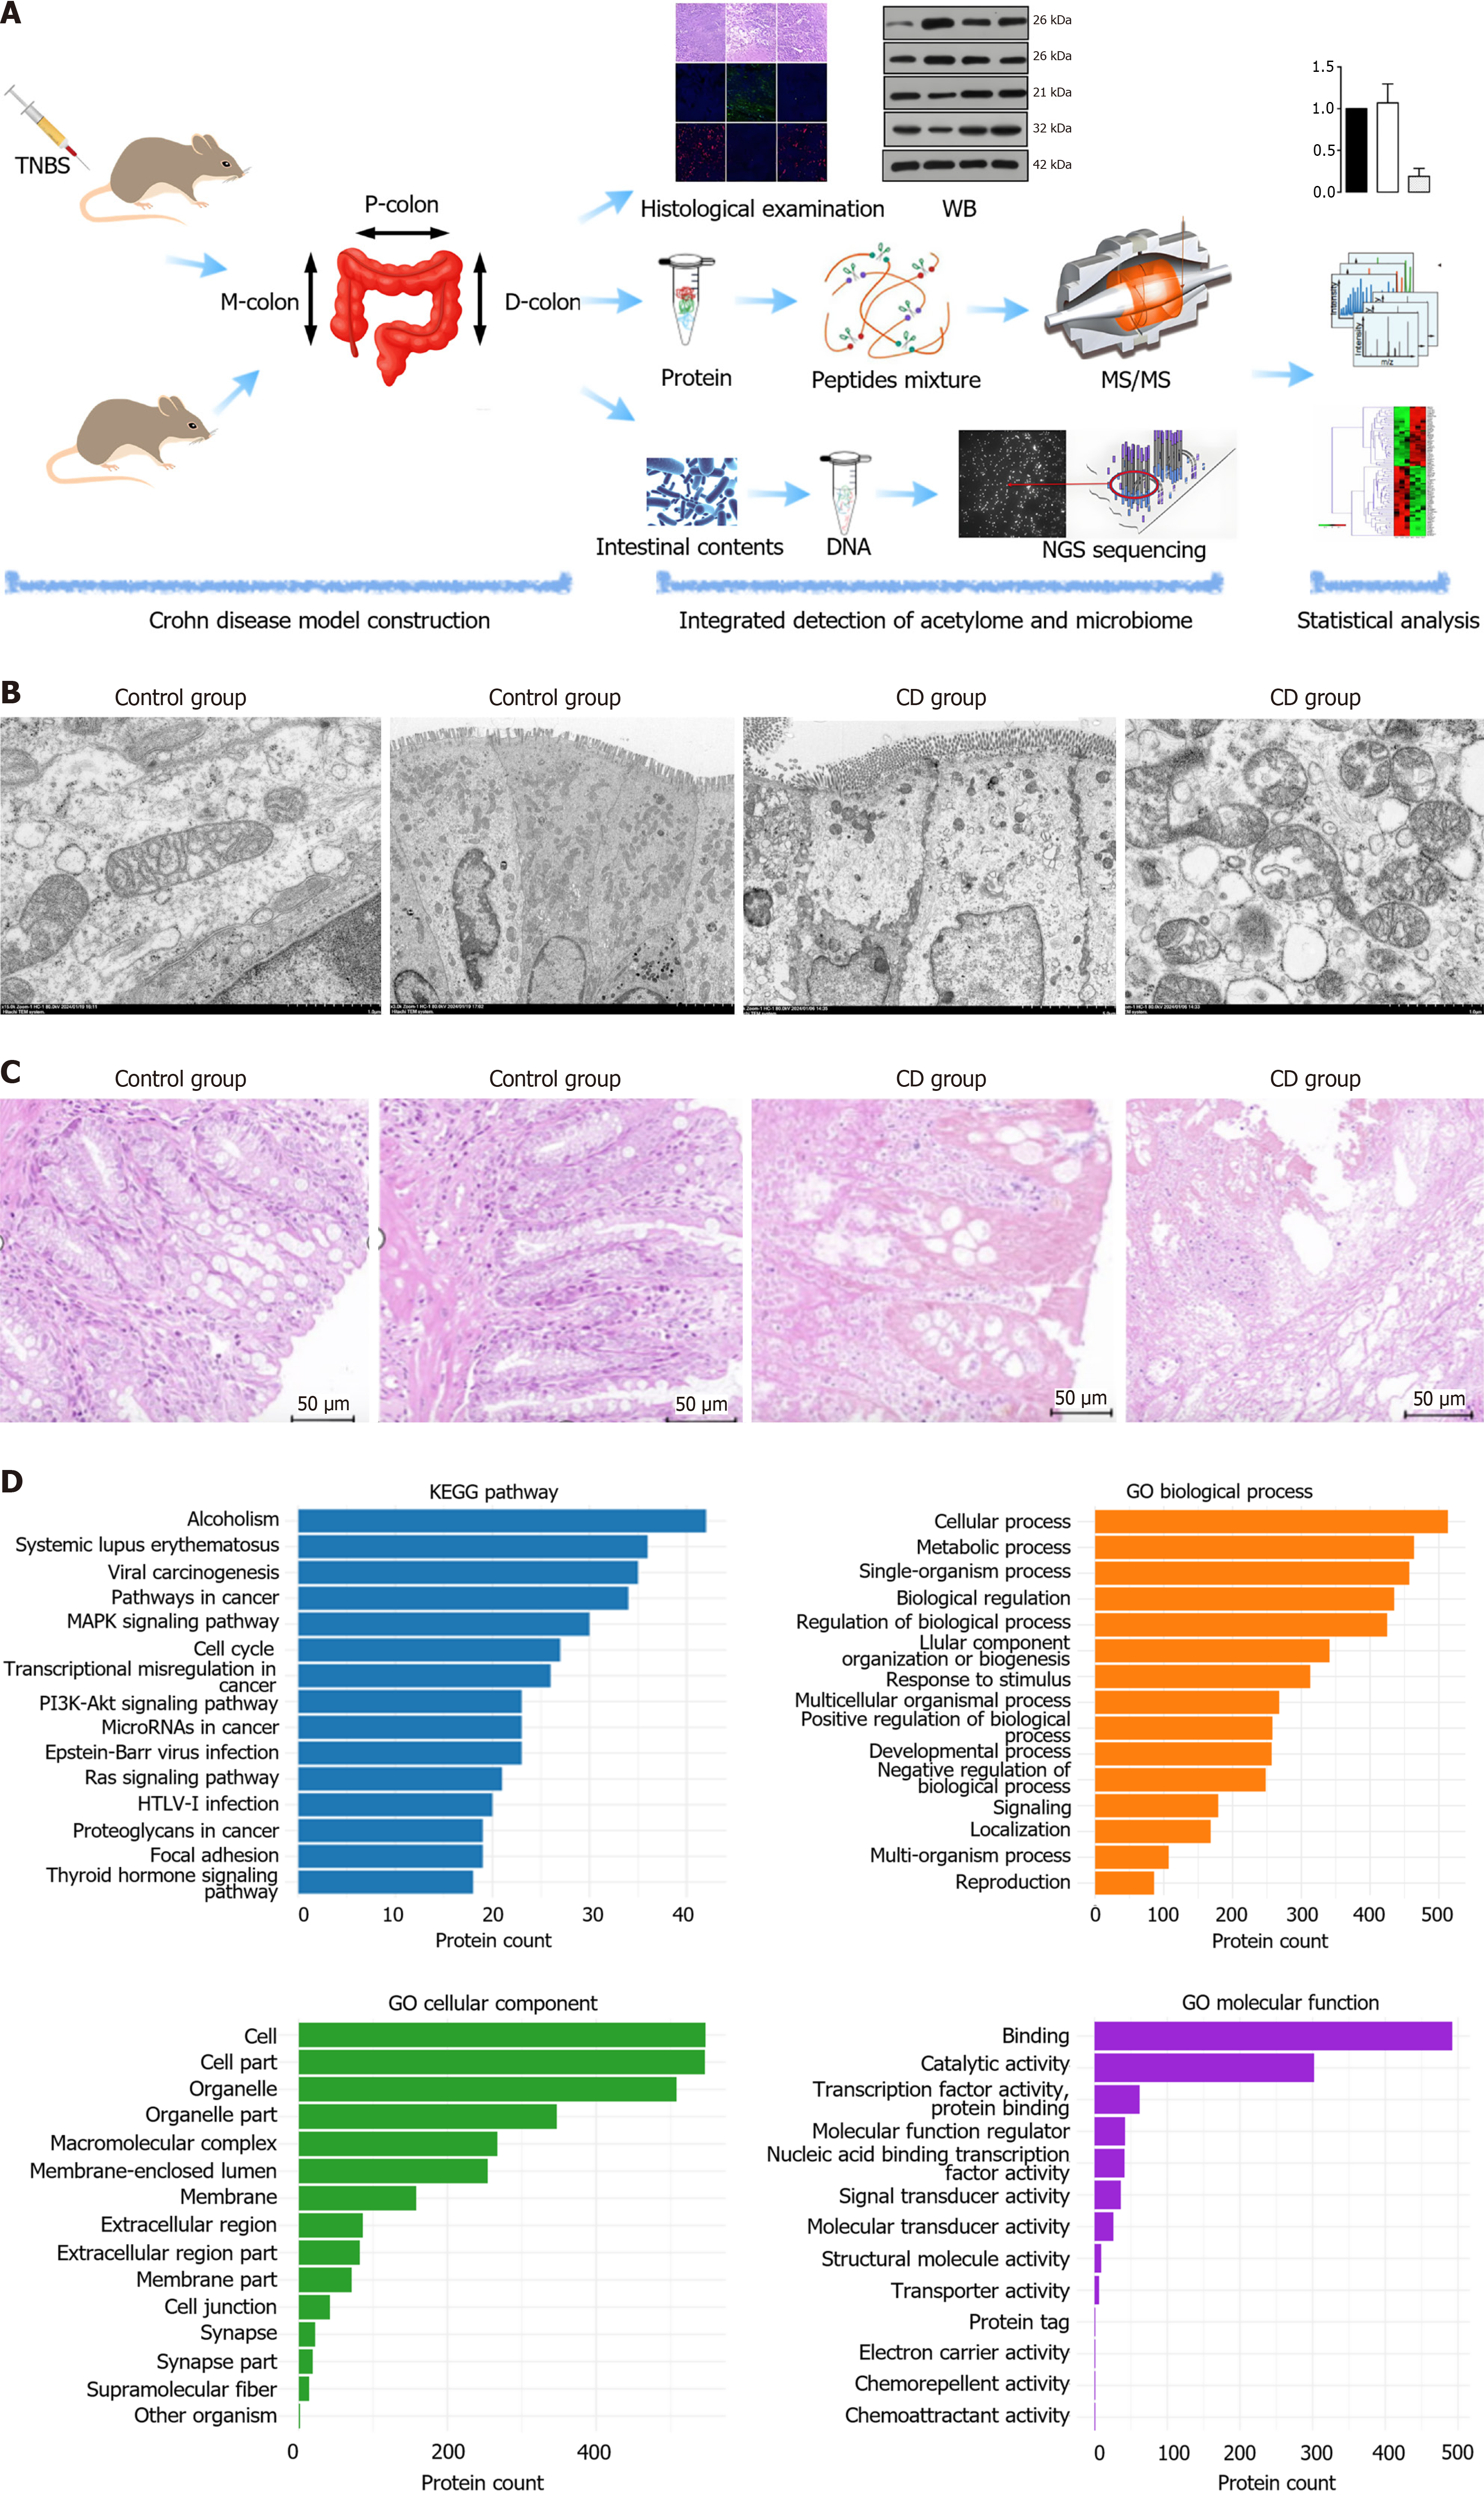
Figure 1 Experimental workflow and characterization of the colonic acetylome.
A: Schematic workflow of the study, including colonic tissue seg
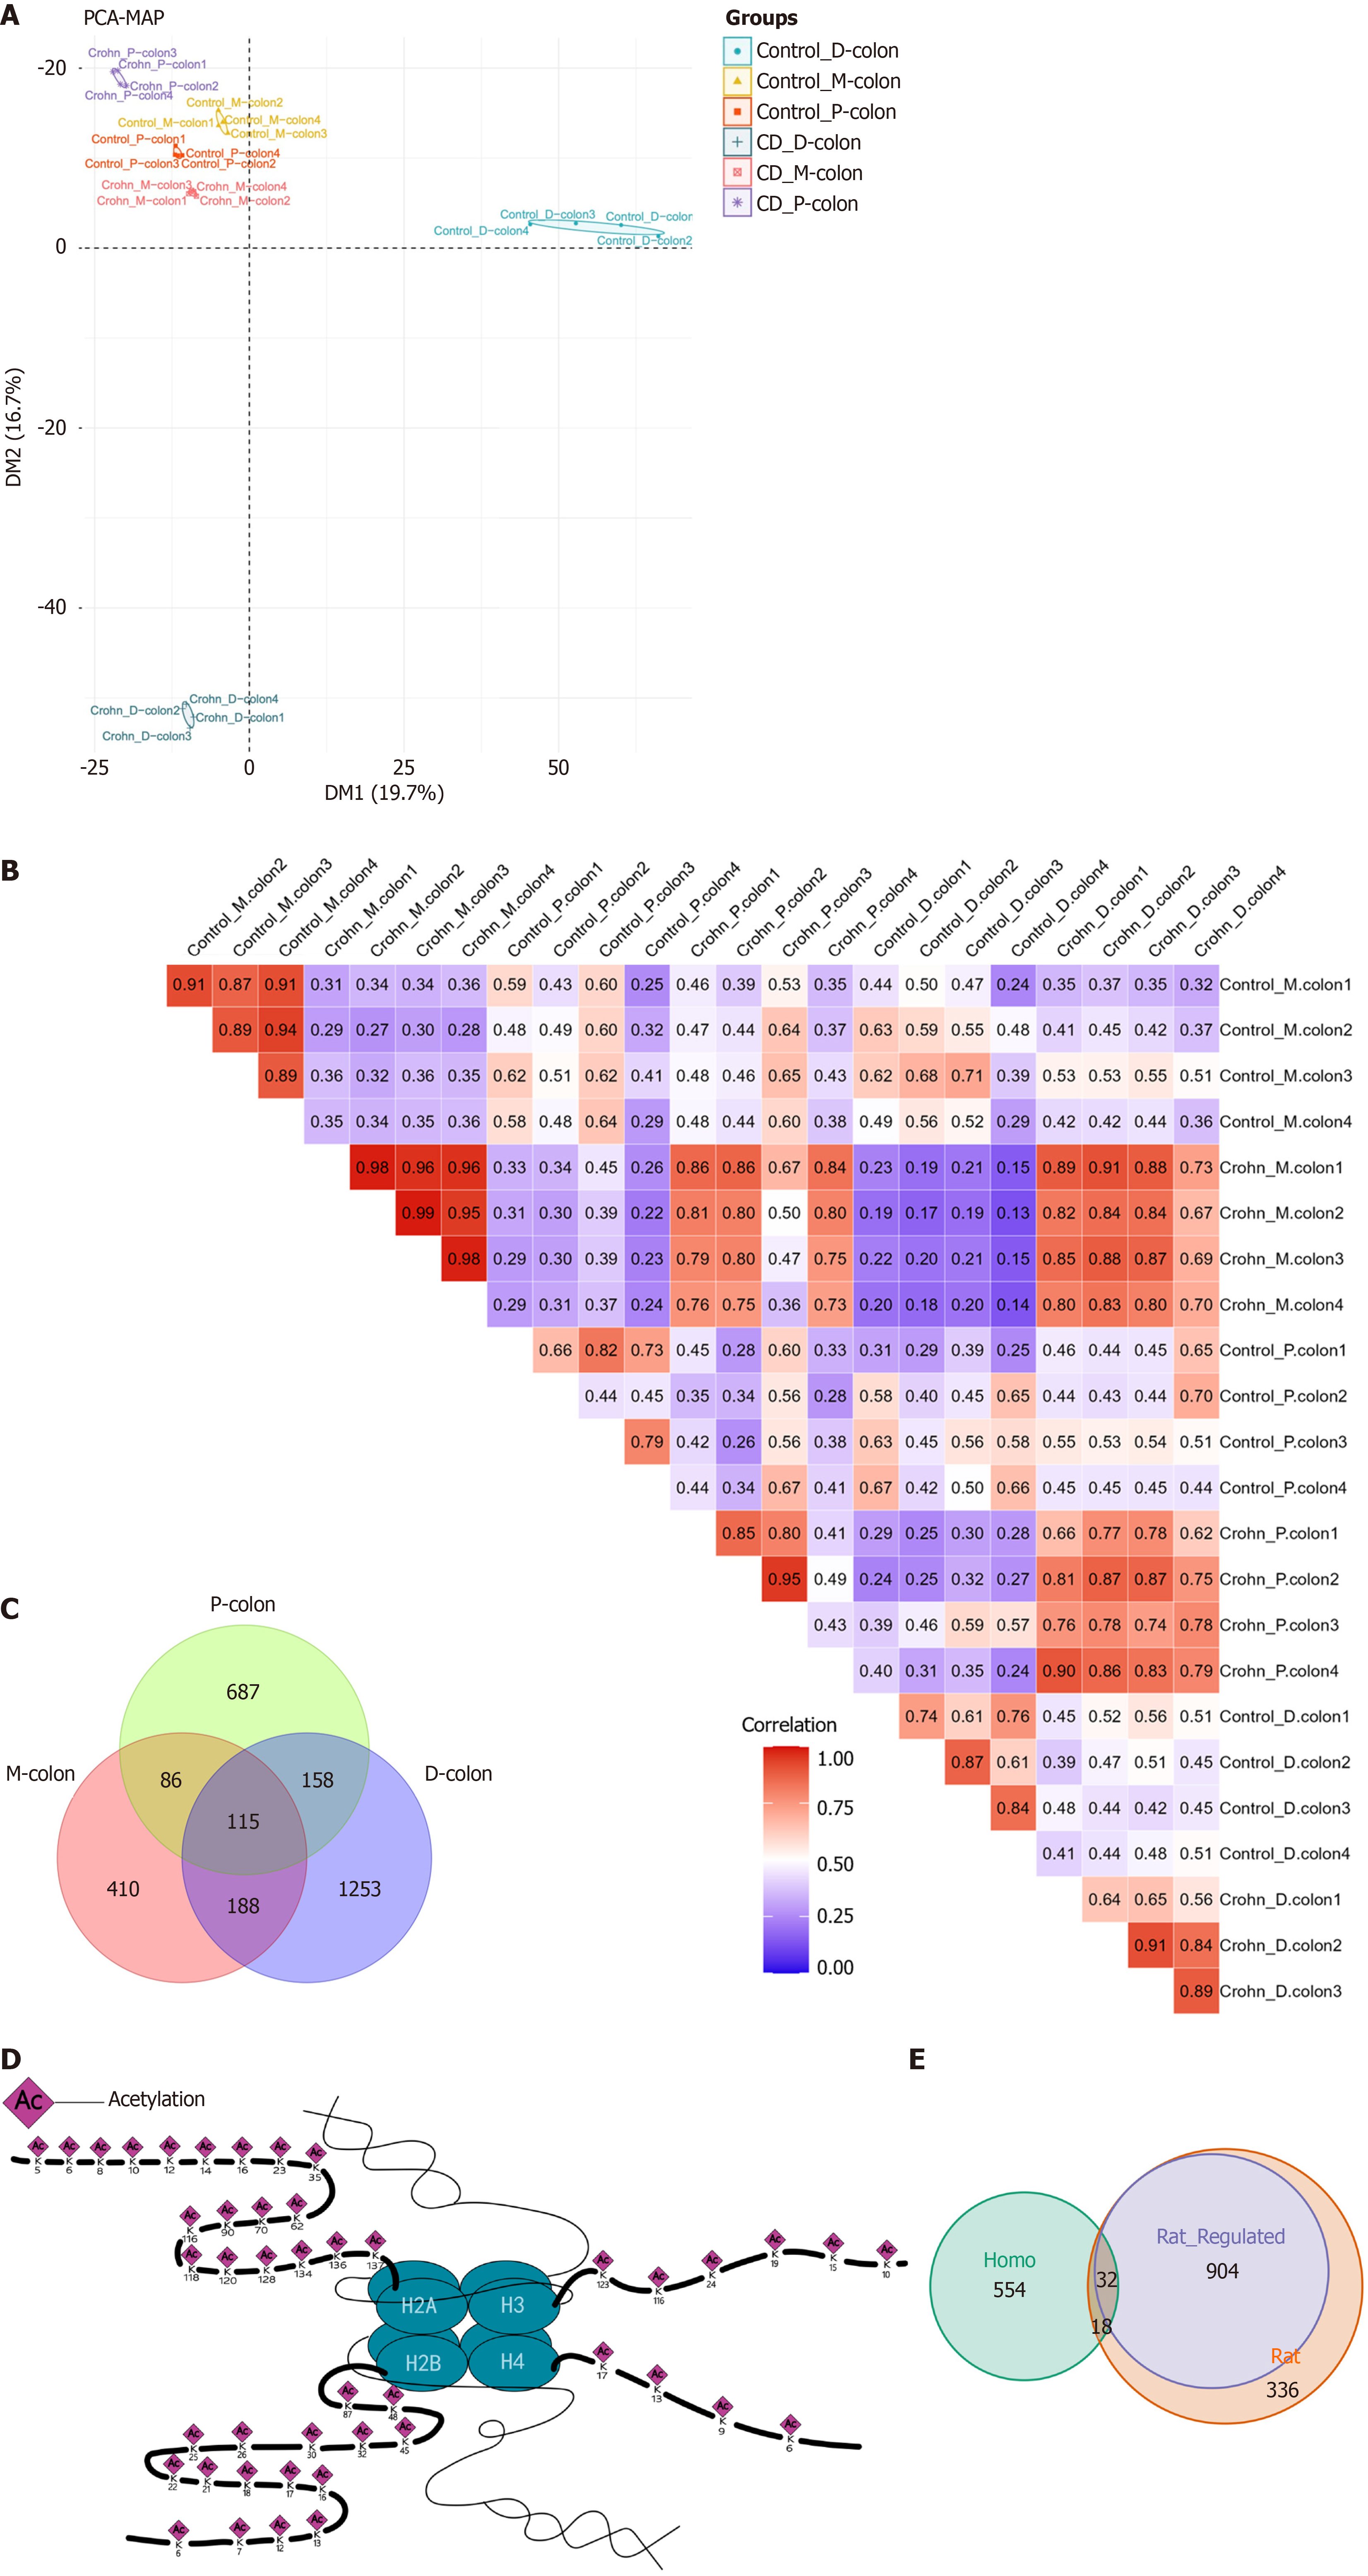
Figure 2 Segmental heterogeneity of the colonic acetylome.
A: Principal component analysis of acetylated peptides from three colonic segments of Crohn’s disease and control groups; B: Spearman correlation heatmap of acetylated protein abundances across all samples. Color scale represents Spearman’s correlation coefficient ranging from 0 (blue) to 1 (red); C: Venn diagram showing overlap and uniqueness of differentially acetylated proteins identified in proximal-colon, mid-colon, and distal-colon tissues; D: Schematic illustration of the identified acetylation sites on histones, with the positions of all identified acetylated lysine residues mapped onto the corresponding histone proteins (H3, H4, H2A and H2B). Numbers indicate the count of acetylated proteins in each region; E: Venn diagram of acetylated proteins overlapping between rat model and human compendium of protein lysine modifications. Acetylome data were derived from n = 4 biological replicates per group. PCA: Principal component analysis; P-colon: Proximal-colon; M-colon: Mid-colon; D-colon: Distal-colon; CD: Crohn’s disease.
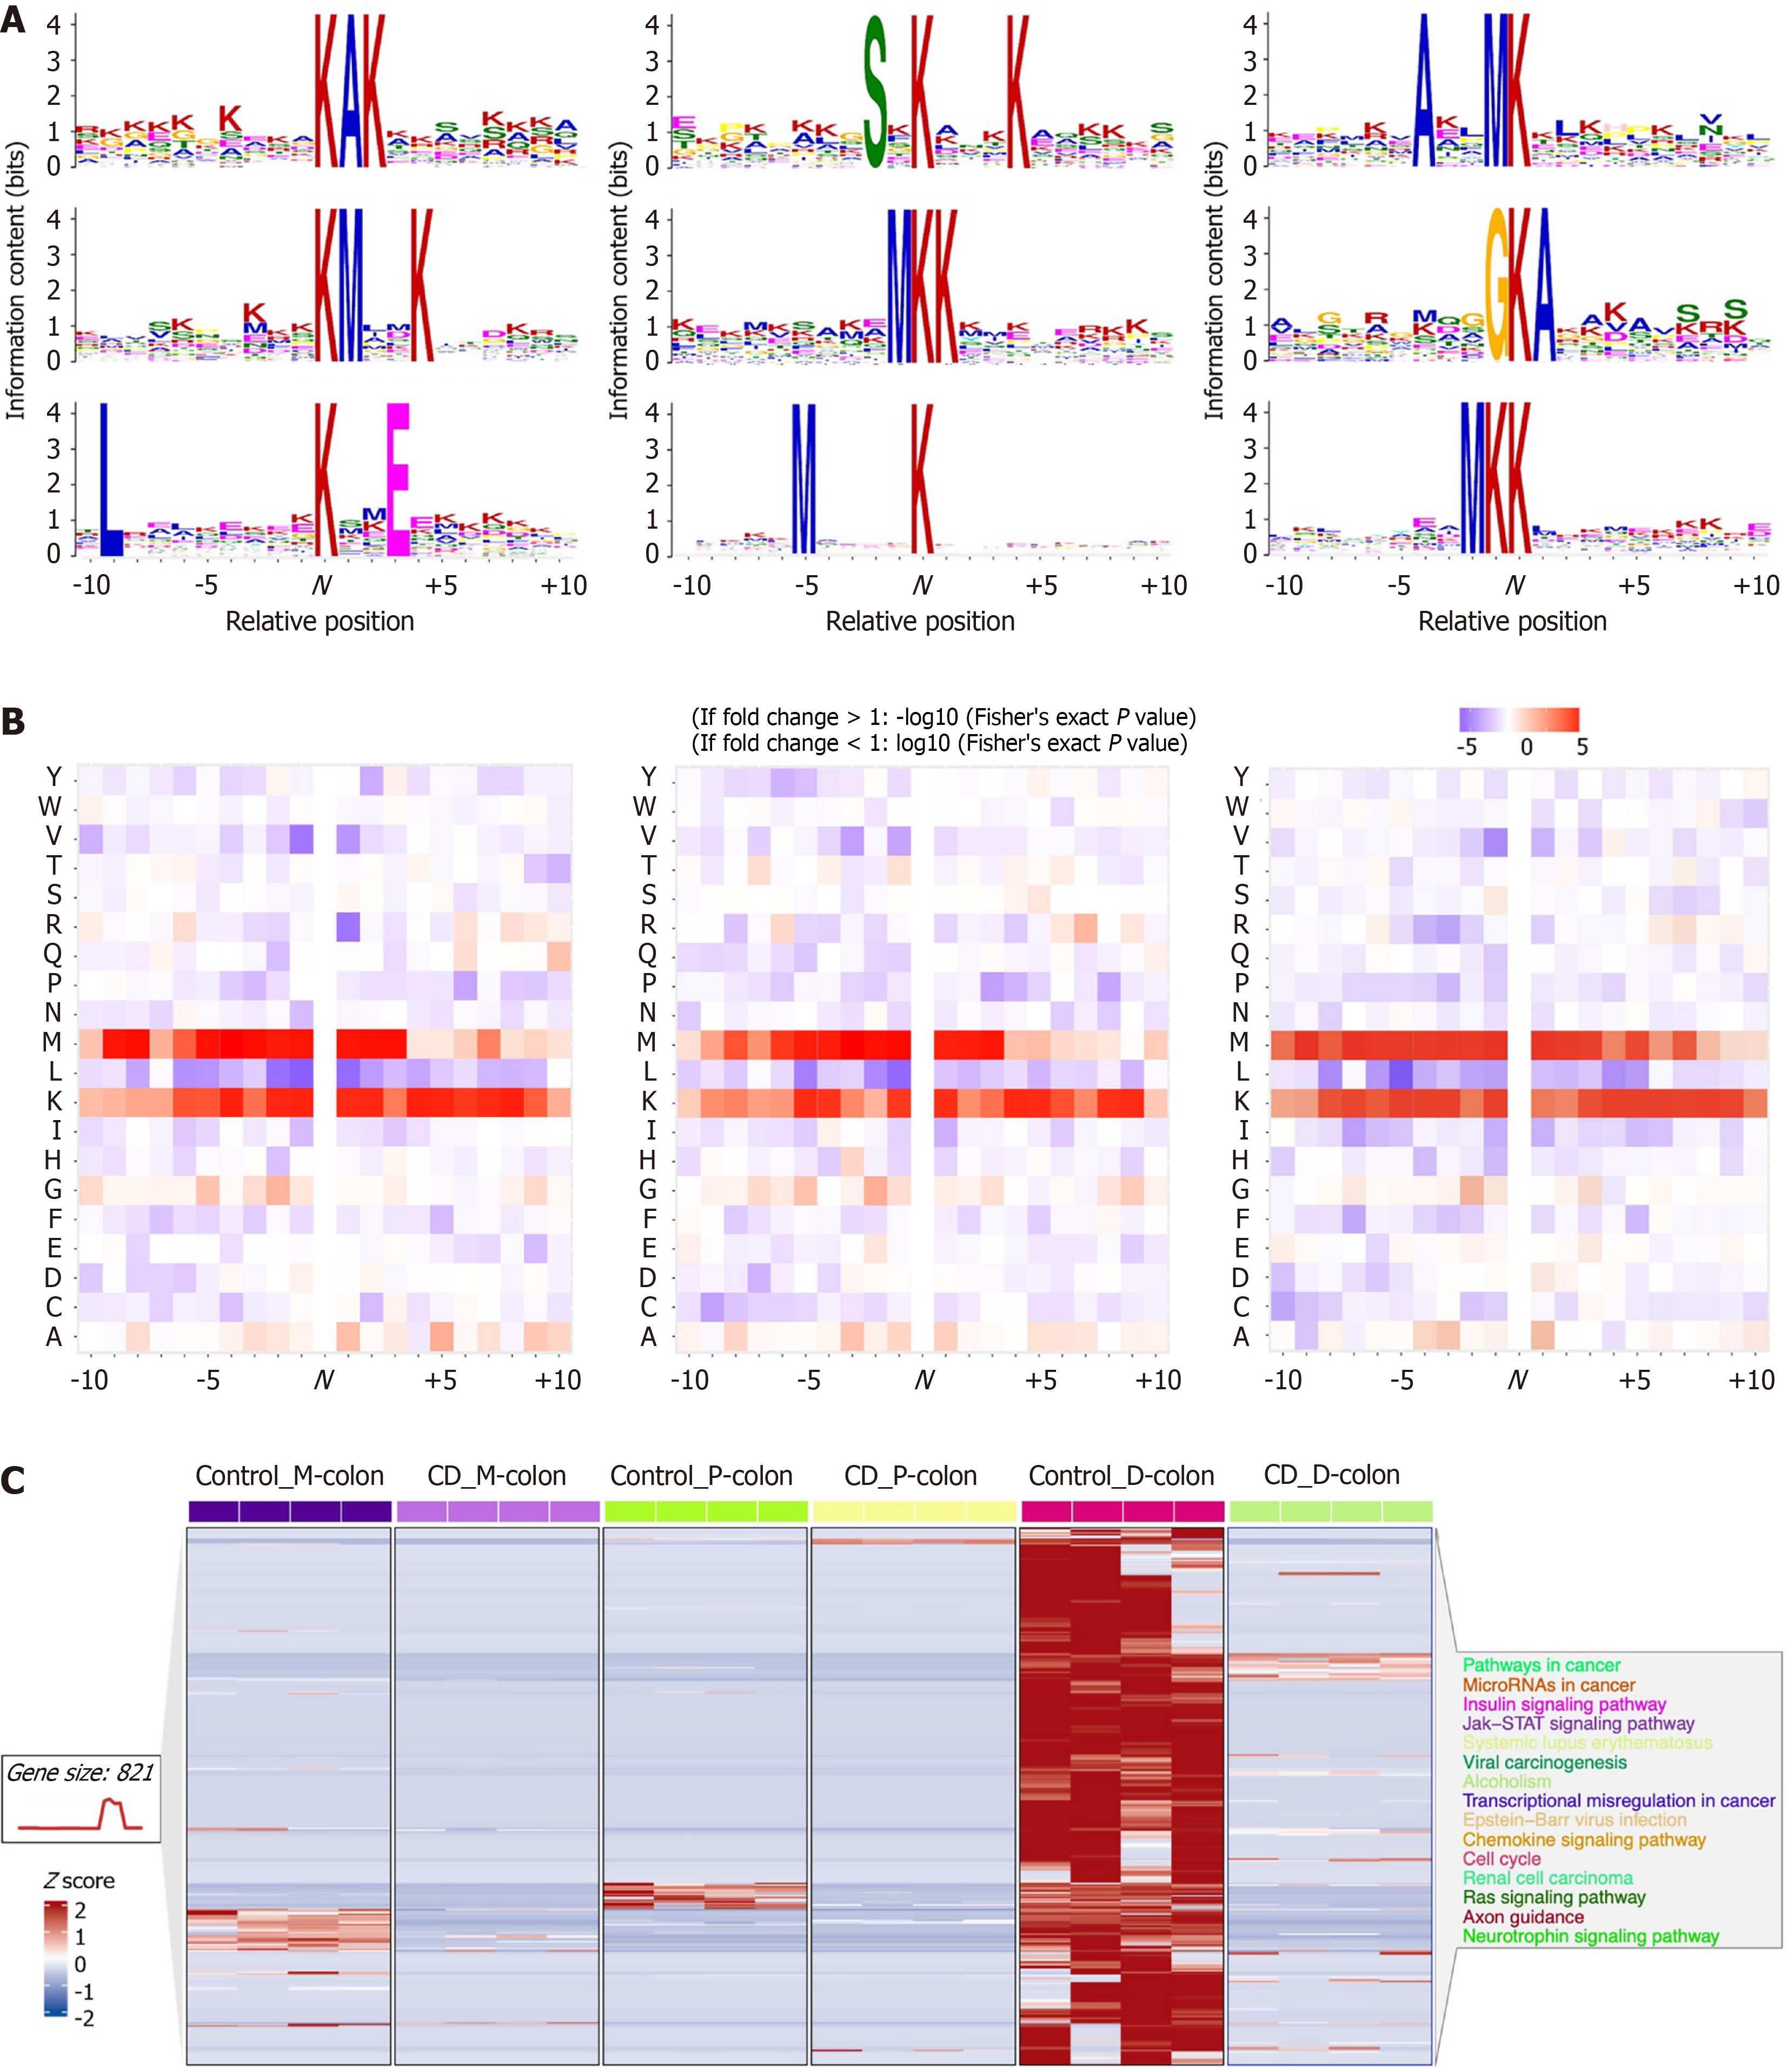
Figure 3 Motif analysis and abundance patterns of acetylated sites.
A: Sequence logos showing conserved amino acid motifs surrounding lysine acetylation (Kac) sites (± 10 residues) in proximal-colon, mid-colon, and distal-colon tissues; B: Enrichment scores of overrepresented motifs identified in each colonic segment; C: Heatmap showing normalized abundance of quantified acetylated sites across 24 tissue samples. Each row represents an acetylated protein, and each column represents an individual sample. Color scale indicates z-score-normalized abundance (red: High, blue: Low). P-colon: Proximal-colon; M-colon: Mid-colon; D-colon: Distal-colon; CD: Crohn’s disease; JAK: Janus Kinase; STAT: Signal transducer and activator of transcription; Y: Tyrosine; W: Tryptophan; V: Valine; T: Threonine; S: Serine; R: Arginine; Q: Glutamine; P: Proline; N: Asparagine; M: Methionine; L: Leucine; K: Lysine; I: Isoleucine; H: Histidine; G: Glycine; F: Pheny
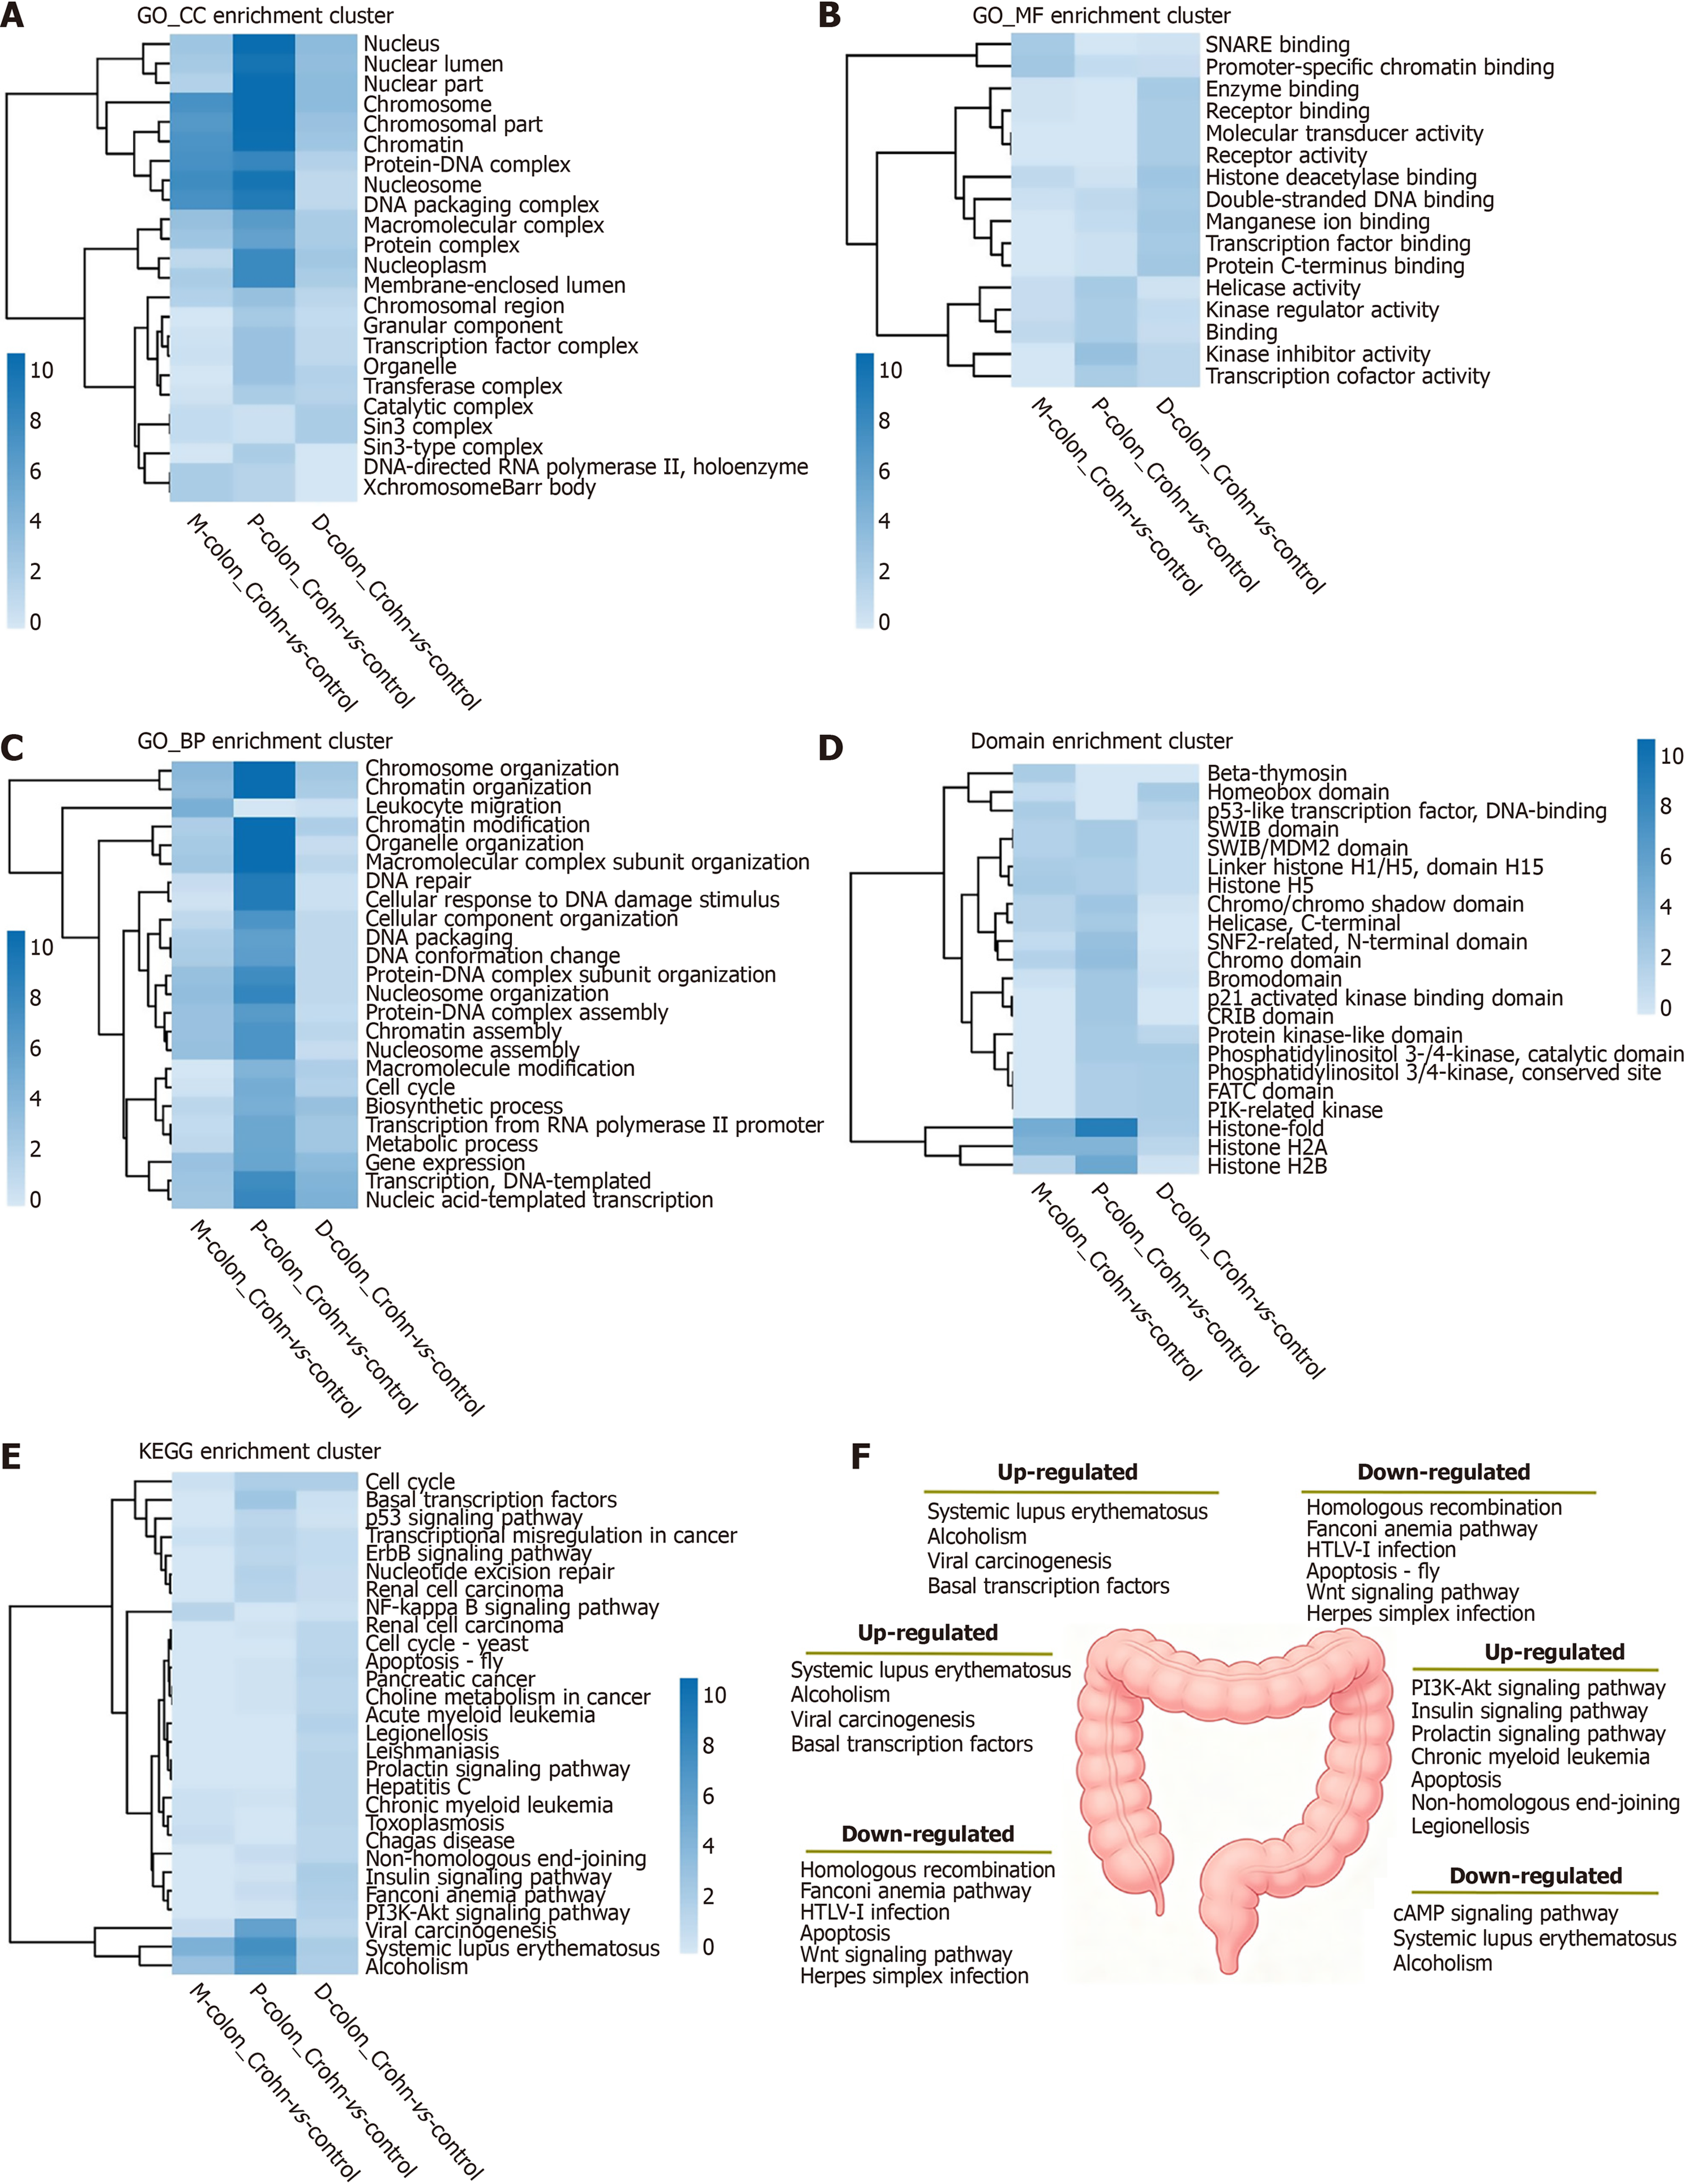
Figure 4 Segmentspecific enrichment clustering of differentially acetylated proteins.
A-E: Heatmaps showing upregulated enrichment clustering for cellular component (A), molecular function (B), biological process (C), domain architecture (D), and Kyoto Encyclopedia of Genes and Genomes pathways (E) across proximal-colon, mid-colon, and distal-colon tissues (Crohn’s disease model vs corresponding control). Color intensity represents the significance level [-log10 (P value)] of enrichment, with red indicating higher significance; F: Schematic summary of significantly up- and down-regulated enriched pathways in the three colonic segments under 2,4,6-trinitrobenzenesulfonic acid-induced colitis. KEGG: Kyoto Encyclopedia of Genes and Genomes; GO: Gene Ontology; CC: Cellular component; MF: Molecular function; BP: Biological process; P-colon: Proximal-colon; M-colon: Mid-colon; D-colon: Distal-colon; PI3K/Akt: Phosphatidylinositol 3-kinase/protein kinase B; HTLV: Human T-cell leukemia virus.
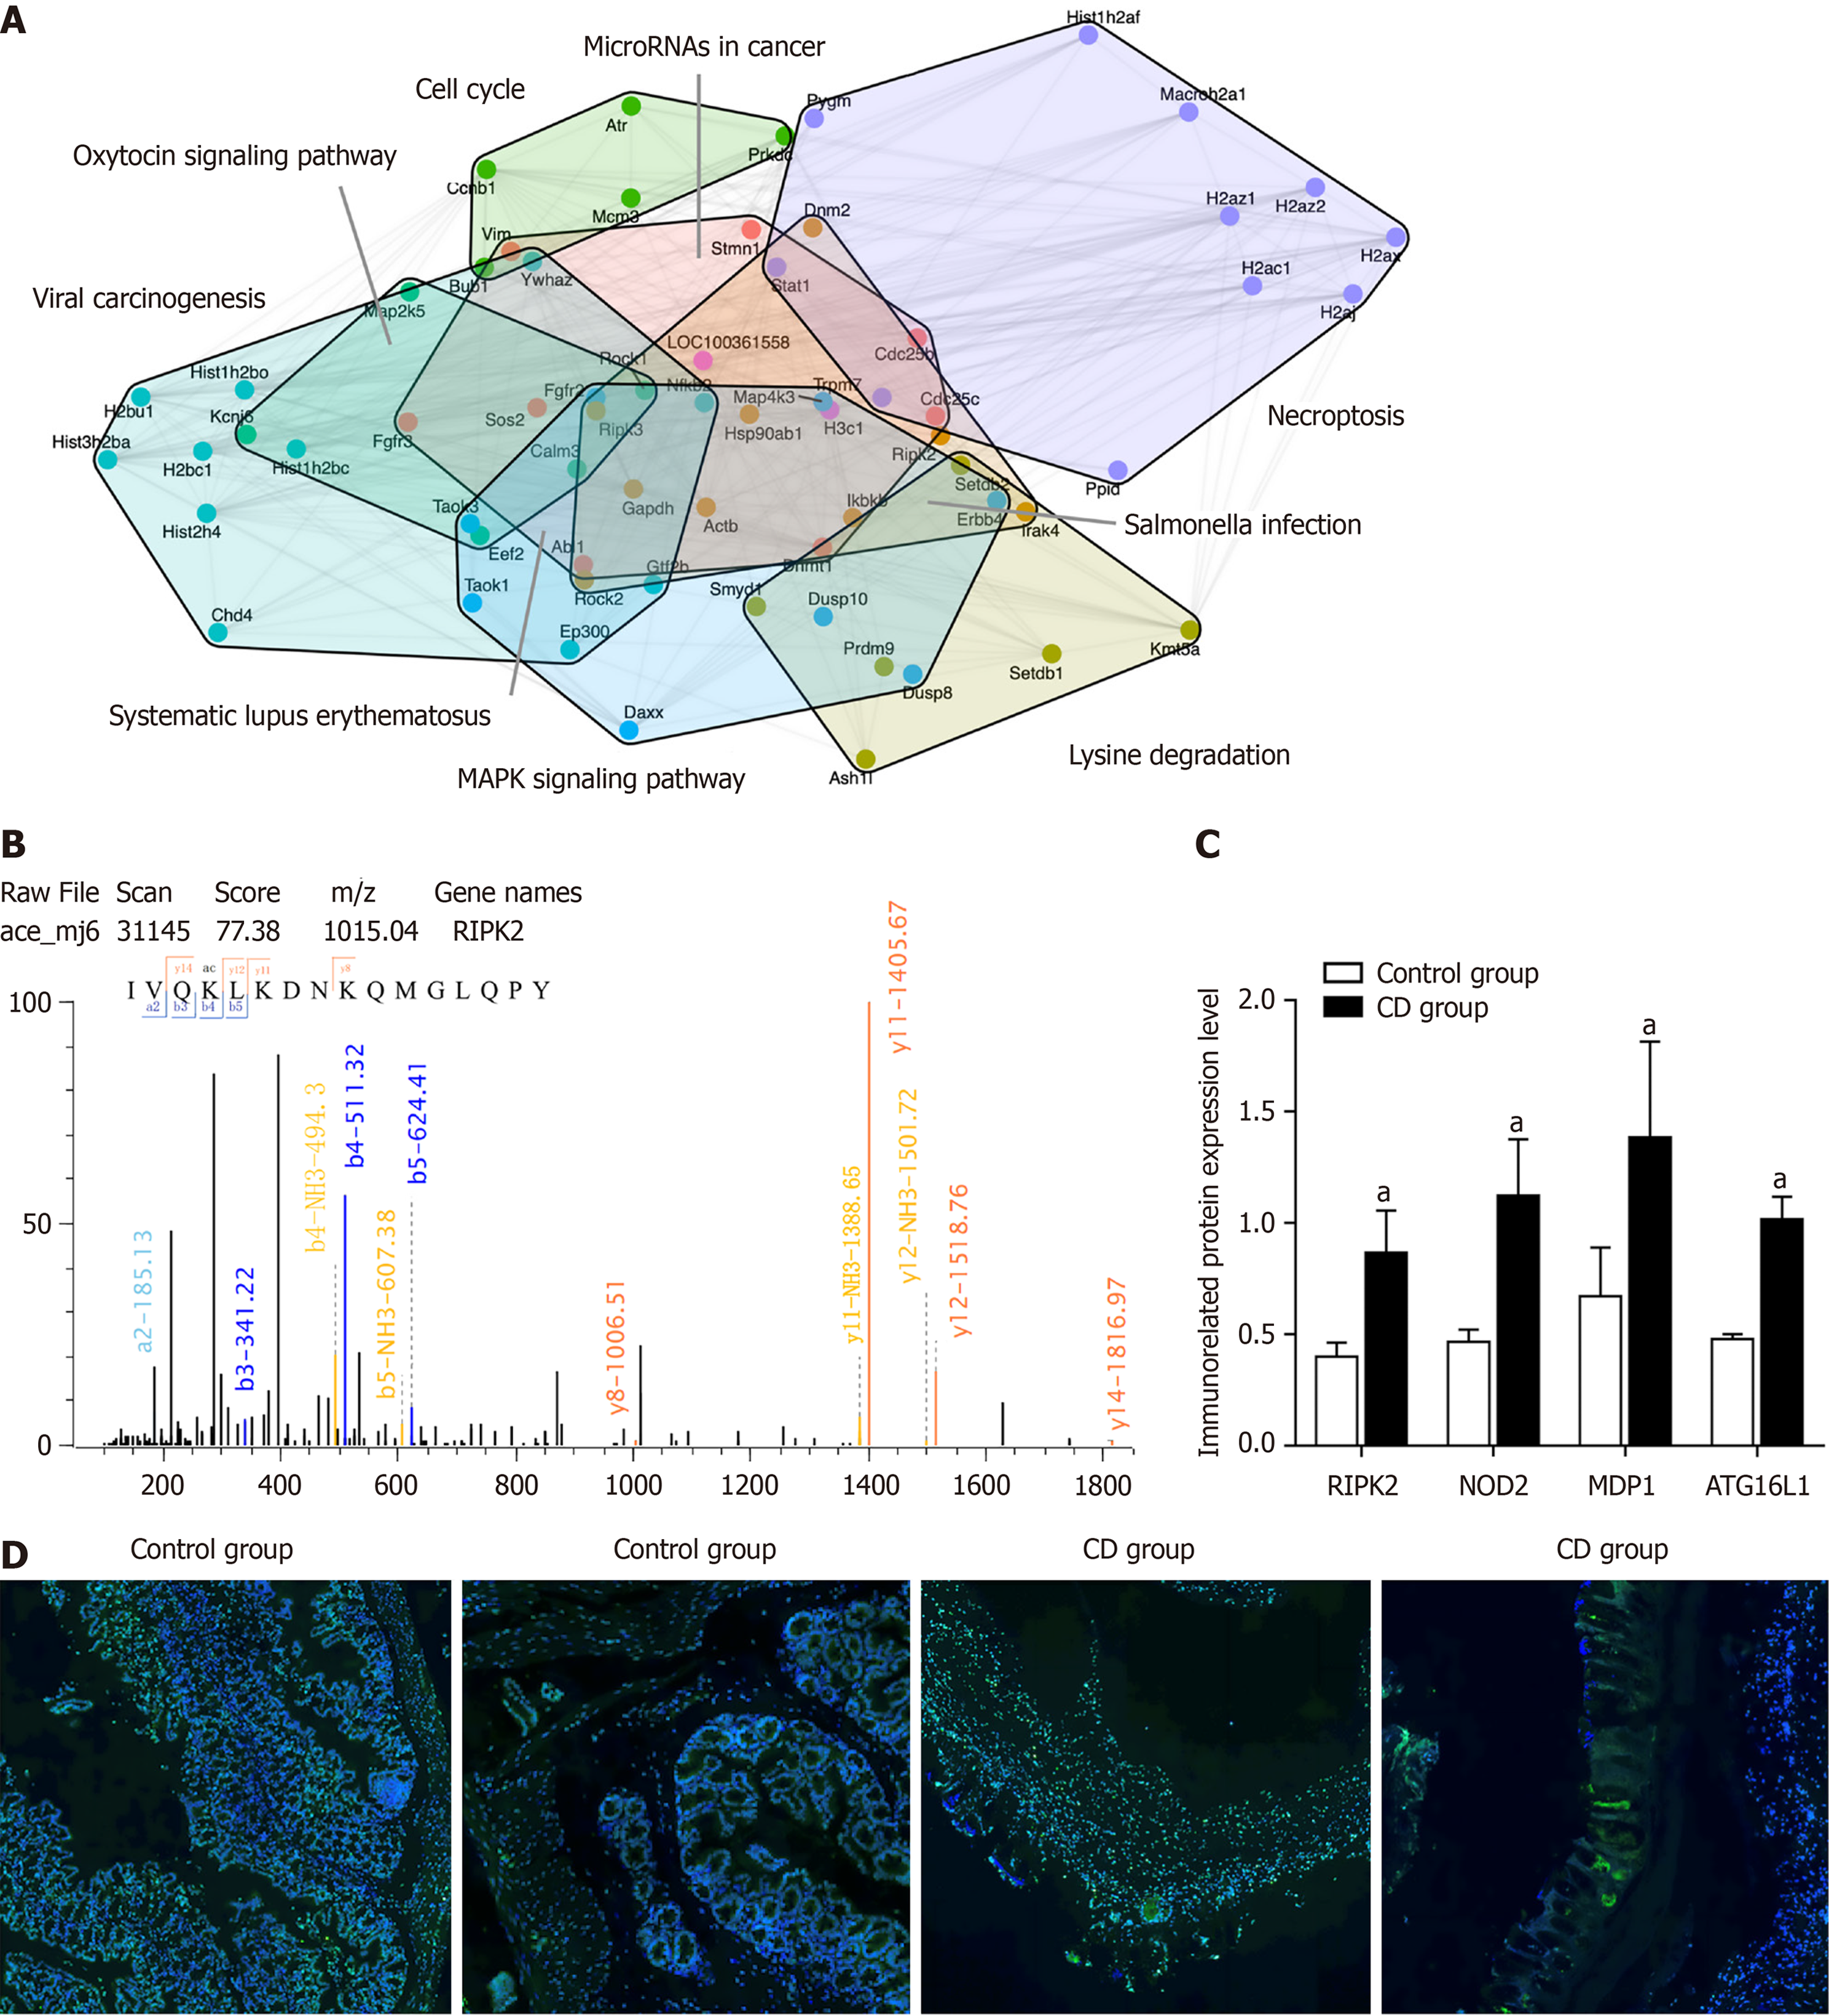
Figure 5 Protein interaction networks and validation of key acetylation events.
A: Protein-protein interaction network of differentially acetylated proteins. Nodes represent acetylated proteins, and edges represent known or predicted interactions. Modules enriched in key pathways are highlighted by distinct colored regions; B: Western blot analysis of innate immune regulators receptor-interacting serine/threonine-protein kinase 2 (RIPK2), nucleotide-binding oligomerization domain-containing protein 2, magnesium dependent phosphatase 1, and ATG16 L1. Data are presented as mean ± SEM. P < 0.01 indicates significant upregulation in Crohn’s disease (CD) model group compared to control. n = 3 biological replicates per group; C: Immunofluorescence staining of RIPK2 (green) in colonic sections. Left: Control group; right: CD model group. Nuclei were counterstained with 4’,6-diamidino-2-phenylindole (blue). Scale bar: 50 μm. n = 2 biological replicates per group; D: Representative mass spectrometry (MS)/MS spectrum of RIPK2 depicting fragment ions containing lysine 508 (K508ac), with a characteristic mass shift of +42.01 Da indicative of acetylation, the Y-axis represents the relative abundance of fragment ions. aP < 0.01. CD: Crohn’s disease; MAPK: Mitogen-activated protein kinase; RIPK2: Receptor-interacting serine/threonine-protein kinase 2; NOD2: Nucleotide-binding oligomerization domain-containing protein 2; MDP1: Magnesium dependent phosphatase 1.
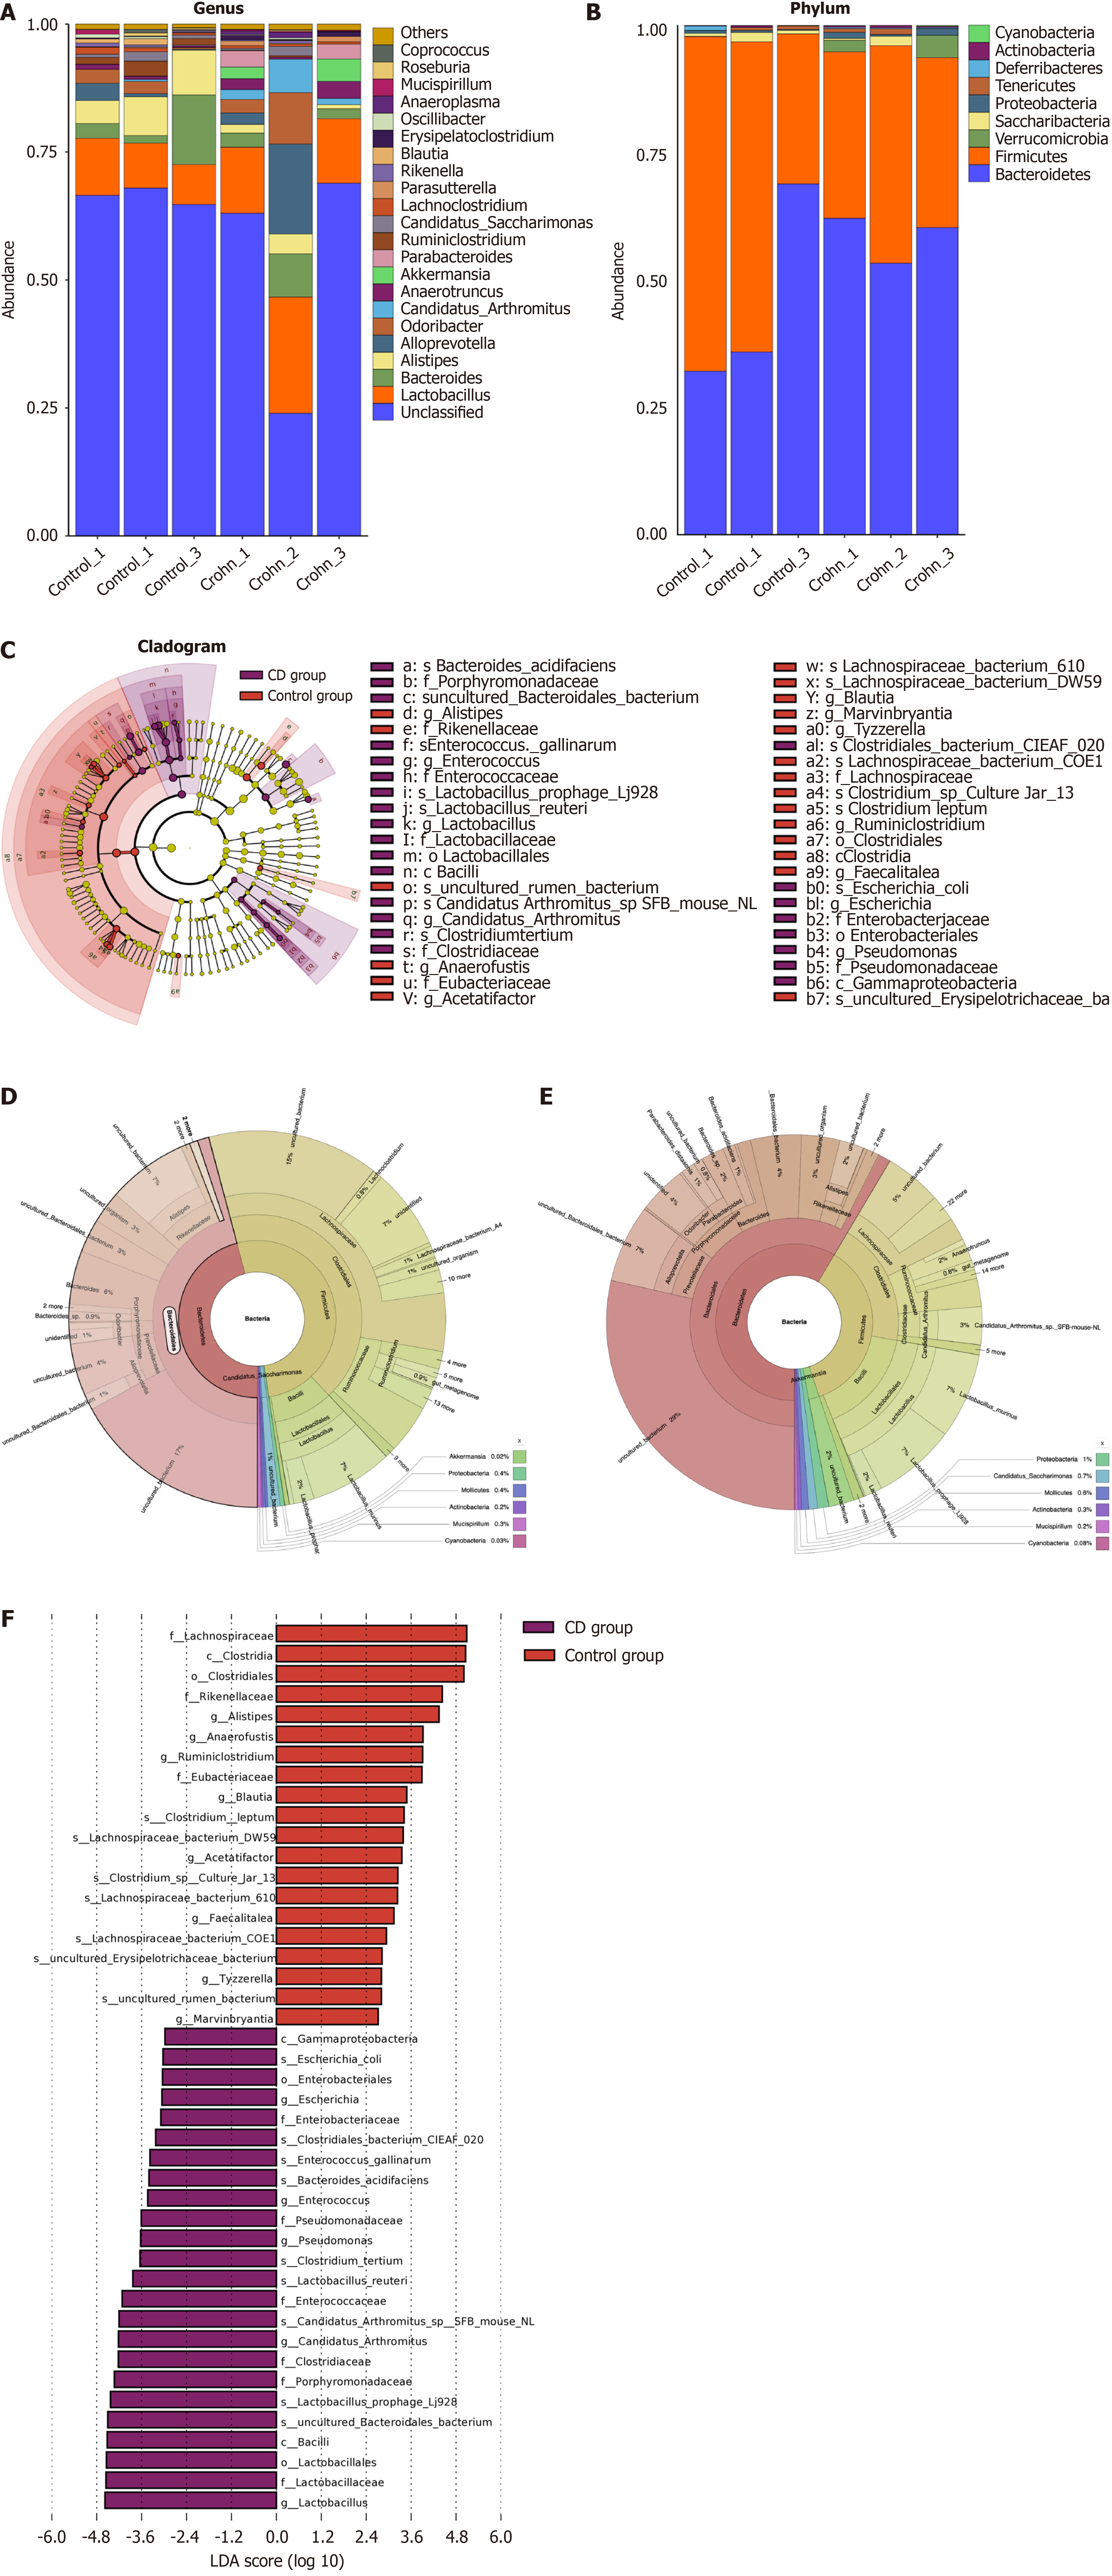
Figure 6 Compositional analysis of gut microbiota in control and Crohn’s disease model groups.
A and B: Bar charts showing the relative abun
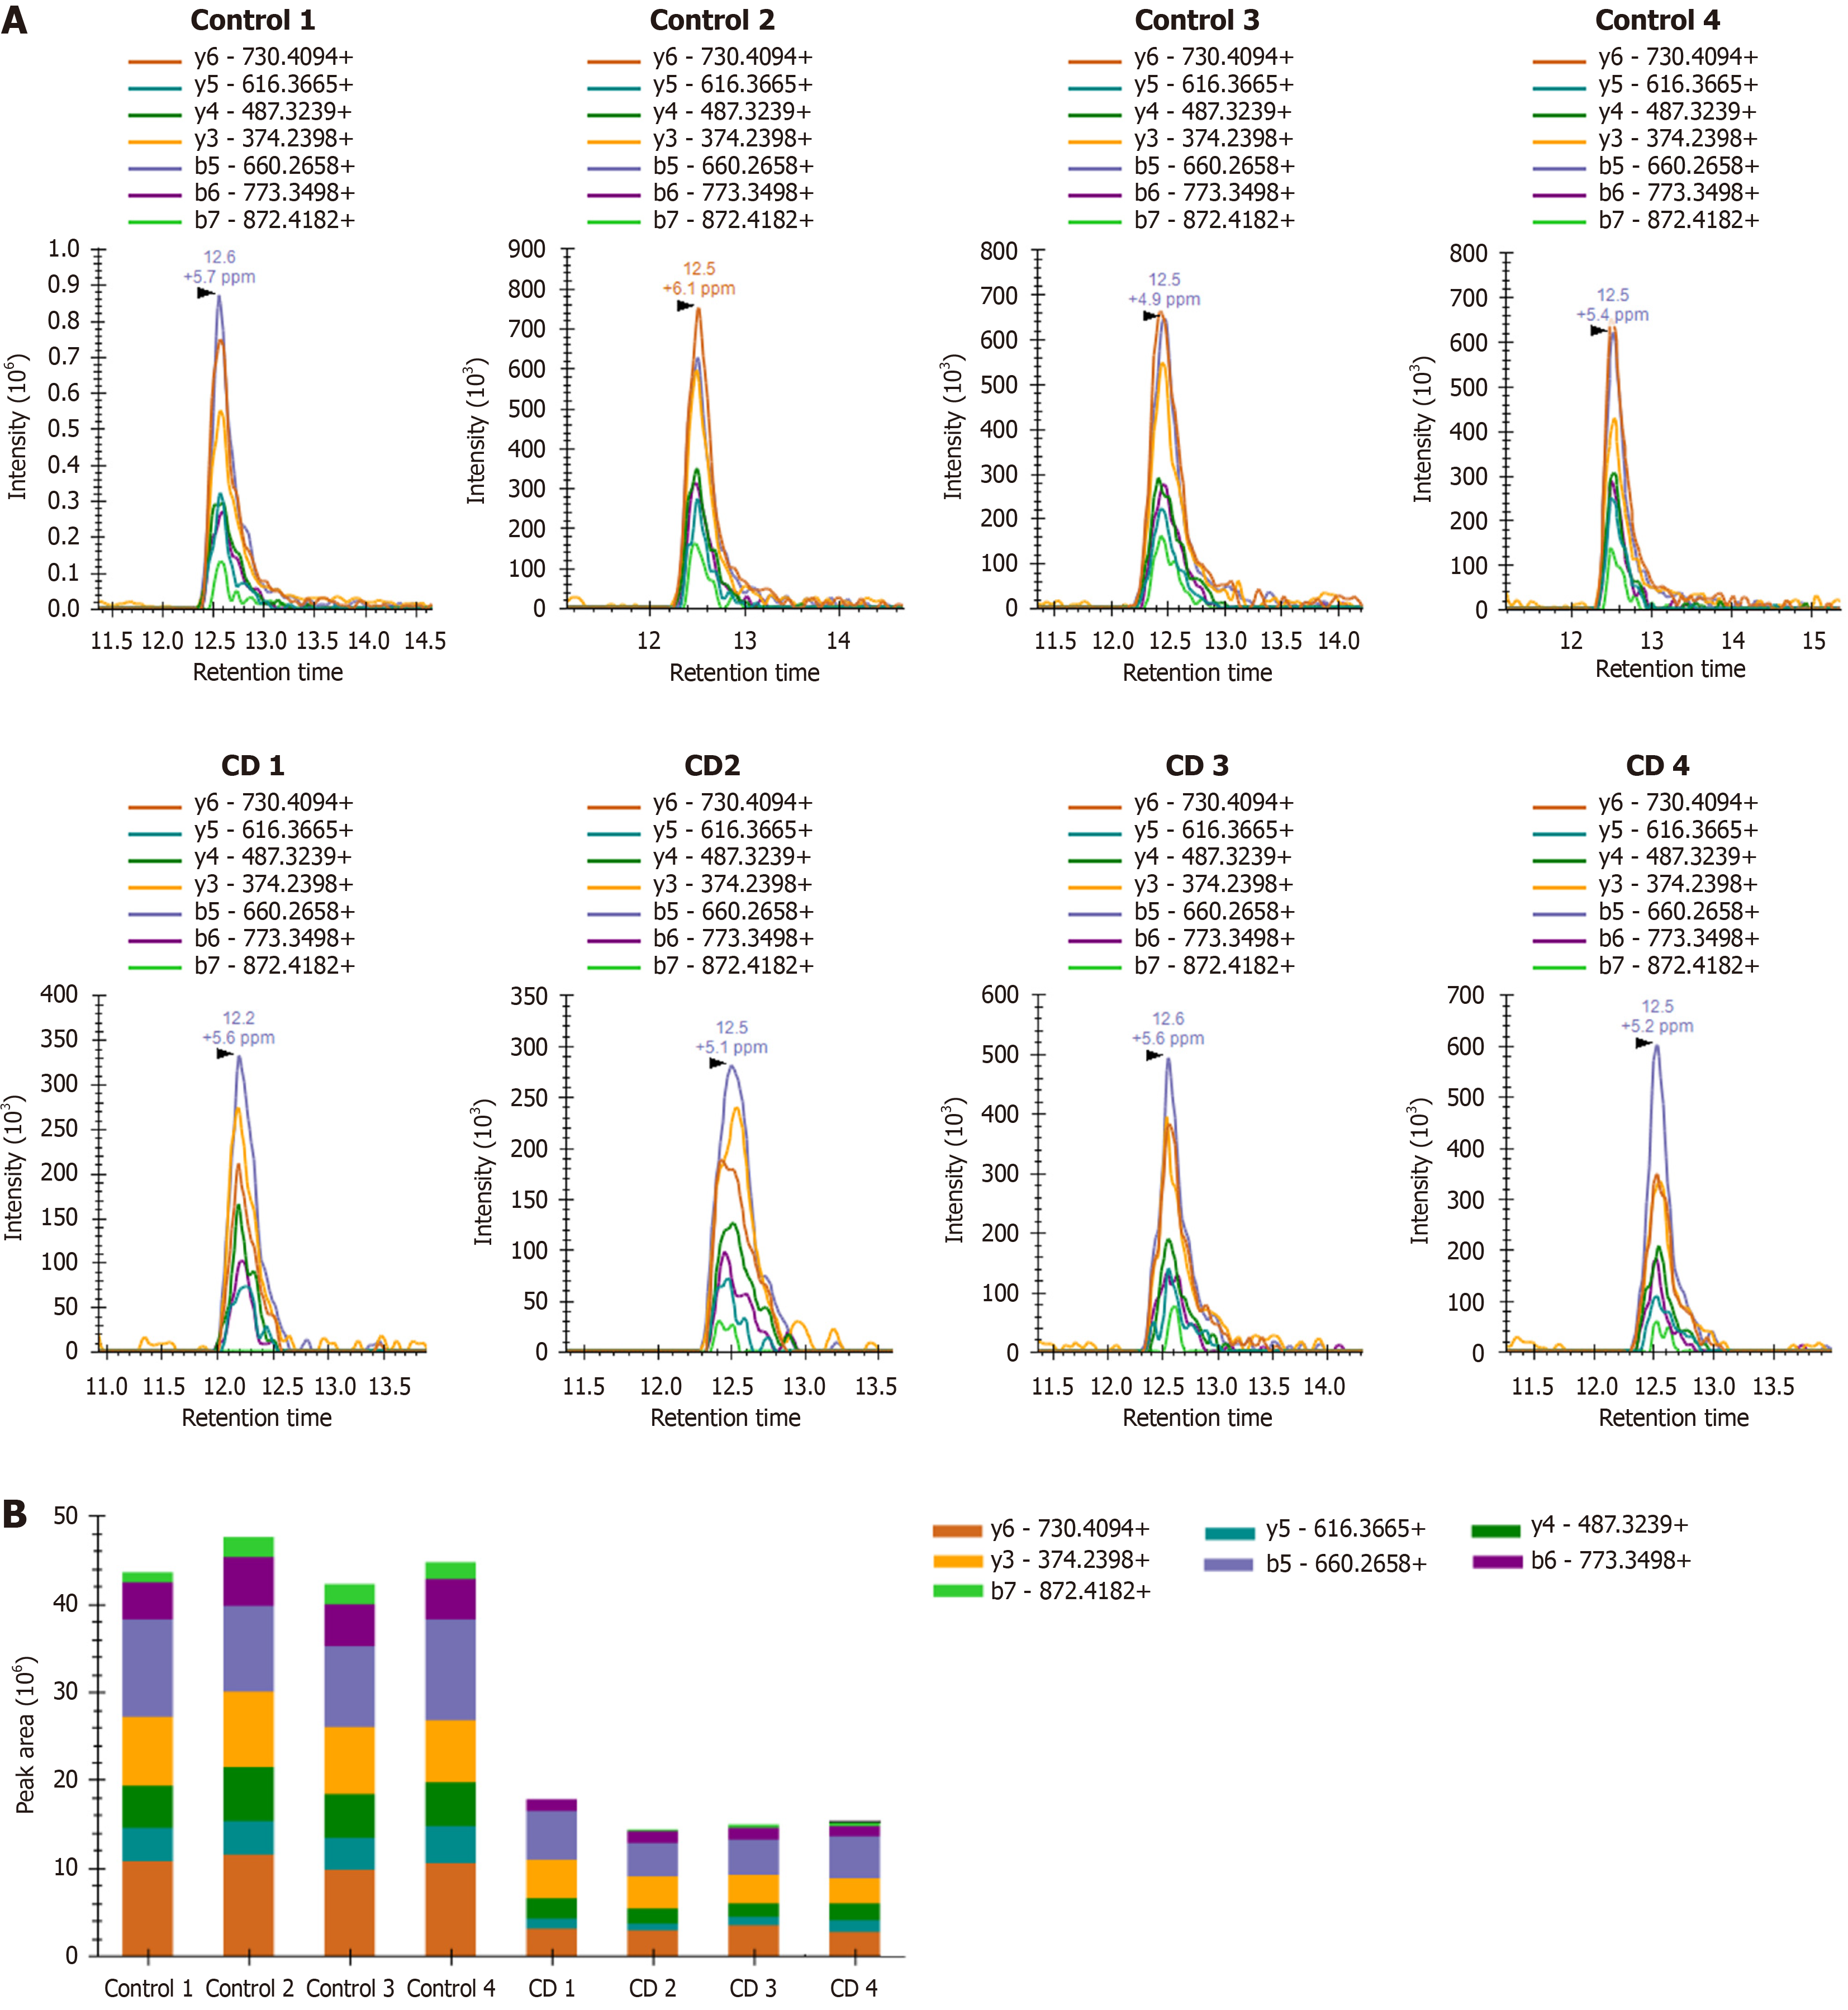
Figure 7 Targeted parallel reaction monitoring validation of Ywhaz K3ac acetylation in colonic tissues.
A: Representative extracted ion chro
- Citation: Guo YJ, Wen J, Liu JX, Gao YN, Chen XW. Identification of region-specific signaling modules governing Crohn’s pathogenesis via mass spectrometry-based integrative acetyl-proteomics. World J Gastroenterol 2027; 33(1): 123358
- URL: https://www.wjgnet.com/1007-9327/full/v33/i1/123358.htm
- DOI: https://dx.doi.org/10.3748/wjg.123358