
















Copyright: ©Author(s) 2027.
World J Gastroenterol. Jan 7, 2027; 33(1): 123358
Published online Jan 7, 2027. doi: 10.3748/wjg.123358
Published online Jan 7, 2027. doi: 10.3748/wjg.123358
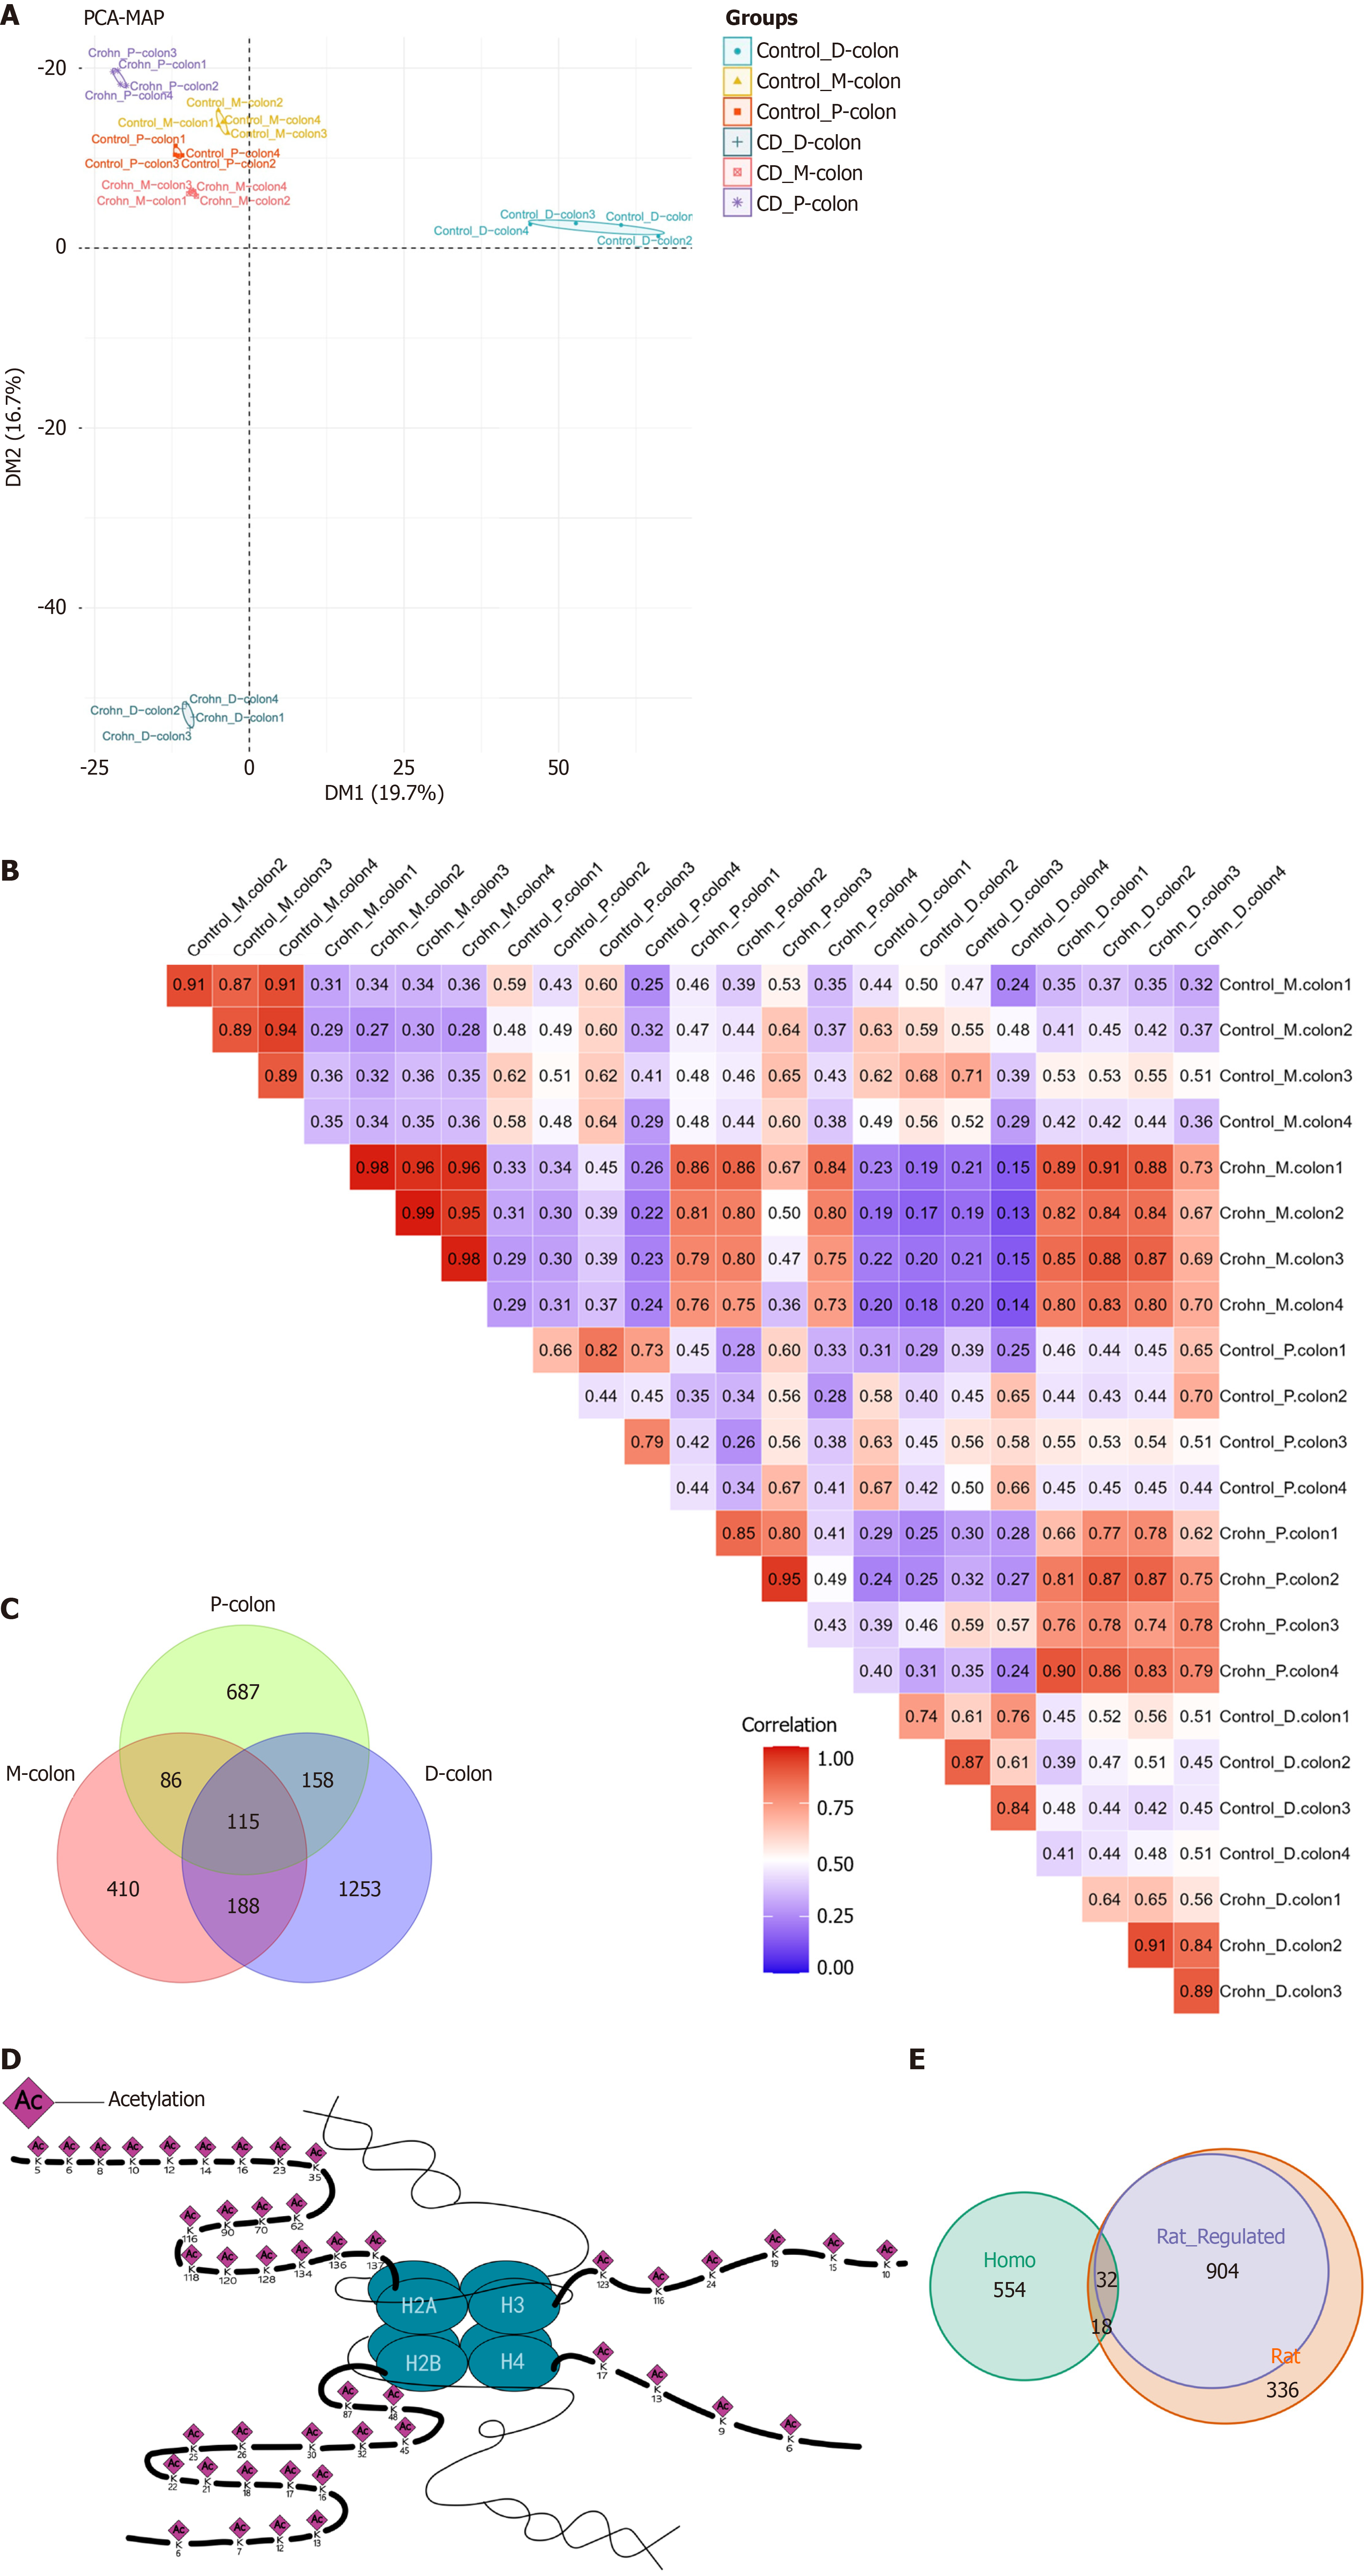
Figure 2 Segmental heterogeneity of the colonic acetylome.
A: Principal component analysis of acetylated peptides from three colonic segments of Crohn’s disease and control groups; B: Spearman correlation heatmap of acetylated protein abundances across all samples. Color scale represents Spearman’s correlation coefficient ranging from 0 (blue) to 1 (red); C: Venn diagram showing overlap and uniqueness of differentially acetylated proteins identified in proximal-colon, mid-colon, and distal-colon tissues; D: Schematic illustration of the identified acetylation sites on histones, with the positions of all identified acetylated lysine residues mapped onto the corresponding histone proteins (H3, H4, H2A and H2B). Numbers indicate the count of acetylated proteins in each region; E: Venn diagram of acetylated proteins overlapping between rat model and human compendium of protein lysine modifications. Acetylome data were derived from n = 4 biological replicates per group. PCA: Principal component analysis; P-colon: Proximal-colon; M-colon: Mid-colon; D-colon: Distal-colon; CD: Crohn’s disease.
- Citation: Guo YJ, Wen J, Liu JX, Gao YN, Chen XW. Identification of region-specific signaling modules governing Crohn’s pathogenesis via mass spectrometry-based integrative acetyl-proteomics. World J Gastroenterol 2027; 33(1): 123358
- URL: https://www.wjgnet.com/1007-9327/full/v33/i1/123358.htm
- DOI: https://dx.doi.org/10.3748/wjg.123358