
















Copyright: ©Author(s) 2027.
World J Gastroenterol. Jan 7, 2027; 33(1): 123358
Published online Jan 7, 2027. doi: 10.3748/wjg.123358
Published online Jan 7, 2027. doi: 10.3748/wjg.123358
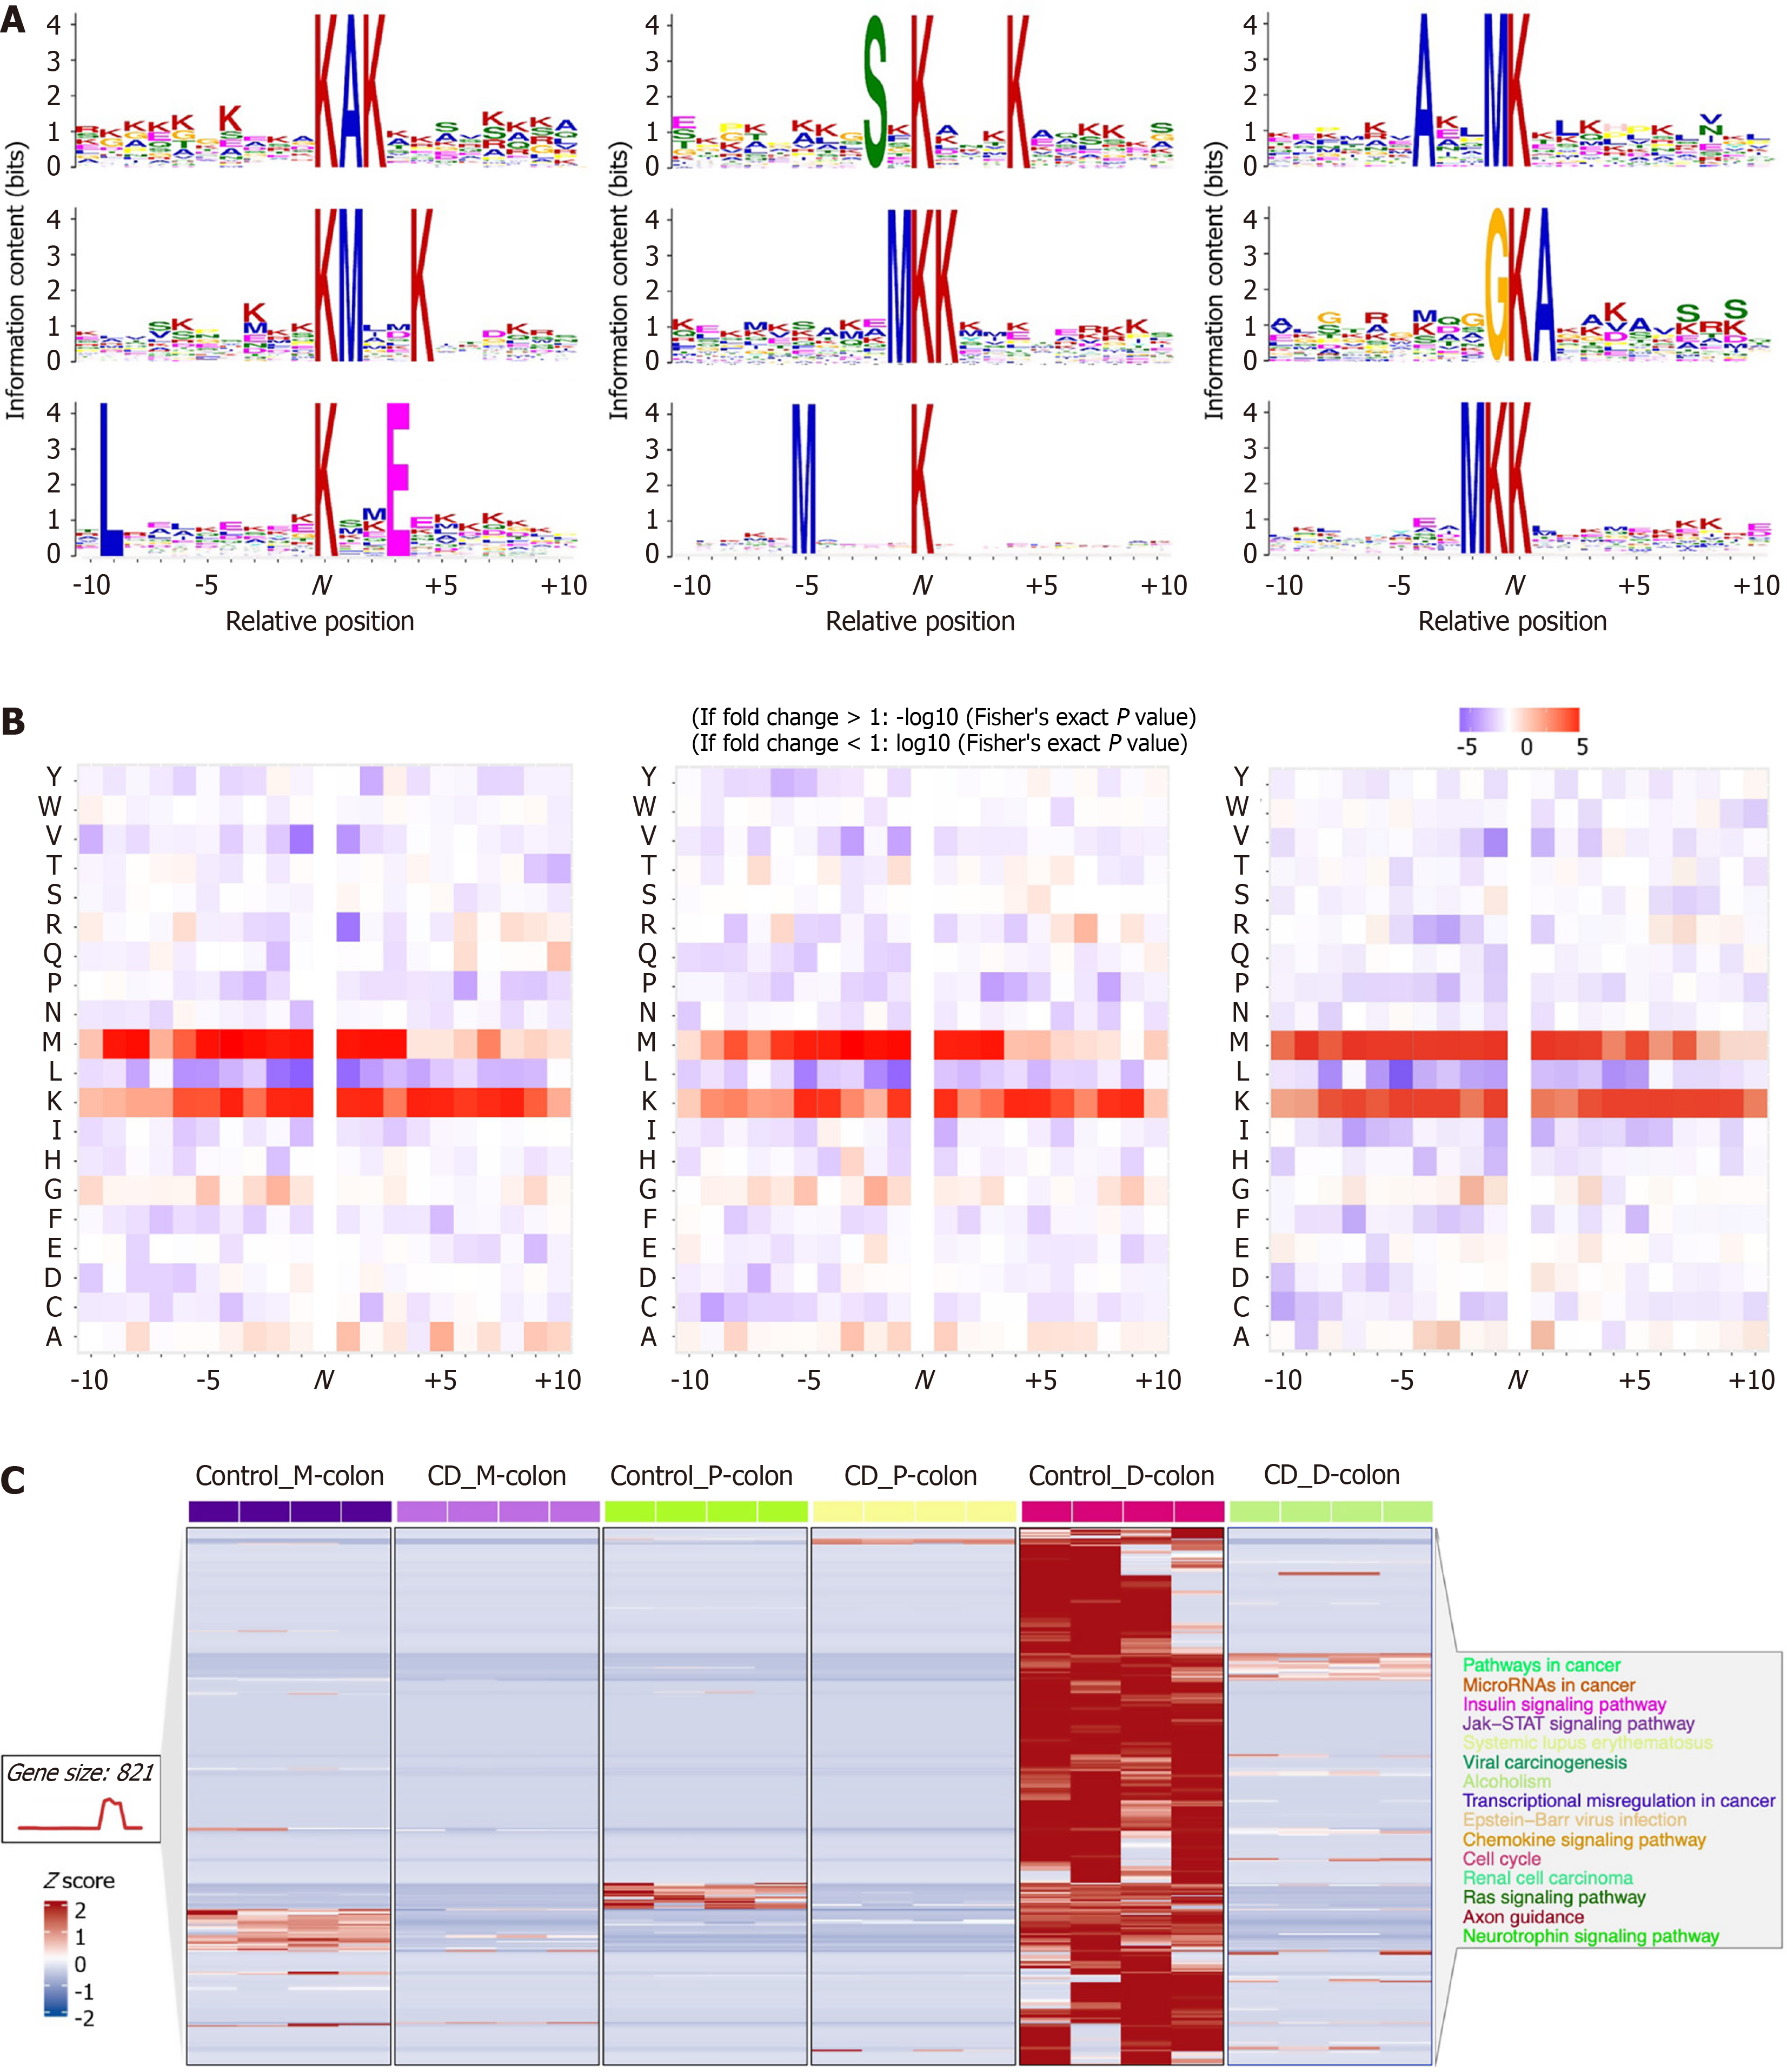
Figure 3 Motif analysis and abundance patterns of acetylated sites.
A: Sequence logos showing conserved amino acid motifs surrounding lysine acetylation (Kac) sites (± 10 residues) in proximal-colon, mid-colon, and distal-colon tissues; B: Enrichment scores of overrepresented motifs identified in each colonic segment; C: Heatmap showing normalized abundance of quantified acetylated sites across 24 tissue samples. Each row represents an acetylated protein, and each column represents an individual sample. Color scale indicates z-score-normalized abundance (red: High, blue: Low). P-colon: Proximal-colon; M-colon: Mid-colon; D-colon: Distal-colon; CD: Crohn’s disease; JAK: Janus Kinase; STAT: Signal transducer and activator of transcription; Y: Tyrosine; W: Tryptophan; V: Valine; T: Threonine; S: Serine; R: Arginine; Q: Glutamine; P: Proline; N: Asparagine; M: Methionine; L: Leucine; K: Lysine; I: Isoleucine; H: Histidine; G: Glycine; F: Pheny
- Citation: Guo YJ, Wen J, Liu JX, Gao YN, Chen XW. Identification of region-specific signaling modules governing Crohn’s pathogenesis via mass spectrometry-based integrative acetyl-proteomics. World J Gastroenterol 2027; 33(1): 123358
- URL: https://www.wjgnet.com/1007-9327/full/v33/i1/123358.htm
- DOI: https://dx.doi.org/10.3748/wjg.123358