
















Copyright: ©Author(s) 2027.
World J Gastroenterol. Jan 7, 2027; 33(1): 123358
Published online Jan 7, 2027. doi: 10.3748/wjg.123358
Published online Jan 7, 2027. doi: 10.3748/wjg.123358
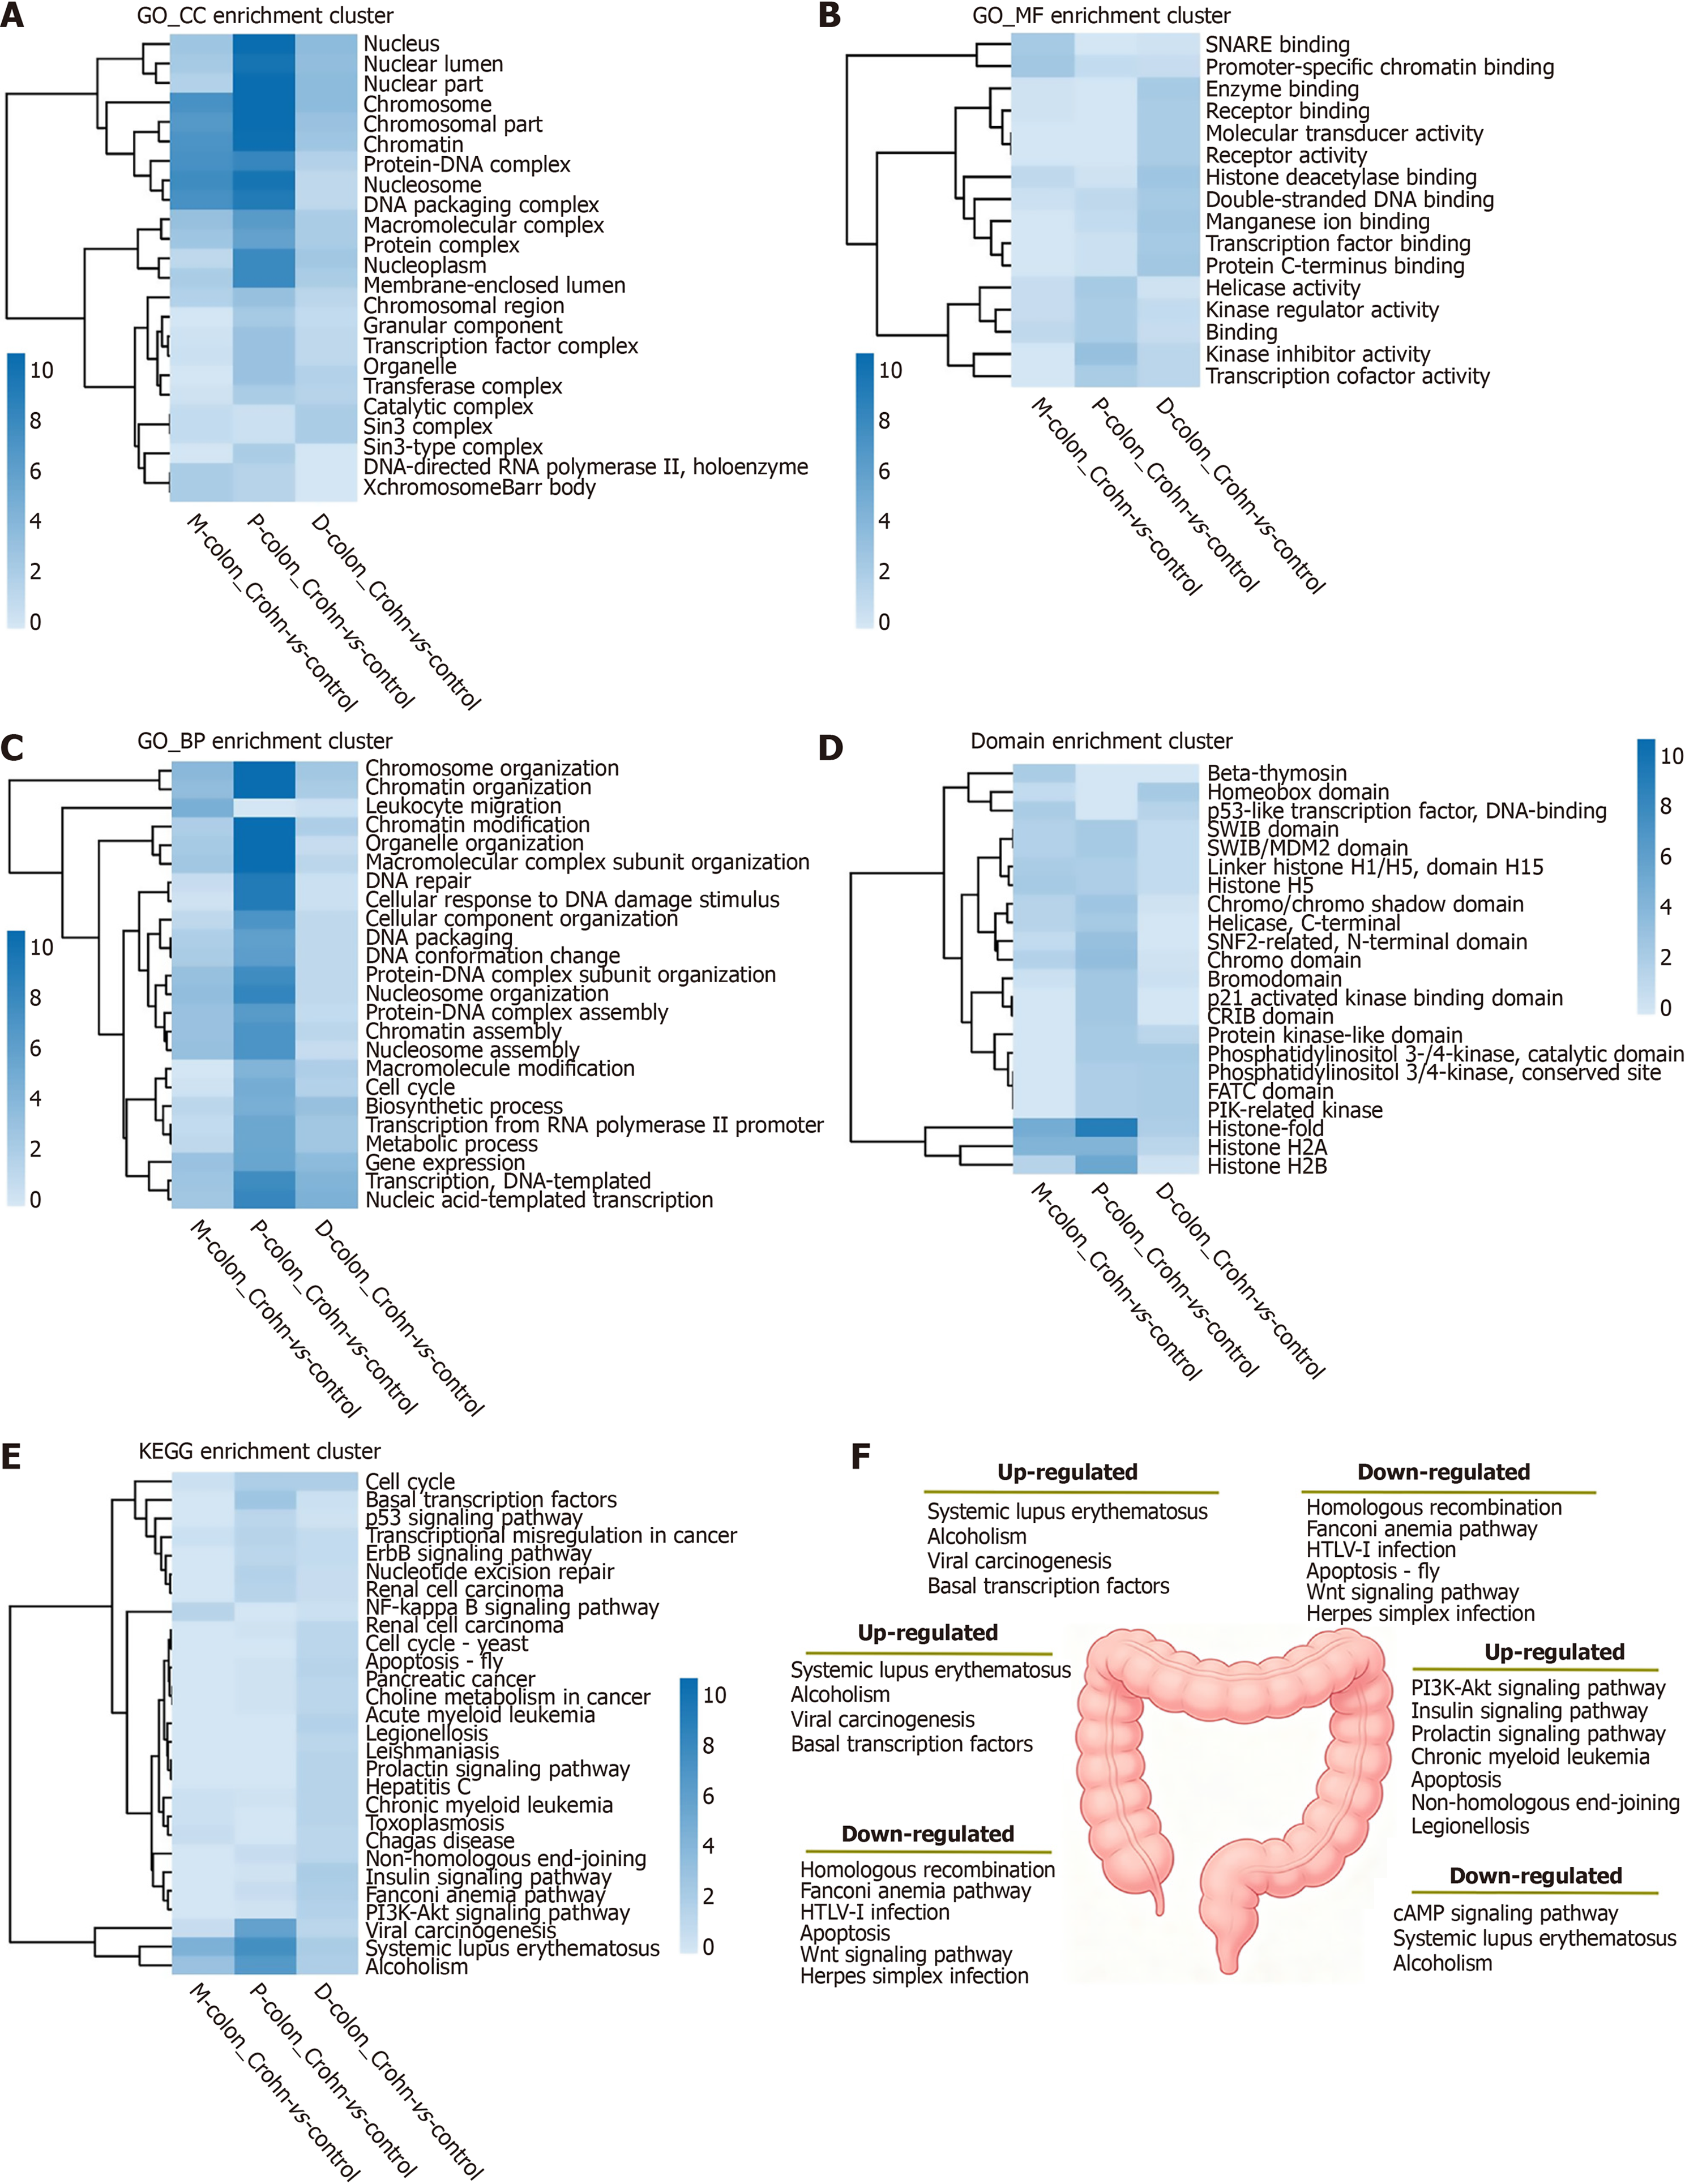
Figure 4 Segmentspecific enrichment clustering of differentially acetylated proteins.
A-E: Heatmaps showing upregulated enrichment clustering for cellular component (A), molecular function (B), biological process (C), domain architecture (D), and Kyoto Encyclopedia of Genes and Genomes pathways (E) across proximal-colon, mid-colon, and distal-colon tissues (Crohn’s disease model vs corresponding control). Color intensity represents the significance level [-log10 (P value)] of enrichment, with red indicating higher significance; F: Schematic summary of significantly up- and down-regulated enriched pathways in the three colonic segments under 2,4,6-trinitrobenzenesulfonic acid-induced colitis. KEGG: Kyoto Encyclopedia of Genes and Genomes; GO: Gene Ontology; CC: Cellular component; MF: Molecular function; BP: Biological process; P-colon: Proximal-colon; M-colon: Mid-colon; D-colon: Distal-colon; PI3K/Akt: Phosphatidylinositol 3-kinase/protein kinase B; HTLV: Human T-cell leukemia virus.
- Citation: Guo YJ, Wen J, Liu JX, Gao YN, Chen XW. Identification of region-specific signaling modules governing Crohn’s pathogenesis via mass spectrometry-based integrative acetyl-proteomics. World J Gastroenterol 2027; 33(1): 123358
- URL: https://www.wjgnet.com/1007-9327/full/v33/i1/123358.htm
- DOI: https://dx.doi.org/10.3748/wjg.123358