
















Copyright: ©Author(s) 2027.
World J Gastroenterol. Jan 7, 2027; 33(1): 123358
Published online Jan 7, 2027. doi: 10.3748/wjg.123358
Published online Jan 7, 2027. doi: 10.3748/wjg.123358
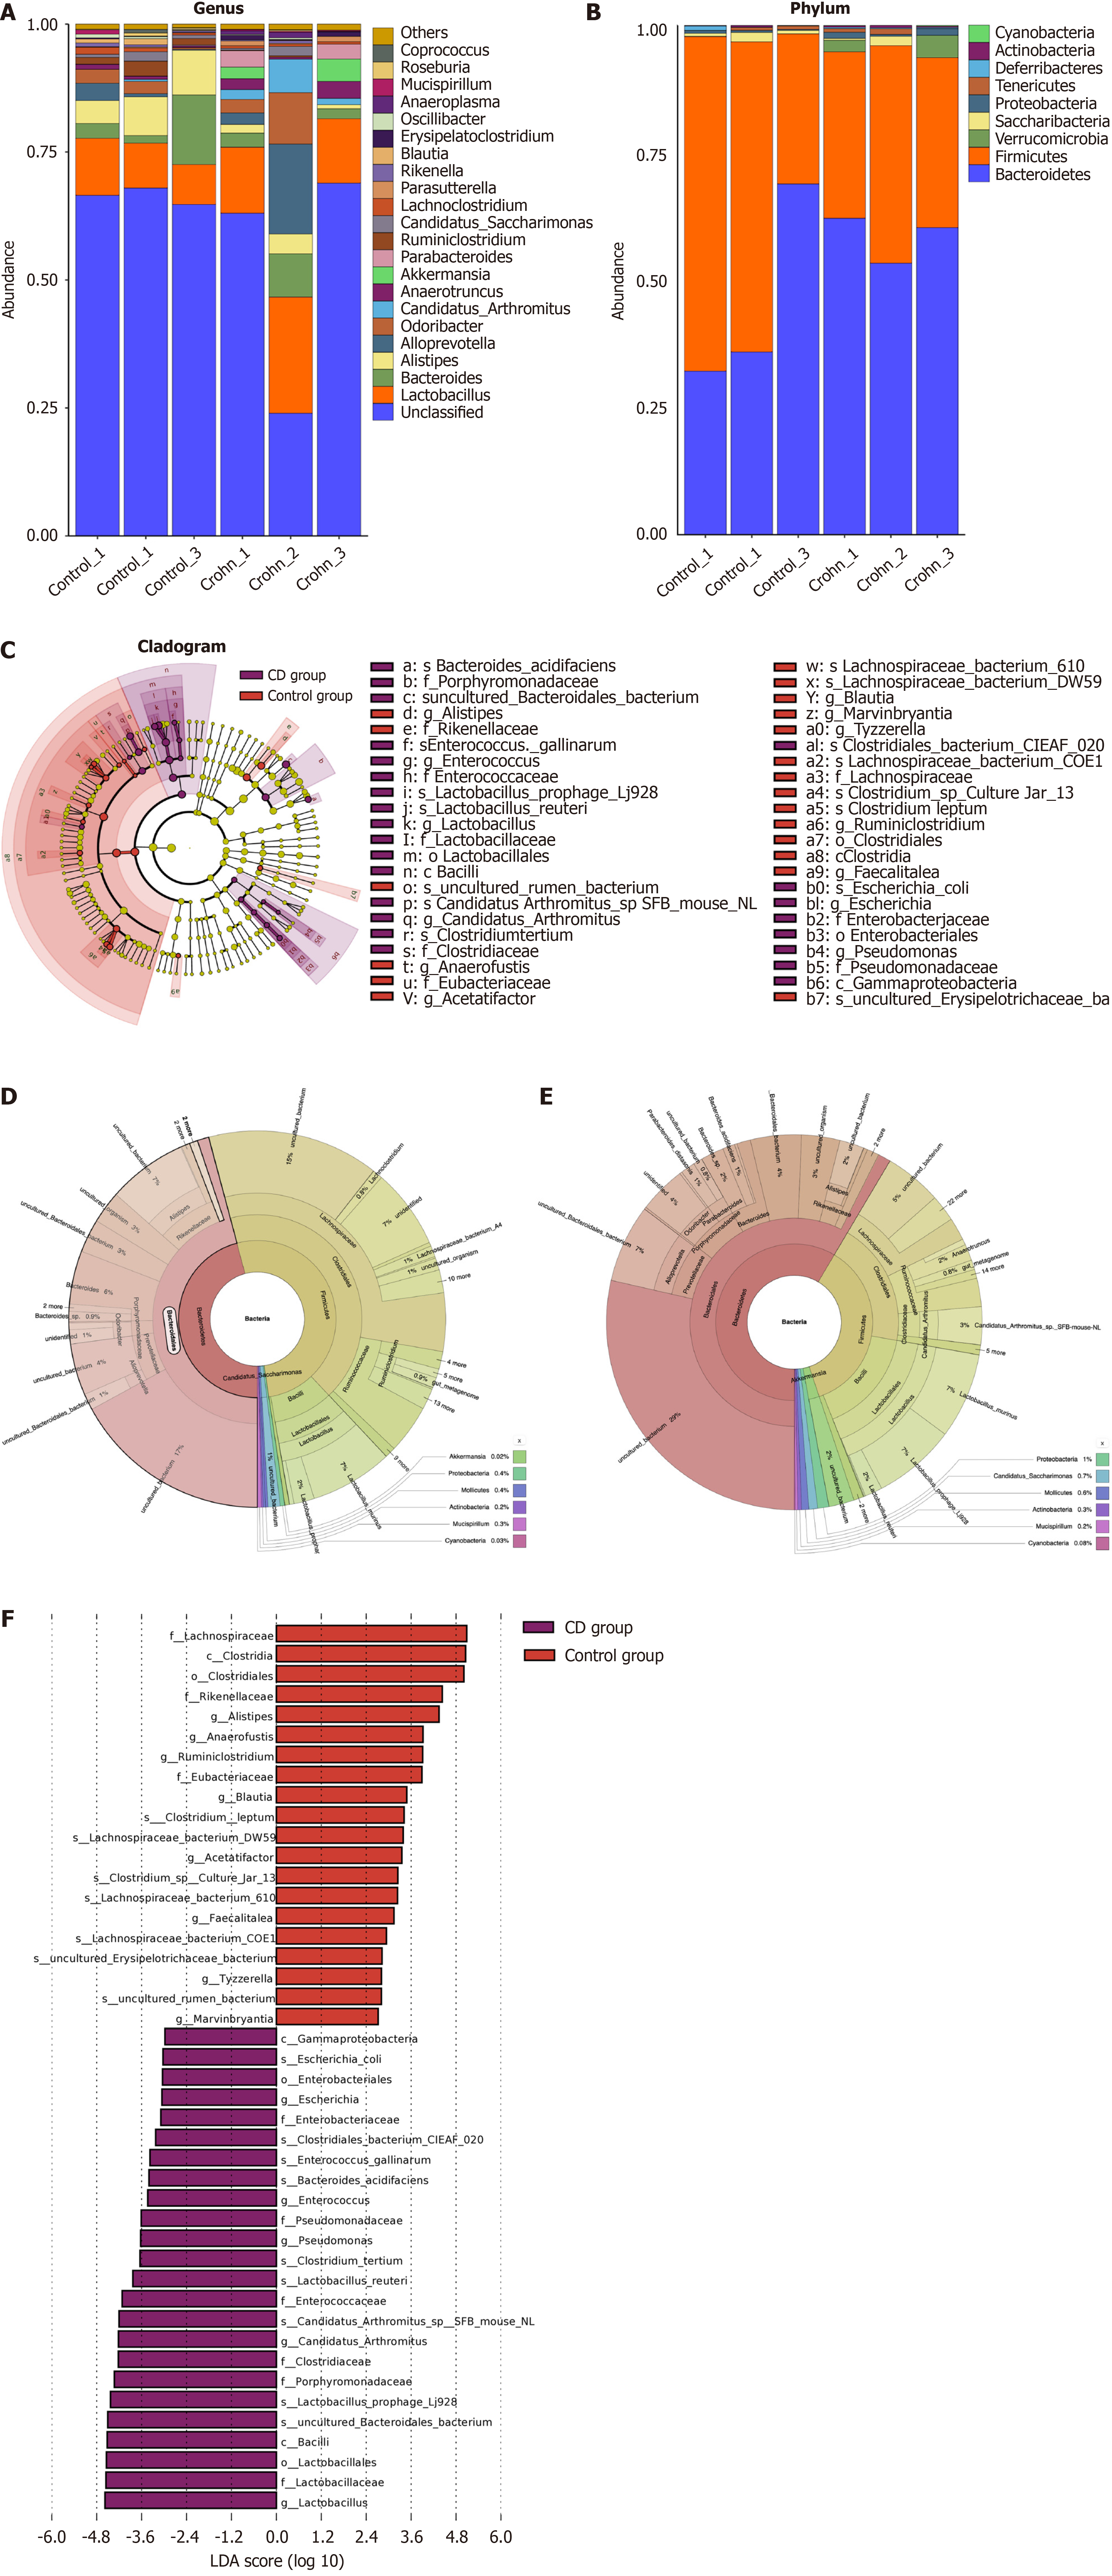
Figure 6 Compositional analysis of gut microbiota in control and Crohn’s disease model groups.
A and B: Bar charts showing the relative abun
- Citation: Guo YJ, Wen J, Liu JX, Gao YN, Chen XW. Identification of region-specific signaling modules governing Crohn’s pathogenesis via mass spectrometry-based integrative acetyl-proteomics. World J Gastroenterol 2027; 33(1): 123358
- URL: https://www.wjgnet.com/1007-9327/full/v33/i1/123358.htm
- DOI: https://dx.doi.org/10.3748/wjg.123358