Copyright
©The Author(s) 2016.
World J Gastroenterol. Jun 21, 2016; 22(23): 5353-5363
Published online Jun 21, 2016. doi: 10.3748/wjg.v22.i23.5353
Published online Jun 21, 2016. doi: 10.3748/wjg.v22.i23.5353
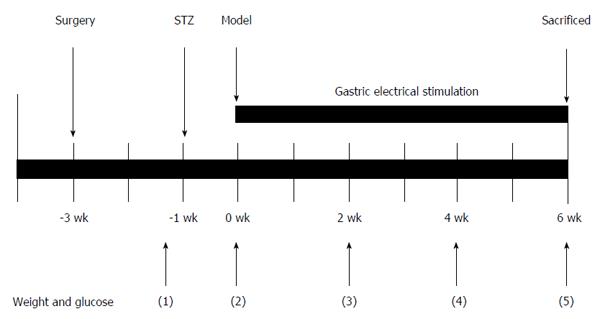
Figure 1 Schematic representation of the gastric electrical stimulation study protocol.
After surgery of electrode implantation, the rats had 2 wk to recover from the surgery. After streptozotocin injection, the diabetic rats were randomized into four large groups depending on the parameter of gastric electrical stimulation (GES): DM (diabetic group) + SGES (diabetic with sham GES), DM + GES1 (GES parameter 1), DM + GES2 and DM + GES3 groups for 6 wk. GES was adopted for 30 min/d, 7 d/wk during the whole process of the experiment. The body weights and blood glucose levels were measured before the injection of STZ and during weeks 0, 2, 4, and 6 after the induction of diabetes.
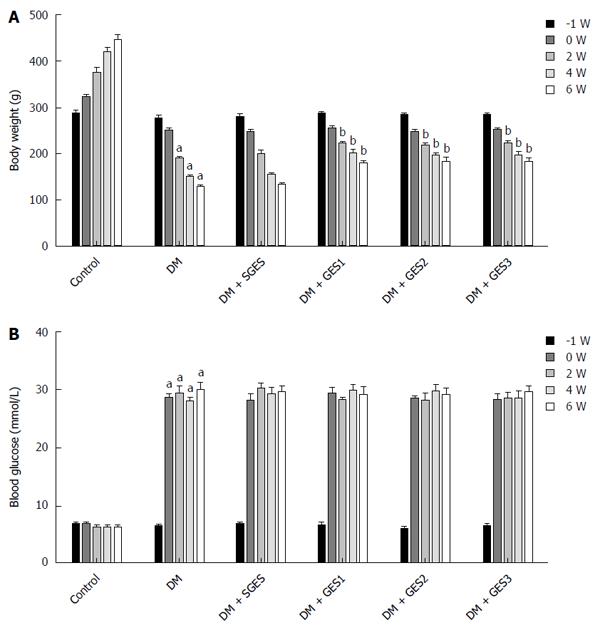
Figure 2 Body weights and blood glucose levels at different time points in different groups.
A: The body weights of the diabetic rats were obviously decreased compared with the controls at 6 wk (P < 0.05). The weights in all GES groups were increased compared with the DM (diabetic group) (P < 0.05). There was no significant difference between the DM and DM + SGES groups (P > 0.05); B: Compared with the control group, the blood glucose level of the DM group was significantly increased at weeks 0, 2, 4 and 6 (P < 0.05 for all). aP < 0.05 vs control; bP < 0.05 vs DM group.
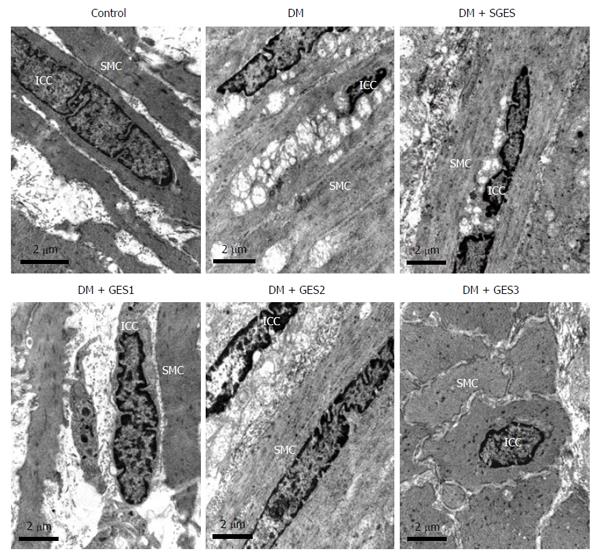
Figure 3 Electron microscopy of interstitial cells of Cajal in each group.
In the DM (diabetic) and SGES (diabetic with sham GES) groups, interstitial cells of Cajal (ICCs) were markedly affected compared with the control group, while they appeared to be almost normal in structure or had minor damage in the DM (diabetic group) + GES1 (GES parameter 1), DM + GES2 and DM + GES3 groups. Scale bars = 2 μm.
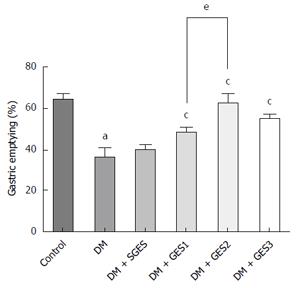
Figure 4 Effects of gastric electrical stimulation on gastric emptying.
Compared with the control group, gastric emptying in the DM group was significantly delayed (P < 0.01). However, gastric electrical stimulation (GES) significantly improved the delayed gastric emptying (P < 0.01 for all). Meanwhile, significance was found between the DM (diabetic group) + GES1 (GES parameter 1) group and DM + GES2 group (P = 0.0275). aP < 0.05 vs control; cP < 0.05 vs DM group; eP < 0.05, DM + GES1 vs DM + GES2 group.
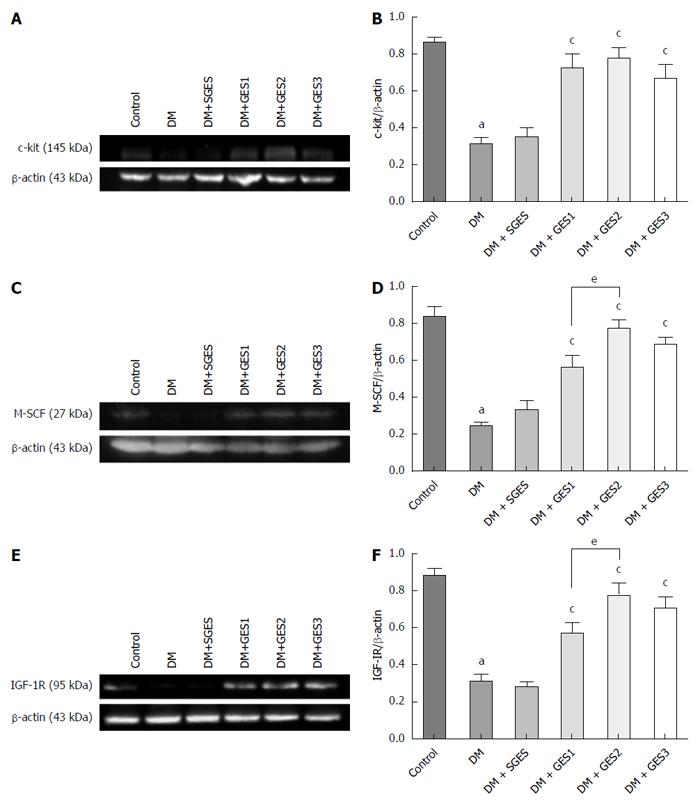
Figure 5 Expression levels of related proteins quantified by Western blot.
A, B: The expression of c-kit in different groups; C, D: The expression of M-SCF in different groups; E, F: The expression of IGF-1R in different groups. aP < 0.05 vs control; cP < 0.05 vs DM (diabetic group) group; eP < 0.05, DM + GES1 (GES parameter 1) vs DM + GES2 group. GES: Gastric electrical stimulation.
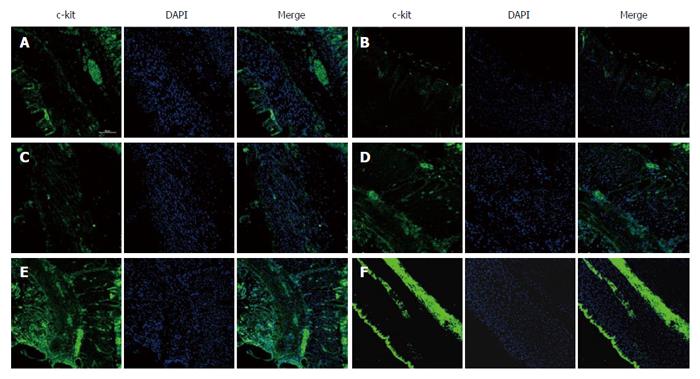
Figure 6 Confocal micrographs of interstitial cells of Cajal.
Interstitial cells of Cajal (ICCs) were labelled with c-kit (green) and DAPI (blue). ICCs were abundant in the control group (A). Few ICCs were observed in the DM group (B). Similar changes in ICCs were found in the SGES (diabetic with sham GES) group (C). However, numerous ICCs were observed in the DM (diabetic group) + GES1 (GES parameter 1) group (D), DM + GES2 group (E) and DM + GES3 group (F). Scale bars = 100 μm. GES: Gastric electrical stimulation.
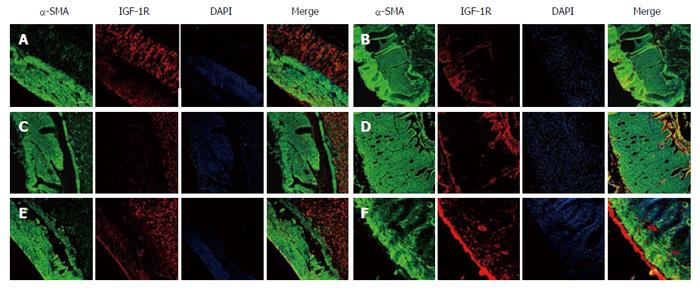
Figure 7 Confocal micrographs showing the distribution of insulin-like growth factor 1 receptor.
The smooth muscle cells were labelled with α-SMA (green), IGF-1R (red) and DAPI (blue). IGF-1R expression was high in the control group (A). Weak IGF-1R signals were found in the DM group (B), and similar changes appeared in the SGES group (diabetic with sham GES) (C). Strong IGF-IR signals were captured in the DM (diabetic group) + GES1 (GES parameter 1) group (D), DM + GES2 group (E) and DM + GES3 group (F). Scale bars = 100 μm. DM: and GES parameter 1. GES: Gastric electrical stimulation; IGF: Insulin-like growth factor.
- Citation: Li H, Chen Y, Liu S, Hou XH. Long-pulse gastric electrical stimulation protects interstitial cells of Cajal in diabetic rats via IGF-1 signaling pathway. World J Gastroenterol 2016; 22(23): 5353-5363
- URL: https://www.wjgnet.com/1007-9327/full/v22/i23/5353.htm
- DOI: https://dx.doi.org/10.3748/wjg.v22.i23.5353


