Copyright
©The Author(s) 2016.
World J Gastroenterol. Jun 21, 2016; 22(23): 5353-5363
Published online Jun 21, 2016. doi: 10.3748/wjg.v22.i23.5353
Published online Jun 21, 2016. doi: 10.3748/wjg.v22.i23.5353
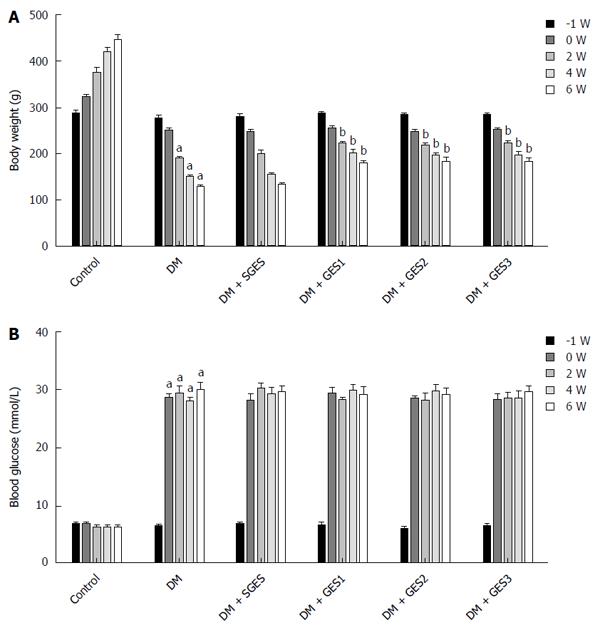
Figure 2 Body weights and blood glucose levels at different time points in different groups.
A: The body weights of the diabetic rats were obviously decreased compared with the controls at 6 wk (P < 0.05). The weights in all GES groups were increased compared with the DM (diabetic group) (P < 0.05). There was no significant difference between the DM and DM + SGES groups (P > 0.05); B: Compared with the control group, the blood glucose level of the DM group was significantly increased at weeks 0, 2, 4 and 6 (P < 0.05 for all). aP < 0.05 vs control; bP < 0.05 vs DM group.
- Citation: Li H, Chen Y, Liu S, Hou XH. Long-pulse gastric electrical stimulation protects interstitial cells of Cajal in diabetic rats via IGF-1 signaling pathway. World J Gastroenterol 2016; 22(23): 5353-5363
- URL: https://www.wjgnet.com/1007-9327/full/v22/i23/5353.htm
- DOI: https://dx.doi.org/10.3748/wjg.v22.i23.5353


