Copyright
©The Author(s) 2016.
World J Gastroenterol. Jun 21, 2016; 22(23): 5353-5363
Published online Jun 21, 2016. doi: 10.3748/wjg.v22.i23.5353
Published online Jun 21, 2016. doi: 10.3748/wjg.v22.i23.5353
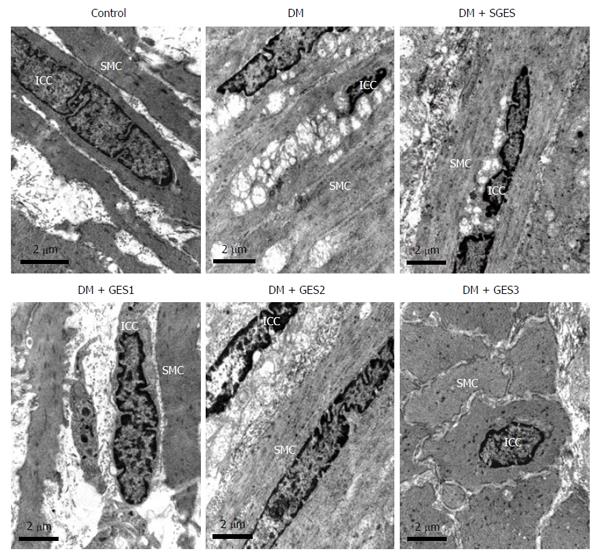
Figure 3 Electron microscopy of interstitial cells of Cajal in each group.
In the DM (diabetic) and SGES (diabetic with sham GES) groups, interstitial cells of Cajal (ICCs) were markedly affected compared with the control group, while they appeared to be almost normal in structure or had minor damage in the DM (diabetic group) + GES1 (GES parameter 1), DM + GES2 and DM + GES3 groups. Scale bars = 2 μm.
- Citation: Li H, Chen Y, Liu S, Hou XH. Long-pulse gastric electrical stimulation protects interstitial cells of Cajal in diabetic rats via IGF-1 signaling pathway. World J Gastroenterol 2016; 22(23): 5353-5363
- URL: https://www.wjgnet.com/1007-9327/full/v22/i23/5353.htm
- DOI: https://dx.doi.org/10.3748/wjg.v22.i23.5353


