Copyright
©The Author(s) 2016.
World J Gastroenterol. Jun 21, 2016; 22(23): 5353-5363
Published online Jun 21, 2016. doi: 10.3748/wjg.v22.i23.5353
Published online Jun 21, 2016. doi: 10.3748/wjg.v22.i23.5353
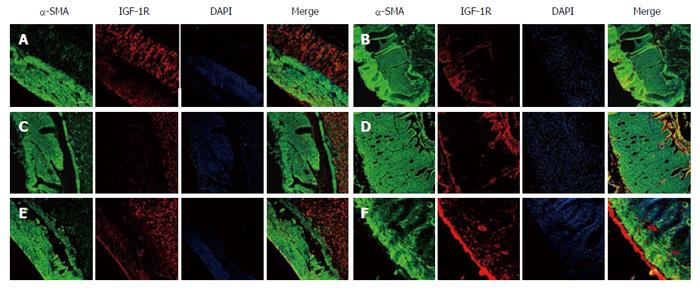
Figure 7 Confocal micrographs showing the distribution of insulin-like growth factor 1 receptor.
The smooth muscle cells were labelled with α-SMA (green), IGF-1R (red) and DAPI (blue). IGF-1R expression was high in the control group (A). Weak IGF-1R signals were found in the DM group (B), and similar changes appeared in the SGES group (diabetic with sham GES) (C). Strong IGF-IR signals were captured in the DM (diabetic group) + GES1 (GES parameter 1) group (D), DM + GES2 group (E) and DM + GES3 group (F). Scale bars = 100 μm. DM: and GES parameter 1. GES: Gastric electrical stimulation; IGF: Insulin-like growth factor.
- Citation: Li H, Chen Y, Liu S, Hou XH. Long-pulse gastric electrical stimulation protects interstitial cells of Cajal in diabetic rats via IGF-1 signaling pathway. World J Gastroenterol 2016; 22(23): 5353-5363
- URL: https://www.wjgnet.com/1007-9327/full/v22/i23/5353.htm
- DOI: https://dx.doi.org/10.3748/wjg.v22.i23.5353


