Copyright
©The Author(s) 2016.
World J Biol Chem. Feb 26, 2016; 7(1): 188-205
Published online Feb 26, 2016. doi: 10.4331/wjbc.v7.i1.188
Published online Feb 26, 2016. doi: 10.4331/wjbc.v7.i1.188
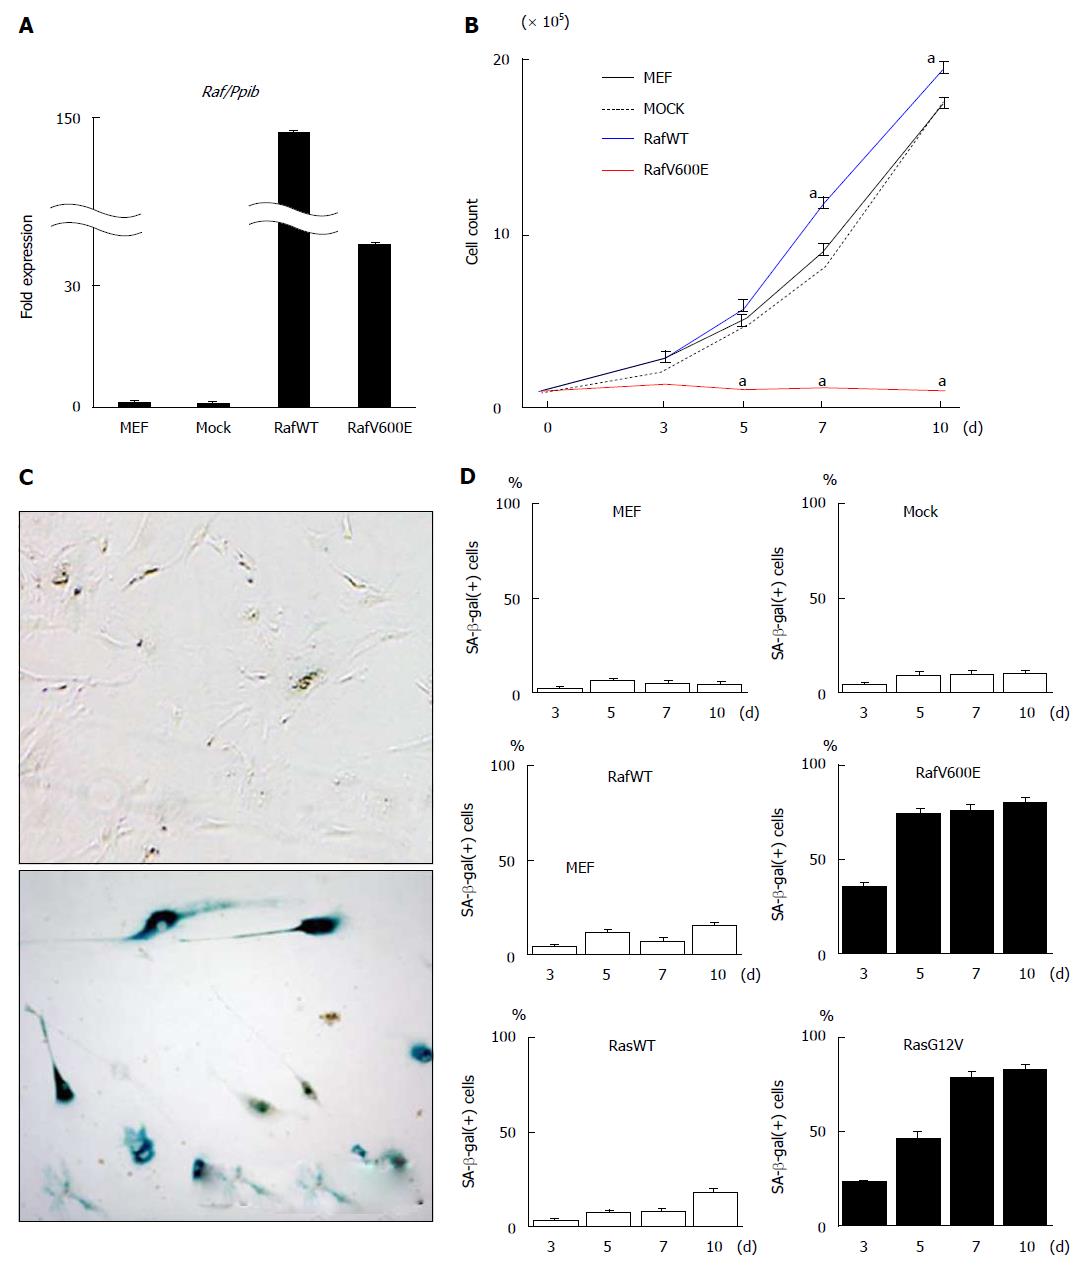
Figure 1 Induction of cellular senescence in mouse embryonic fibroblast by oncogenic Raf.
A: Induction of Raf by retroviral infection. Retrovirus was infected to MEFs on day -2 to induce the expression of wild type Raf (RafWT) or oncogenic Raf (RafV00E). RNA was collected on day 7, and the expression level of BRAF was analyzed by real-time RT-PCR to confirm expression induction; B: Growth curve. Retrovirus was infected into MEFs on day -2. After two days (day 0), the cell number was counted to draw the growth curve. Cells that were infected with mock retrovirus Mock cells (black dotted line) showed cellular growth similar to that of MEF cells without infection (black line), and RafWT cells (blue line) showed slightly but significantly faster growth than did MEF cells without infection. RafV600E cells hardly showed cellular growth (red line). aP < 0.05 (t); C: SA-β-gal staining. Compared with MEF cells on day 7 (above), RafV600E cells on day 7 (bottom) showed positive staining of SA-β-gal; D: Count of SA-β-gal(+) cells. The number of SA-β-gal(+) cells was counted on days 3, 5, 7, and 10. MEF cells without virus infection rarely showed SA-β-gal(+) cells. While mock cells and RafWT cells did not show a marked increase in the number of SA-β-gal(+) cells, RafV600E cells showed a marked increase in the number of SA-β-gal(+) cells after day 5 (73.3% ± 2.9% on day 5). When cells were infected with retrovirus of oncogenic Ras (RasG12V) and wild type Ras (RasWT) as previous study[22], RasG12V cells showed marked increase of SA-β-gal(+) cells after day 7 (showed 78.3% ± 4.5% on day 7), while RasWT cells did not until day 10. The mean and standard error in three repeated experiments were shown. MEF: Mouse embryonic fibroblast.
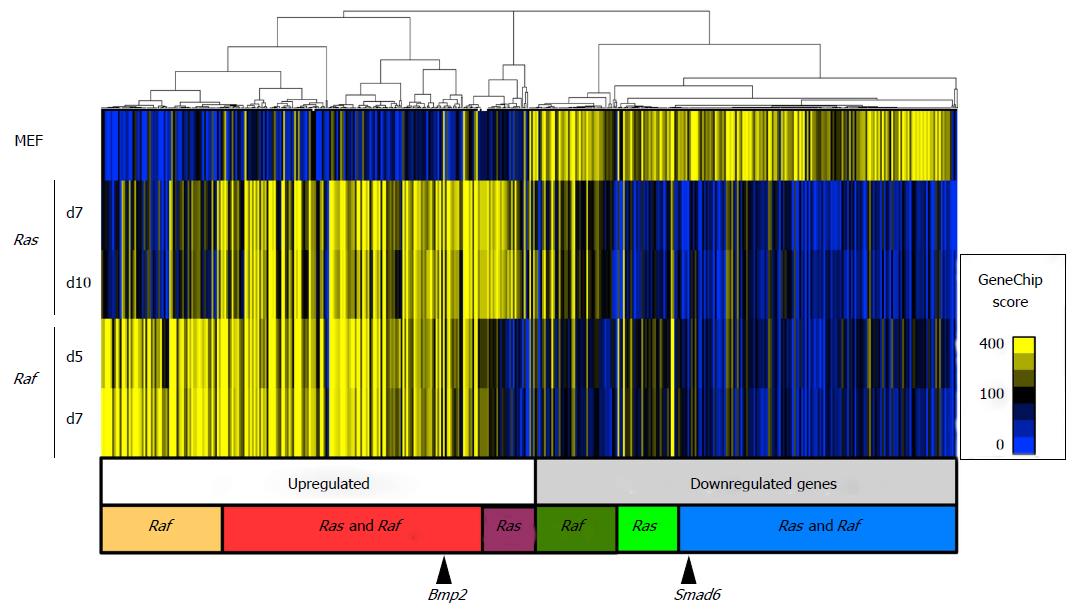
Figure 2 Hierarchical clustering analysis of genes altering expression levels during senescence.
Gene expression levels were analyzed for 15653 genes using microarray for MEF cells, and RafV600E cells on days 5 and 7. For senescence induced by oncogenic Ras (RasG12V), RasG12V cells on days 7 and 10 were analyzed in our previous study, and compared with Raf. A total of 729 probes showing an expression level higher than 100 in GeneChip score in any of the five samples, and showing either > 5-fold upregulation or > 0.2-fold downregulation in any RafV600E or RasG12V samples compared with MEF, were extracted for clustering analysis. The major cluster for upregulated genes consisted of three subclusters: Genes upregulated specifically in Raf-induced senescence, those commonly upregulated in Ras- and Raf-induced senescence, and those upregulated specifically in Ras-induced senescence. The other major cluster for downregulated genes also contained three subgroups of genes, albeit not very clear: Genes downregulated specifically in Raf-induced senescence or Ras-induced senescence, and those commonly downregulated in Ras- and Raf-induced senescence. Bmp2 was included in commonly upregulated genes and Smad6 was included in commonly downregulated genes (black arrows). MEF: Mouse embryonic fibroblast.
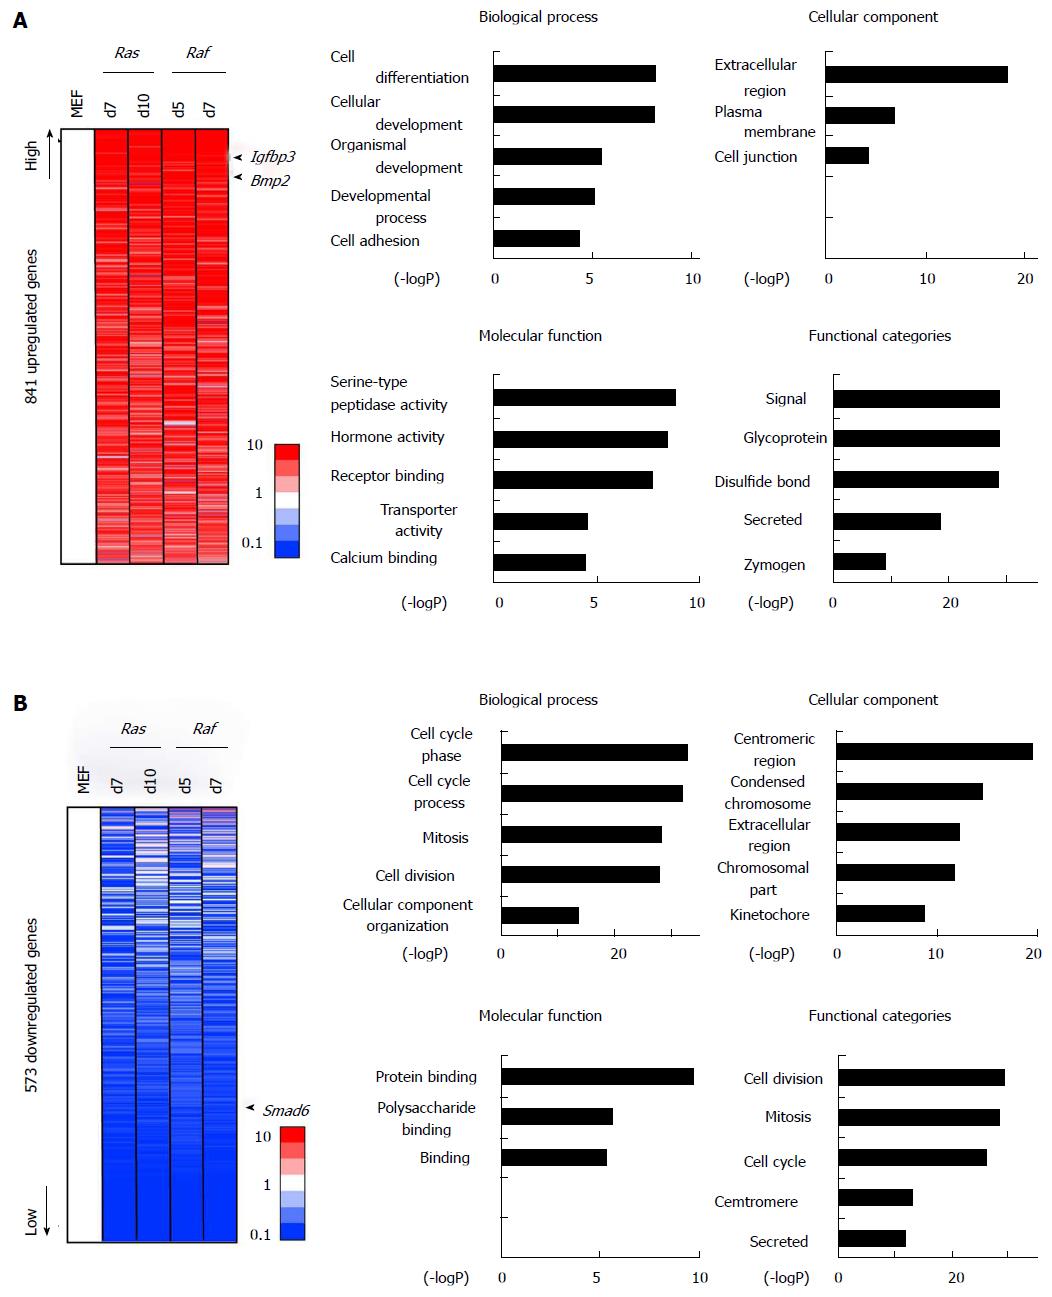
Figure 3 Gene annotation enrichment analysis for commonly altered genes.
A: Commonly upregulated genes. A total of 841 genes showed > 5-fold upregulation commonly in either of RasG12V cells on days 7 (Ras d7) and 10 (Ras d10) and in either of RafV600E cells on days 5 (Raf d5) and 7 (Raf d7), compared with MEF. More upregulated genes were sorted upward. Gene annotation enrichment was analyzed for biological process, cellular component, molecular function, and functional categories. Genes associated with signal/secreted proteins (P = 3.8 × 10⁻³⁰), extracellular regions (P = 5.3 × 10⁻¹⁹), and cell differentiation/development (P = 6.1 × 10⁻⁹), e.g., Bmp2 and Igfbp3, were upregulated; B: Commonly downregulated genes. A total of 573 genes showed < 0.2-fold downregulation commonly in either of the two RasG12V cells and in either of the two RafV600E cells, compared with MEF. More downregulated genes were sorted downward. Gene annotation enrichment analysis showed that genes related to cell cycle (P = 1.3 × 10⁻³³) such as Cdc6 were significantly enriched, in good agreement with growth arrest. Genes associated with secreted protein (P = 2.0 × 10⁻¹²) and extracellular region (P = 5.4 × 10⁻¹³) such as Cxcl5 and Wnt4 were also enriched, suggesting that the dynamic activation and repression of secreted factors occurred commonly during Ras- and Raf-induced senescence. The GO-term “protein binding” also showed significant enrichment, and Smad6 was included in this term. MEF: Mouse embryonic fibroblast.
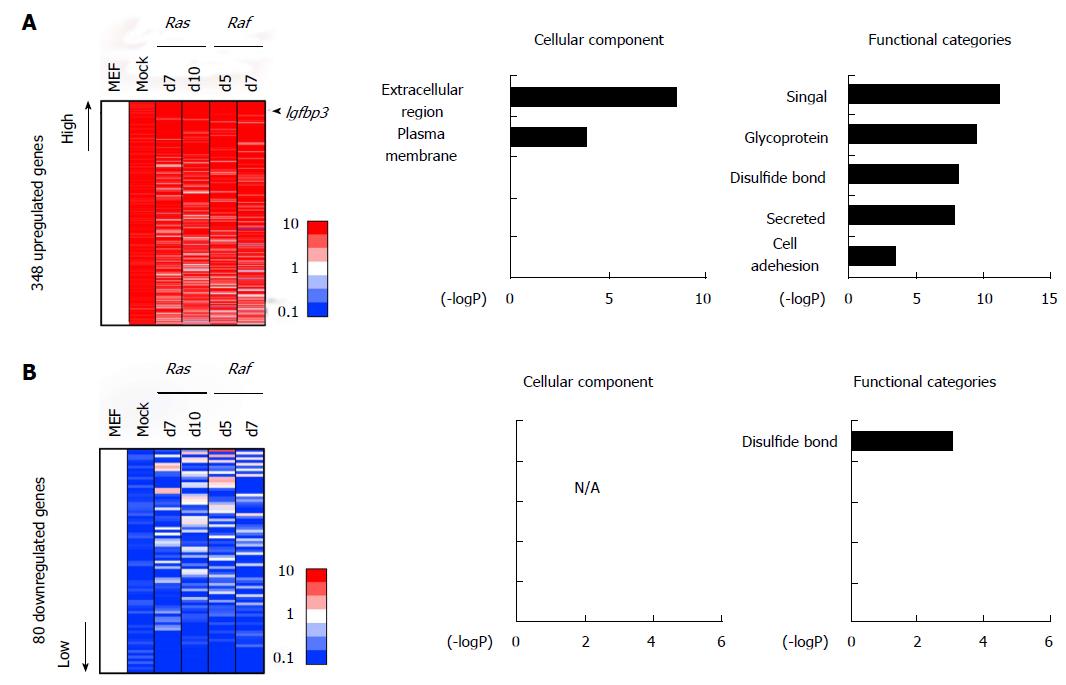
Figure 4 Genes altered commonly in Ras-/Raf-induced senescence and in mock cells.
A: Commonly upregulated genes. There were 348 genes showing > 5-fold upregulation commonly in mock cells, in either of the two RasG12V cells and in either of the two RafV600E cells, compared with MEF. Genes associated with signal/secreted proteins proteins (P = 6.7 × 10⁻¹²) or extracellular regions (P = 3.3 × 10⁻⁹), e.g., Igfbp3 and Cd5l, were significantly enriched in these genes. B: Commonly downregulated genes. There were 80 genes, e.g., Cdc6 and Wnt4, showing < 0.2-fold downregulation commonly in mock cells, in either of two RasG12V cells and in either of two RafV600E cells, compared with MEF. Genes related to disulfide bond were significantly enriched. MEF: Mouse embryonic fibroblast.
Figure 5 Genes altered commonly in Ras-/Raf-induced senescence but not in mock cells.
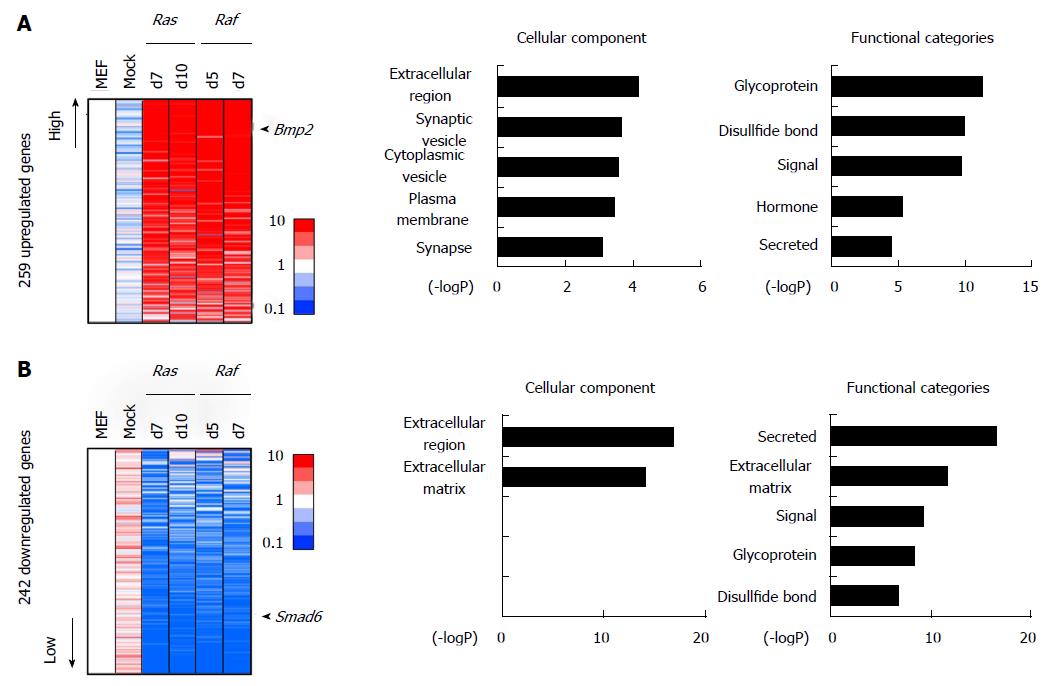
A: Genes upregulated commonly, but not in mock cells. There were 259 genes showing > 5-fold upregulation commonly in either of the two RasG12V cells and in either of the two RafV600E cells, but not in mock cells. Genes associated with signal/secreted proteins (P = 1.8 × 10⁻¹⁰) or extracellular regions (P = 7.0 × 10⁻⁵), e.g., Bmp2, were significantly enriched in these genes; B: Genes downregulated commonly, but not in mock cells. There were 242 genes, e.g., Smad6, showing < 0.2-fold downregulation commonly in either of the two RasG12V cells and in either of the two RafV600E cells, but not in mock cells. Genes associated with signal/secreted protein (P = 2.3 × 10⁻¹⁷) or extracellular region (P = 1.3 × 10⁻¹⁷) were significantly enriched, e.g., Cxcl5.
Figure 6 Gene annotation enrichment analysis for specifically altered genes.
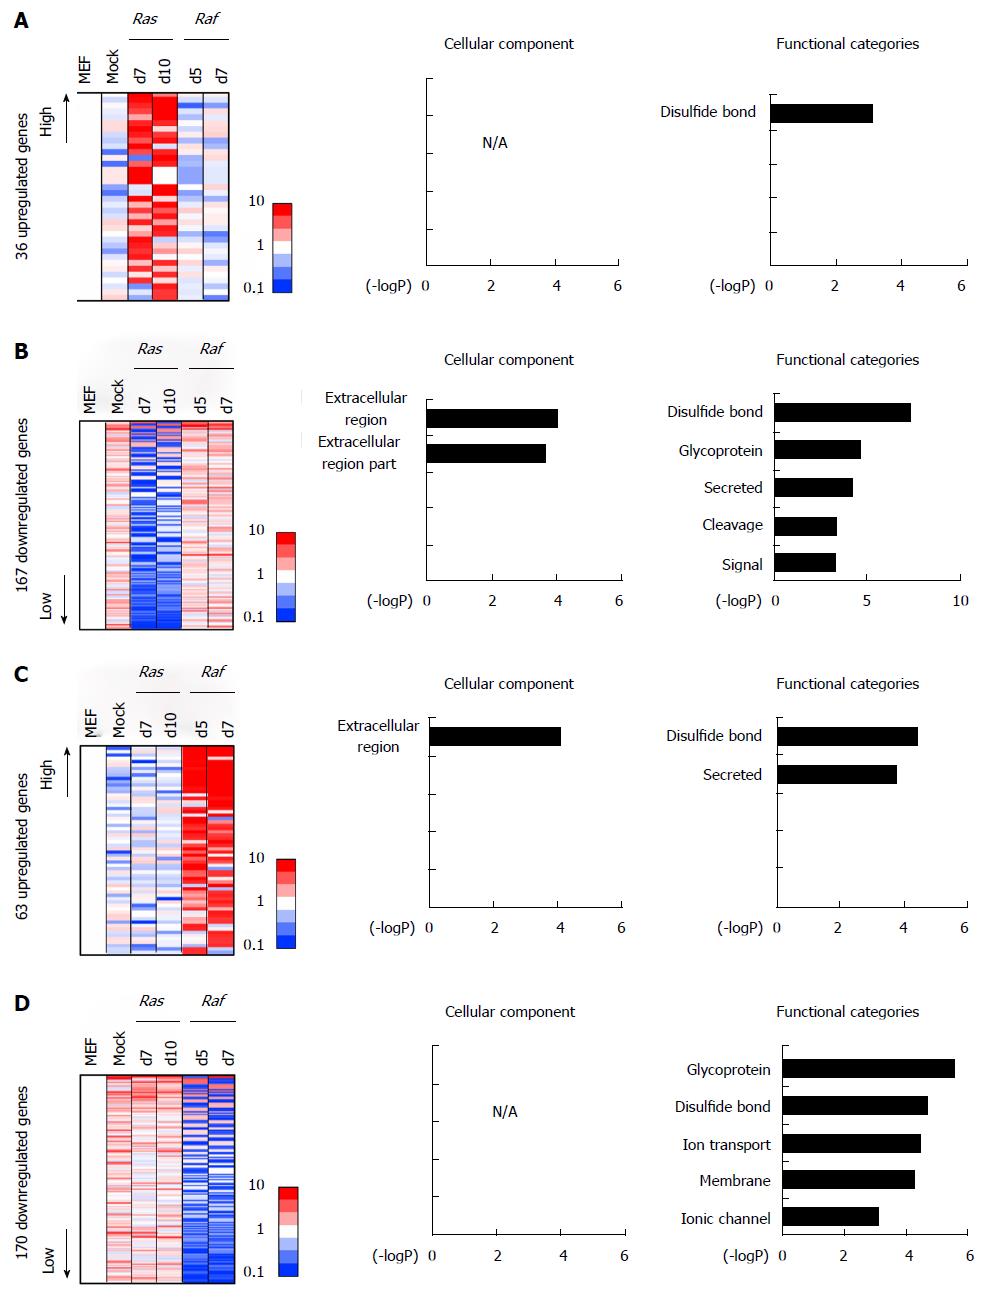
A: Genes specifically upregulated in Ras-induced senescence. A total of 36 genes showed > 5-fold expression in either of the two RasG12V cells, but showed < 1.5-fold expression in both RafV600E cells and in mock cells, compared with MEF cells. Gene annotation enrichment analysis did not reveal any significant enrichment of GO-terms other than “disulfide bond”; B: Genes specifically downregulated in Ras-induced senescence. A total of 167 genes showed < 0.2-fold expression in either of the two RasG12V cells, but showed > 0.65-fold expression in both RafV600E cells and in mock cells, compared with MEF cells. Gene annotation enrichment was analyzed, showing a significant enrichment of genes associated with signal/secreted factors, e.g., Wnt; C: Genes specifically upregulated in Raf-induced senescence. A total of 63 genes showed > 5-fold expression in either of the two RafV600E cells, but showed < 1.5-fold expression in both RasG12V cells and in mock cells, compared with MEF cells. Gene annotation enrichment analysis showed significant enrichment of genes associated with secreted proteins, e.g., Cd40; D: Genes specifically downregulated in Raf-induced senescence. A total of 170 genes showed < 0.2-fold expression in either of the two RafV600E cells, but showed > 0.65-fold expression in both RasG12V cells and in mock cells, compared with MEF cells. Gene annotation enrichment analysis showed a significant enrichment of genes related to membrane, e.g., Mcam. MEF: Mouse embryonic fibroblast.
Figure 7 Knockdown of Bmp2 and overexpression of Smad6 inhibited growth arrest by Raf.
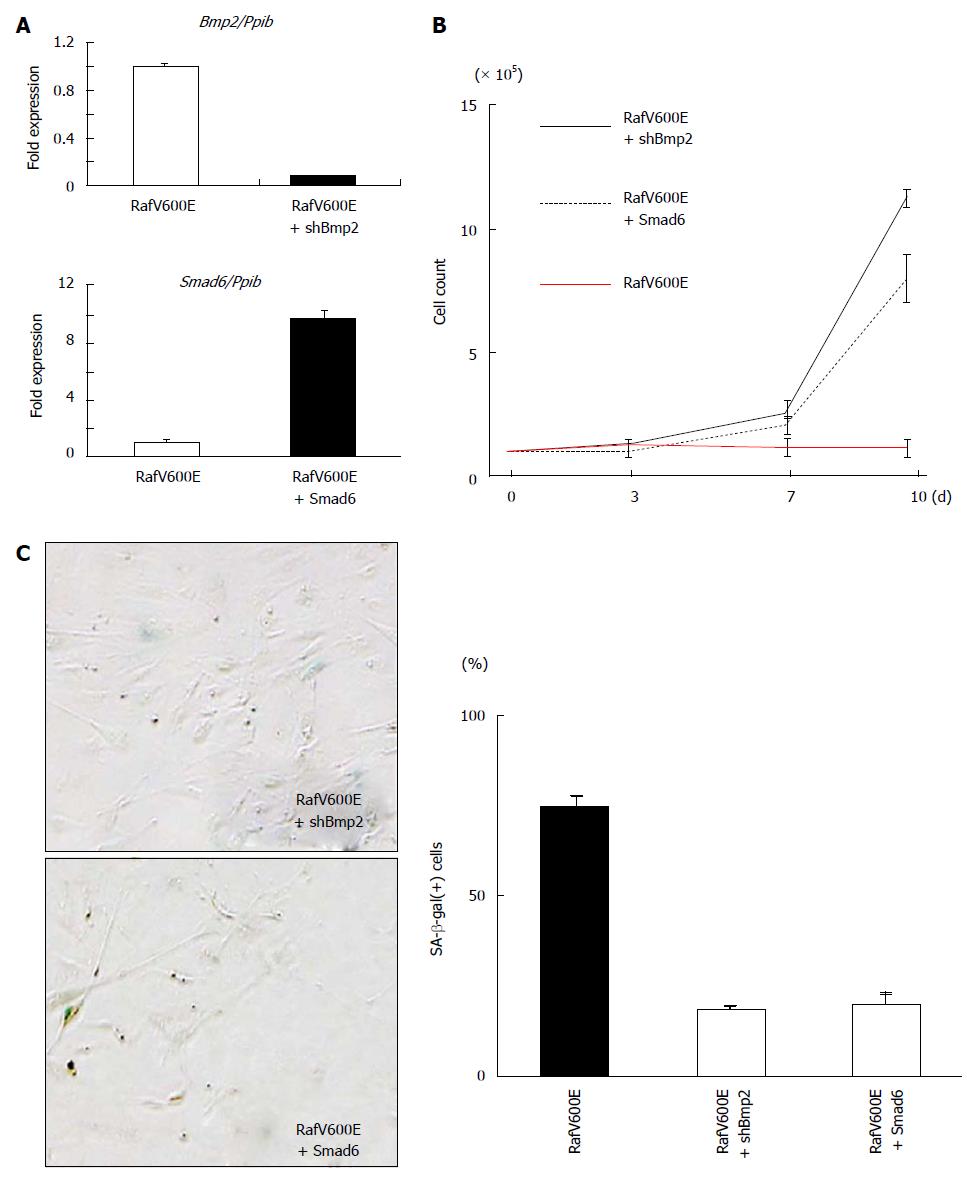
A: Real-time-PCR for Bmp2 and Smad6, normalized to Ppib. Fold expression levels compared to RafV600E cells are shown. Knockdown of Bmp2 expression by shRNA and induction of Smad6 expression by retrovirus infection were confirmed. Mean and standard error in triplicated samples are shown; B: Growth curve of RafV600E + shBmp2 and RafV600E + Smad6 cells. While RafV600E cells showed growth arrest, Bmp2-knocked-down RafV600E cells (RafV600E + shBmp2, black line) and Smad6-overexpressed RafV600E cells (RafV600E + Smad6, black dotted line) showed continual growth and escape from Raf-induced senescence; C: Count of SA-β-gal(+) cells. Compared with RafV600E cells, Bmp2-knocked-down RafV600E cells (RafV600E + shBmp2) and Smad6-overexpressed RafV600E cells (RafV600E + Smad6) rarely showed SA-β-gal(+) cells. Mean and standard error in three repeated experiments are shown. SA-β-gal: Senescence-associated β-galactosidase.
Figure 8 Epigenetic alteration of the Bmp2 and Smad6 locus in Raf-induced senescence.
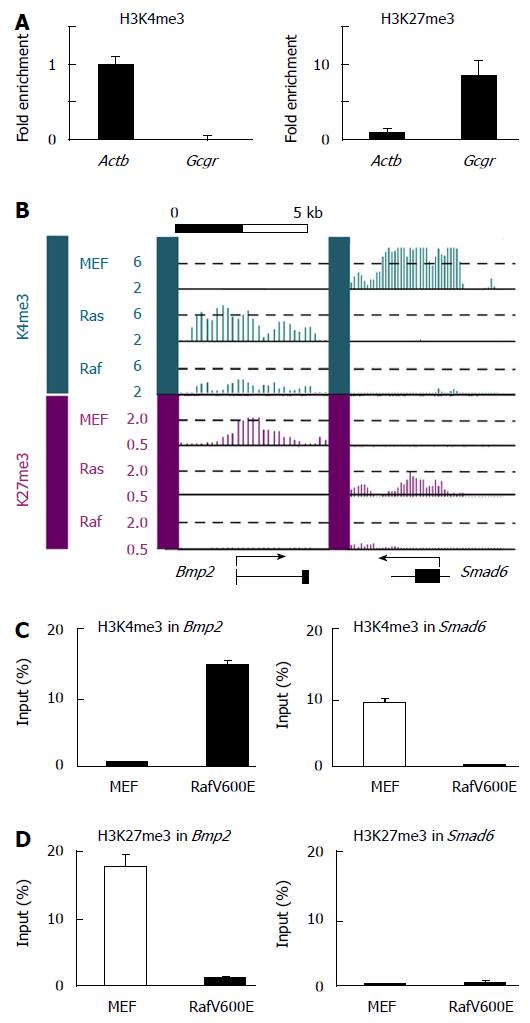
A: Real-time ChIP-PCR for H3K4me3 and H3K27me3 in RafV600E cells on day 7. Relative enrichment compared with Actb was shown, and it was confirmed that ChIP was performed properly. Actb was positive control region for H3K4me3 and Gcgr was positive control for H3K27me3; B: H3K4me3 and HK27me3 mapped by ChIP-sequencing. Y-axis, the number of mapped reads per 1000000 reads, within a window (300bp for H3K4me3 and 500bp for H3K27me3). The Bmp2 locus showed H3K27me3 mark, but no H3K4me3 mark, in MEF cells. Loss of H3K27me3 and gain of H3K4me3 were detected commonly in Ras- and Raf-induced senescence. The Smad6 locus showed H3K4me3 mark, but no H3K27me3 mark, in MEF cells. Loss of H3K4me3 was detected commonly in Ras- and Raf-induced senescence, but gain of H3K27me3 was detected specifically in Ras-induced senescence; C: Validation of the epigenetic status of the Bmp2 locus by ChIP-PCR. Loss of H3K27me3 and gain of H3K4me3 in RafV600E cells were confirmed. We repeated ChIP assay twice, and obtained the similar results by ChIP-PCR using those ChIP products; D: Validation of the epigenetic status of the Smad6 locus by ChIP-PCR. Loss of H3K4me3 and no gain of H3K27me3 in RafV600E cells were confirmed. We repeated ChIP assay twice, and obtained the similar results by ChIP-PCR using those ChIP products. MEF: Mouse embryonic fibroblast.
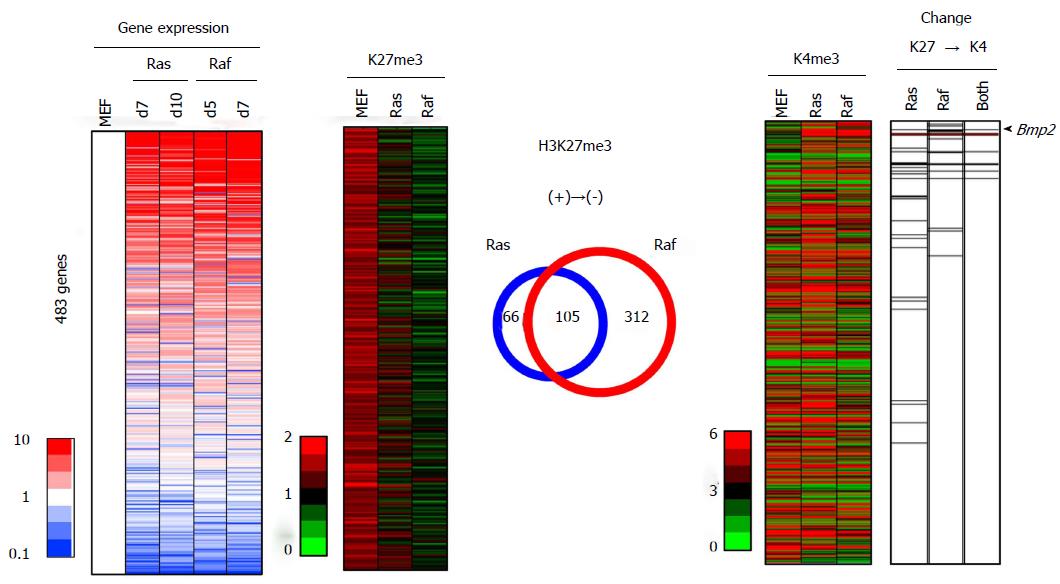
Figure 9 Integrated analysis of epigenetic and expression changes for genes losing H3K27me3.
A total of 483 genes showed > 1.5 reads per 1000000 reads in MEF, but decreased to < 1.0 in both or either Ras- and Raf-induced senescence, and were sorted by the fold expression change between MEF and mean of RasG12V cells and RafV600E cells (left). Among these 483 genes losing H3K27me3 in senescence, 27 genes in Ras-induced senescence and 18 genes in Raf-induced senescence showed loss of H3K27me3 and gain of H3K4me3 (with increase from < 3.0 reads in MEF to > 3.5 reads in senescence) simultaneously, and 9 genes showed a simultaneous H3K27me3 loss and H3K4me3 gain in both Ras- and Raf-induced senescence (right). These genes showed a significant enrichment in upregulated genes among the 483 genes (P = 1 × 10⁻⁵ in Ras-induced senescence, P = 2 × 10⁻⁹ in Raf-induced senescence, and P = 2 × 10⁻⁸ in both senescence, Kolmogorov-Smirnov test), and included Bmp2 (arrow head). Regarding the overlap of H3K27me3 alterations (center), 171 genes with H3K27me3 loss in Ras-induced senescence and 417 genes with H3K27me3 loss in Raf-induced senescence overlapped well (105 genes, P < 1 × 10-15, phi coefficient = 0.386).
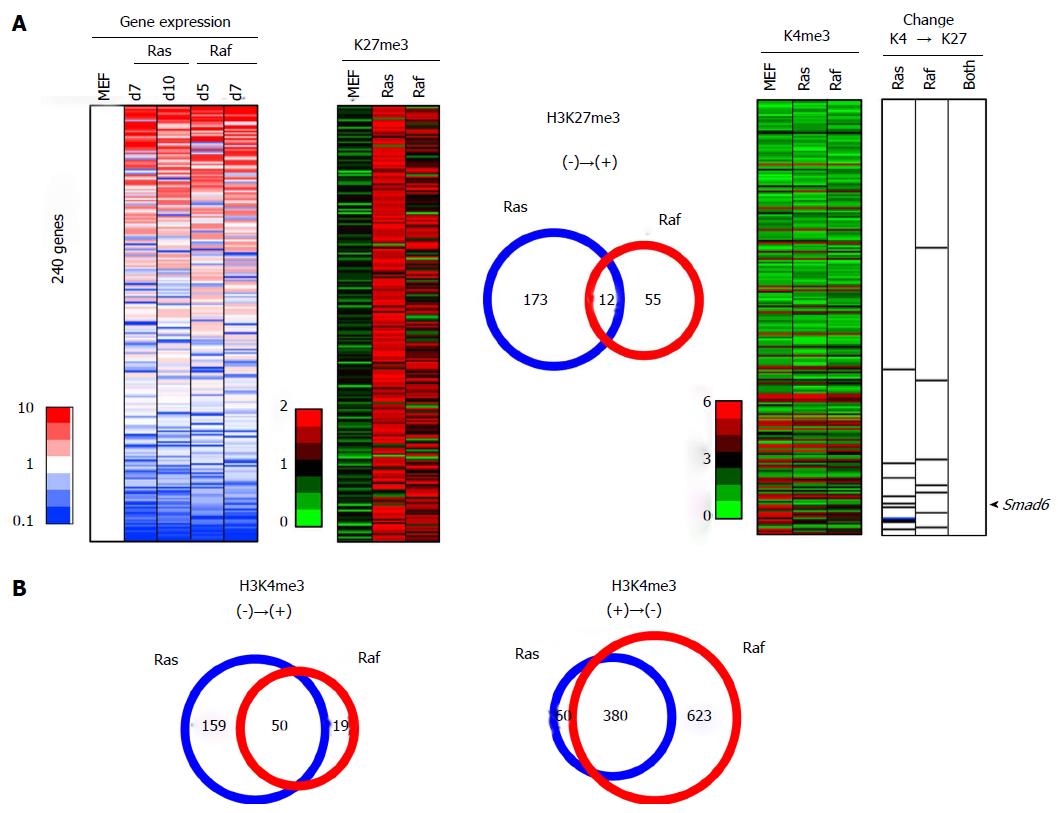
Figure 10 Integrated analysis of epigenetic and expression changes for genes acquiring H3K27me3.
A: A total of 240 genes showed < 1.0 reads per 1000000 reads in MEF, but increased to > 1.5 in both or either of Ras- and Raf-induced senescence, and were sorted by the fold expression change between MEF and mean of RasG12V cells and RafV600E cells (left). Among these 240 genes acquiring de novo H3K27me3 in senescence, 10 genes in Ras-induced senescence and 7 genes in Raf-induced senescence showed a simultaneous gain of H3K27me3 and loss of H3K4me3 (right). These genes showed a significant enrichment in downregulated genes among the 240 genes (P = 4 × 10⁻⁶ in Ras-induced senescence, and P = 0.02 in Raf-induced senescence, Kolmogorov-Smirnov test). However, these 10 genes, e.g., Smad6 (arrow head), and 7 genes did not overlap at all. Regarding the overlap of H3K27me3 alterations (center), 185 genes with H3K27me3 gain in Ras-induced senescence and 67 genes with H3K27me3 gain in Raf-induced senescence showed limited overlap (12 genes only, phi coefficient = 0.103), and this overlap in H3K27me3 gain was markedly rare compared with the overlap in H3K27me3 loss (Figure 9) (P < 1 × 10-15, log linear analysis); B: Overlap of H3K4me3 alterations. Genes with H3K4me3 gain in Ras- and Raf induced senescence overlapped well (50 genes, P < 1 × 10-15, phi coefficient = 0.413) (left), and also genes with H3K4me3 loss in Ras- and Raf-induced senescence overlapped well (380 genes, P < 1 × 10-15, phi coefficient = 0.559) (right). The overlap in H3K27me3 gain (Figure 10A) was again markedly rare, compared with the overlap in H3K4me3 gain (P = 2 × 10⁻⁹, log linear analysis) or with that in H3K4me3 loss (P < 1 × 10-15, log linear analysis).
- Citation: Fujimoto M, Mano Y, Anai M, Yamamoto S, Fukuyo M, Aburatani H, Kaneda A. Epigenetic alteration to activate Bmp2-Smad signaling in Raf-induced senescence. World J Biol Chem 2016; 7(1): 188-205
- URL: https://www.wjgnet.com/1949-8454/full/v7/i1/188.htm
- DOI: https://dx.doi.org/10.4331/wjbc.v7.i1.188


