Copyright
©The Author(s) 2020.
World J Clin Cases. Oct 6, 2020; 8(19): 4370-4379
Published online Oct 6, 2020. doi: 10.12998/wjcc.v8.i19.4370
Published online Oct 6, 2020. doi: 10.12998/wjcc.v8.i19.4370
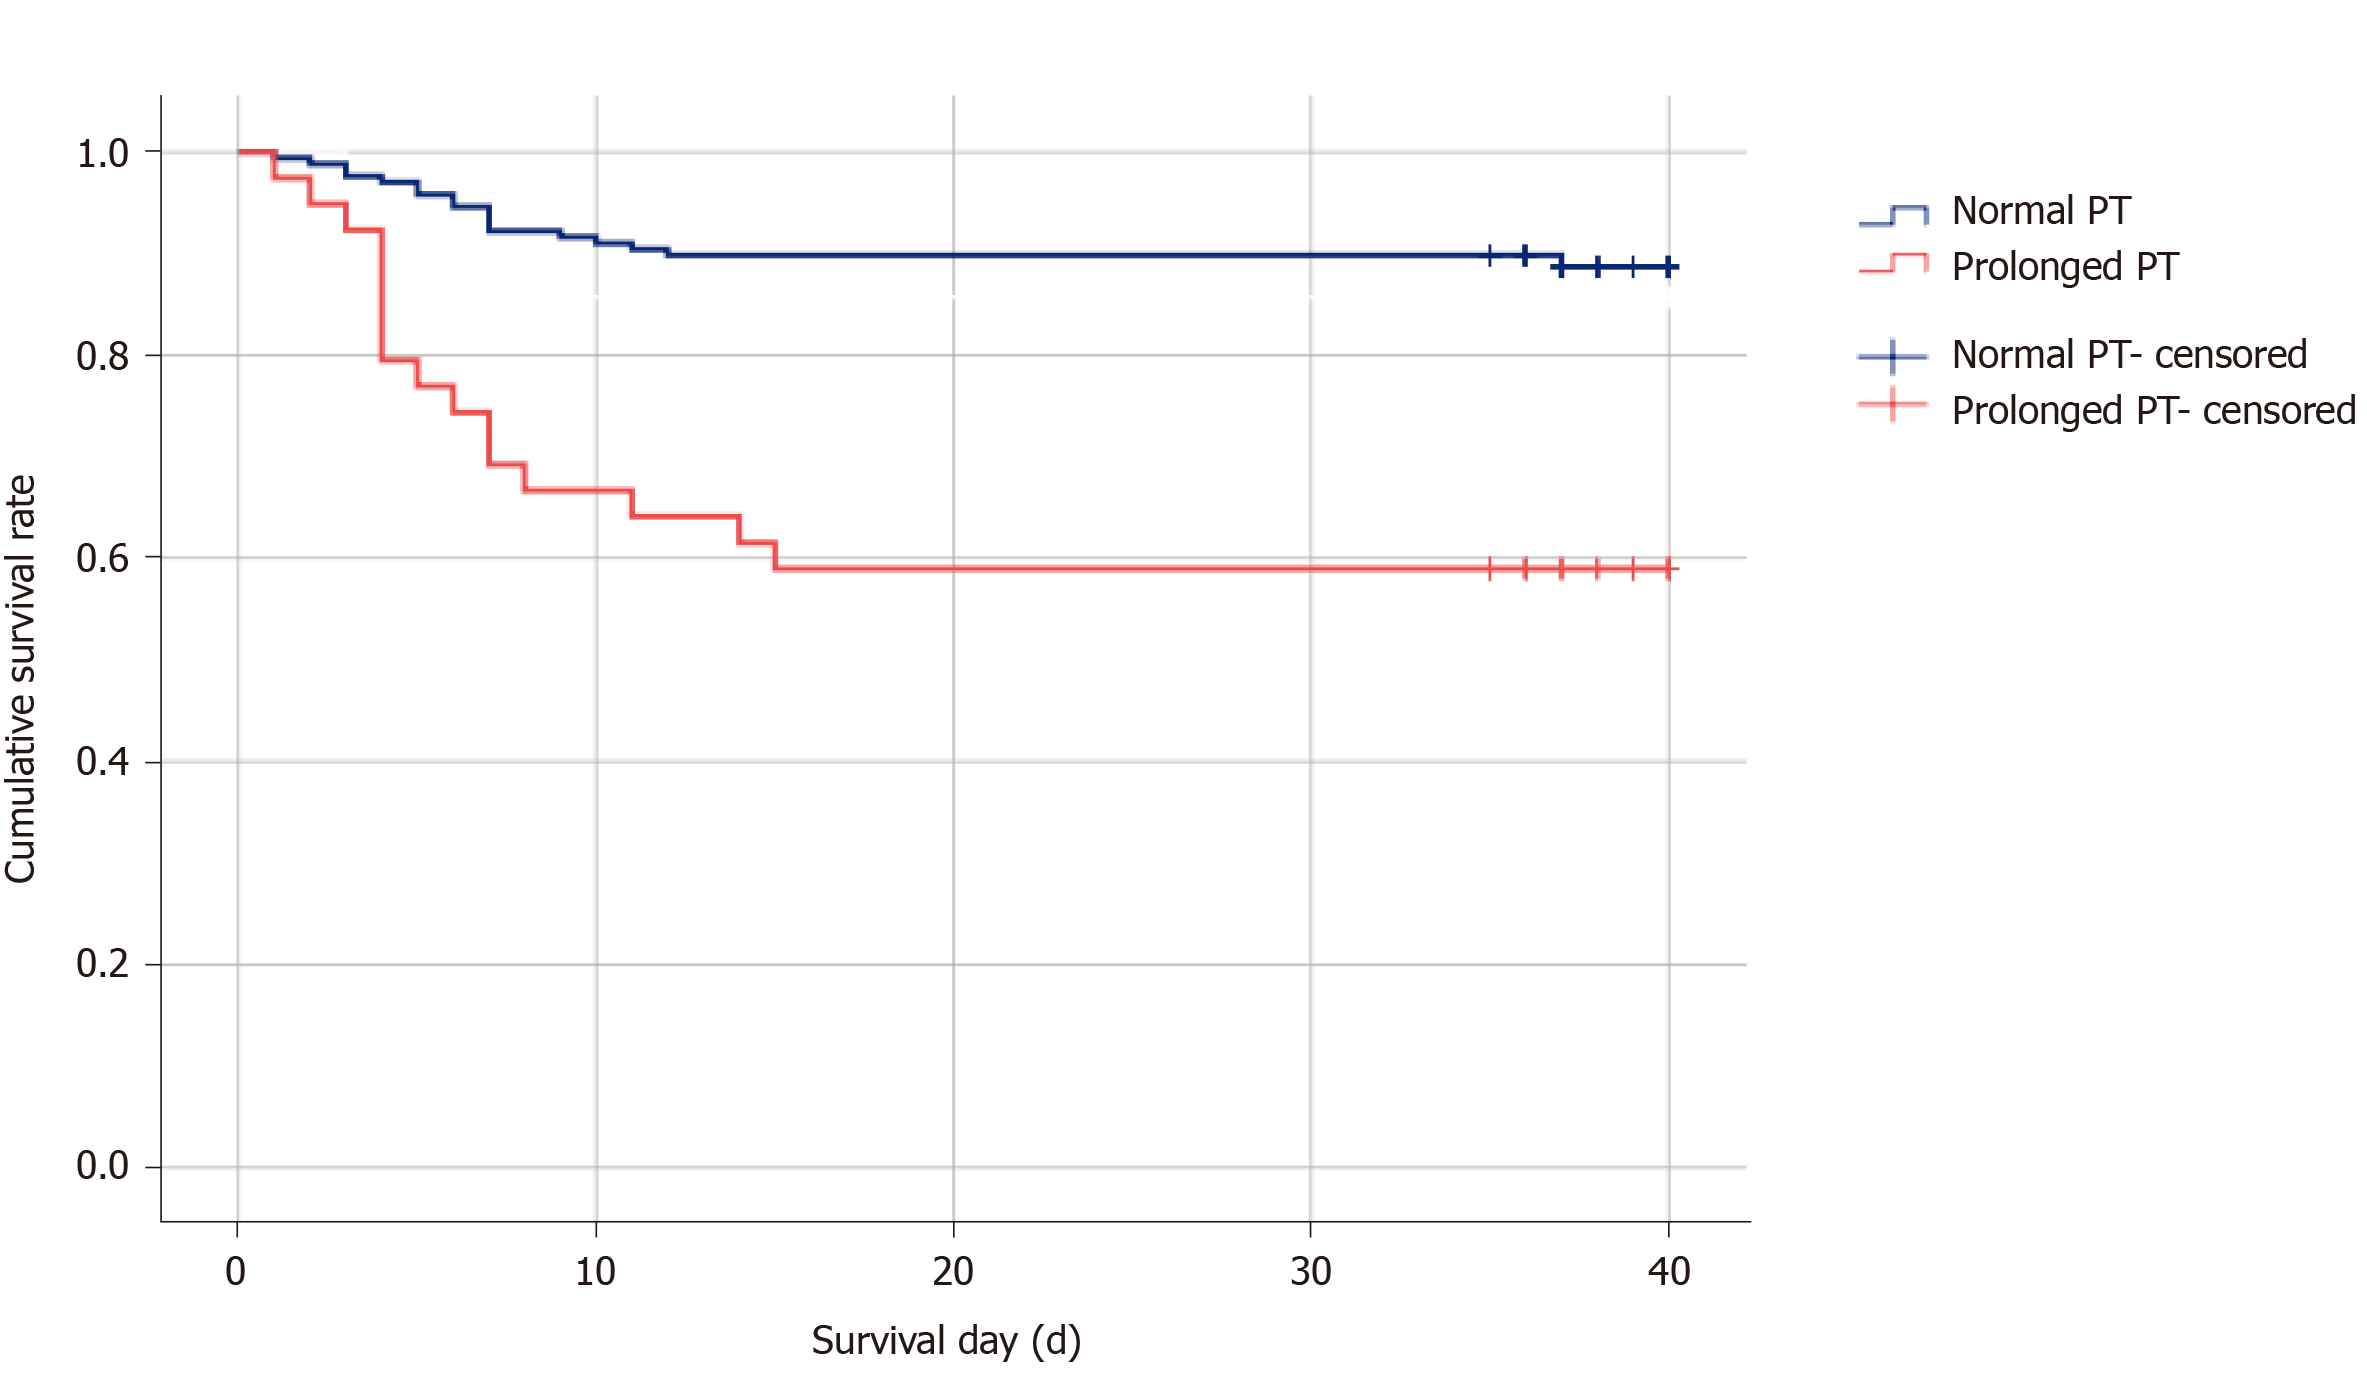
Figure 1 Survival curves of patients with prolonged prothrombin time and normal prothrombin time.
The survival curves of patients with prolonged prothrombin time and normal prothrombin time were analyzed using Kaplan-Meier analysis. Log-rank, Breslow and Tarone-Ware tests showed the survival curves of the two groups had a highly significant difference (P < 0.001). PT: Prothrombin time.
- Citation: Wang L, He WB, Yu XM, Hu DL, Jiang H. Prolonged prothrombin time at admission predicts poor clinical outcome in COVID-19 patients. World J Clin Cases 2020; 8(19): 4370-4379
- URL: https://www.wjgnet.com/2307-8960/full/v8/i19/4370.htm
- DOI: https://dx.doi.org/10.12998/wjcc.v8.i19.4370


