Copyright
©The Author(s) 2022.
World J Clin Cases. Nov 26, 2022; 10(33): 12089-12103
Published online Nov 26, 2022. doi: 10.12998/wjcc.v10.i33.12089
Published online Nov 26, 2022. doi: 10.12998/wjcc.v10.i33.12089
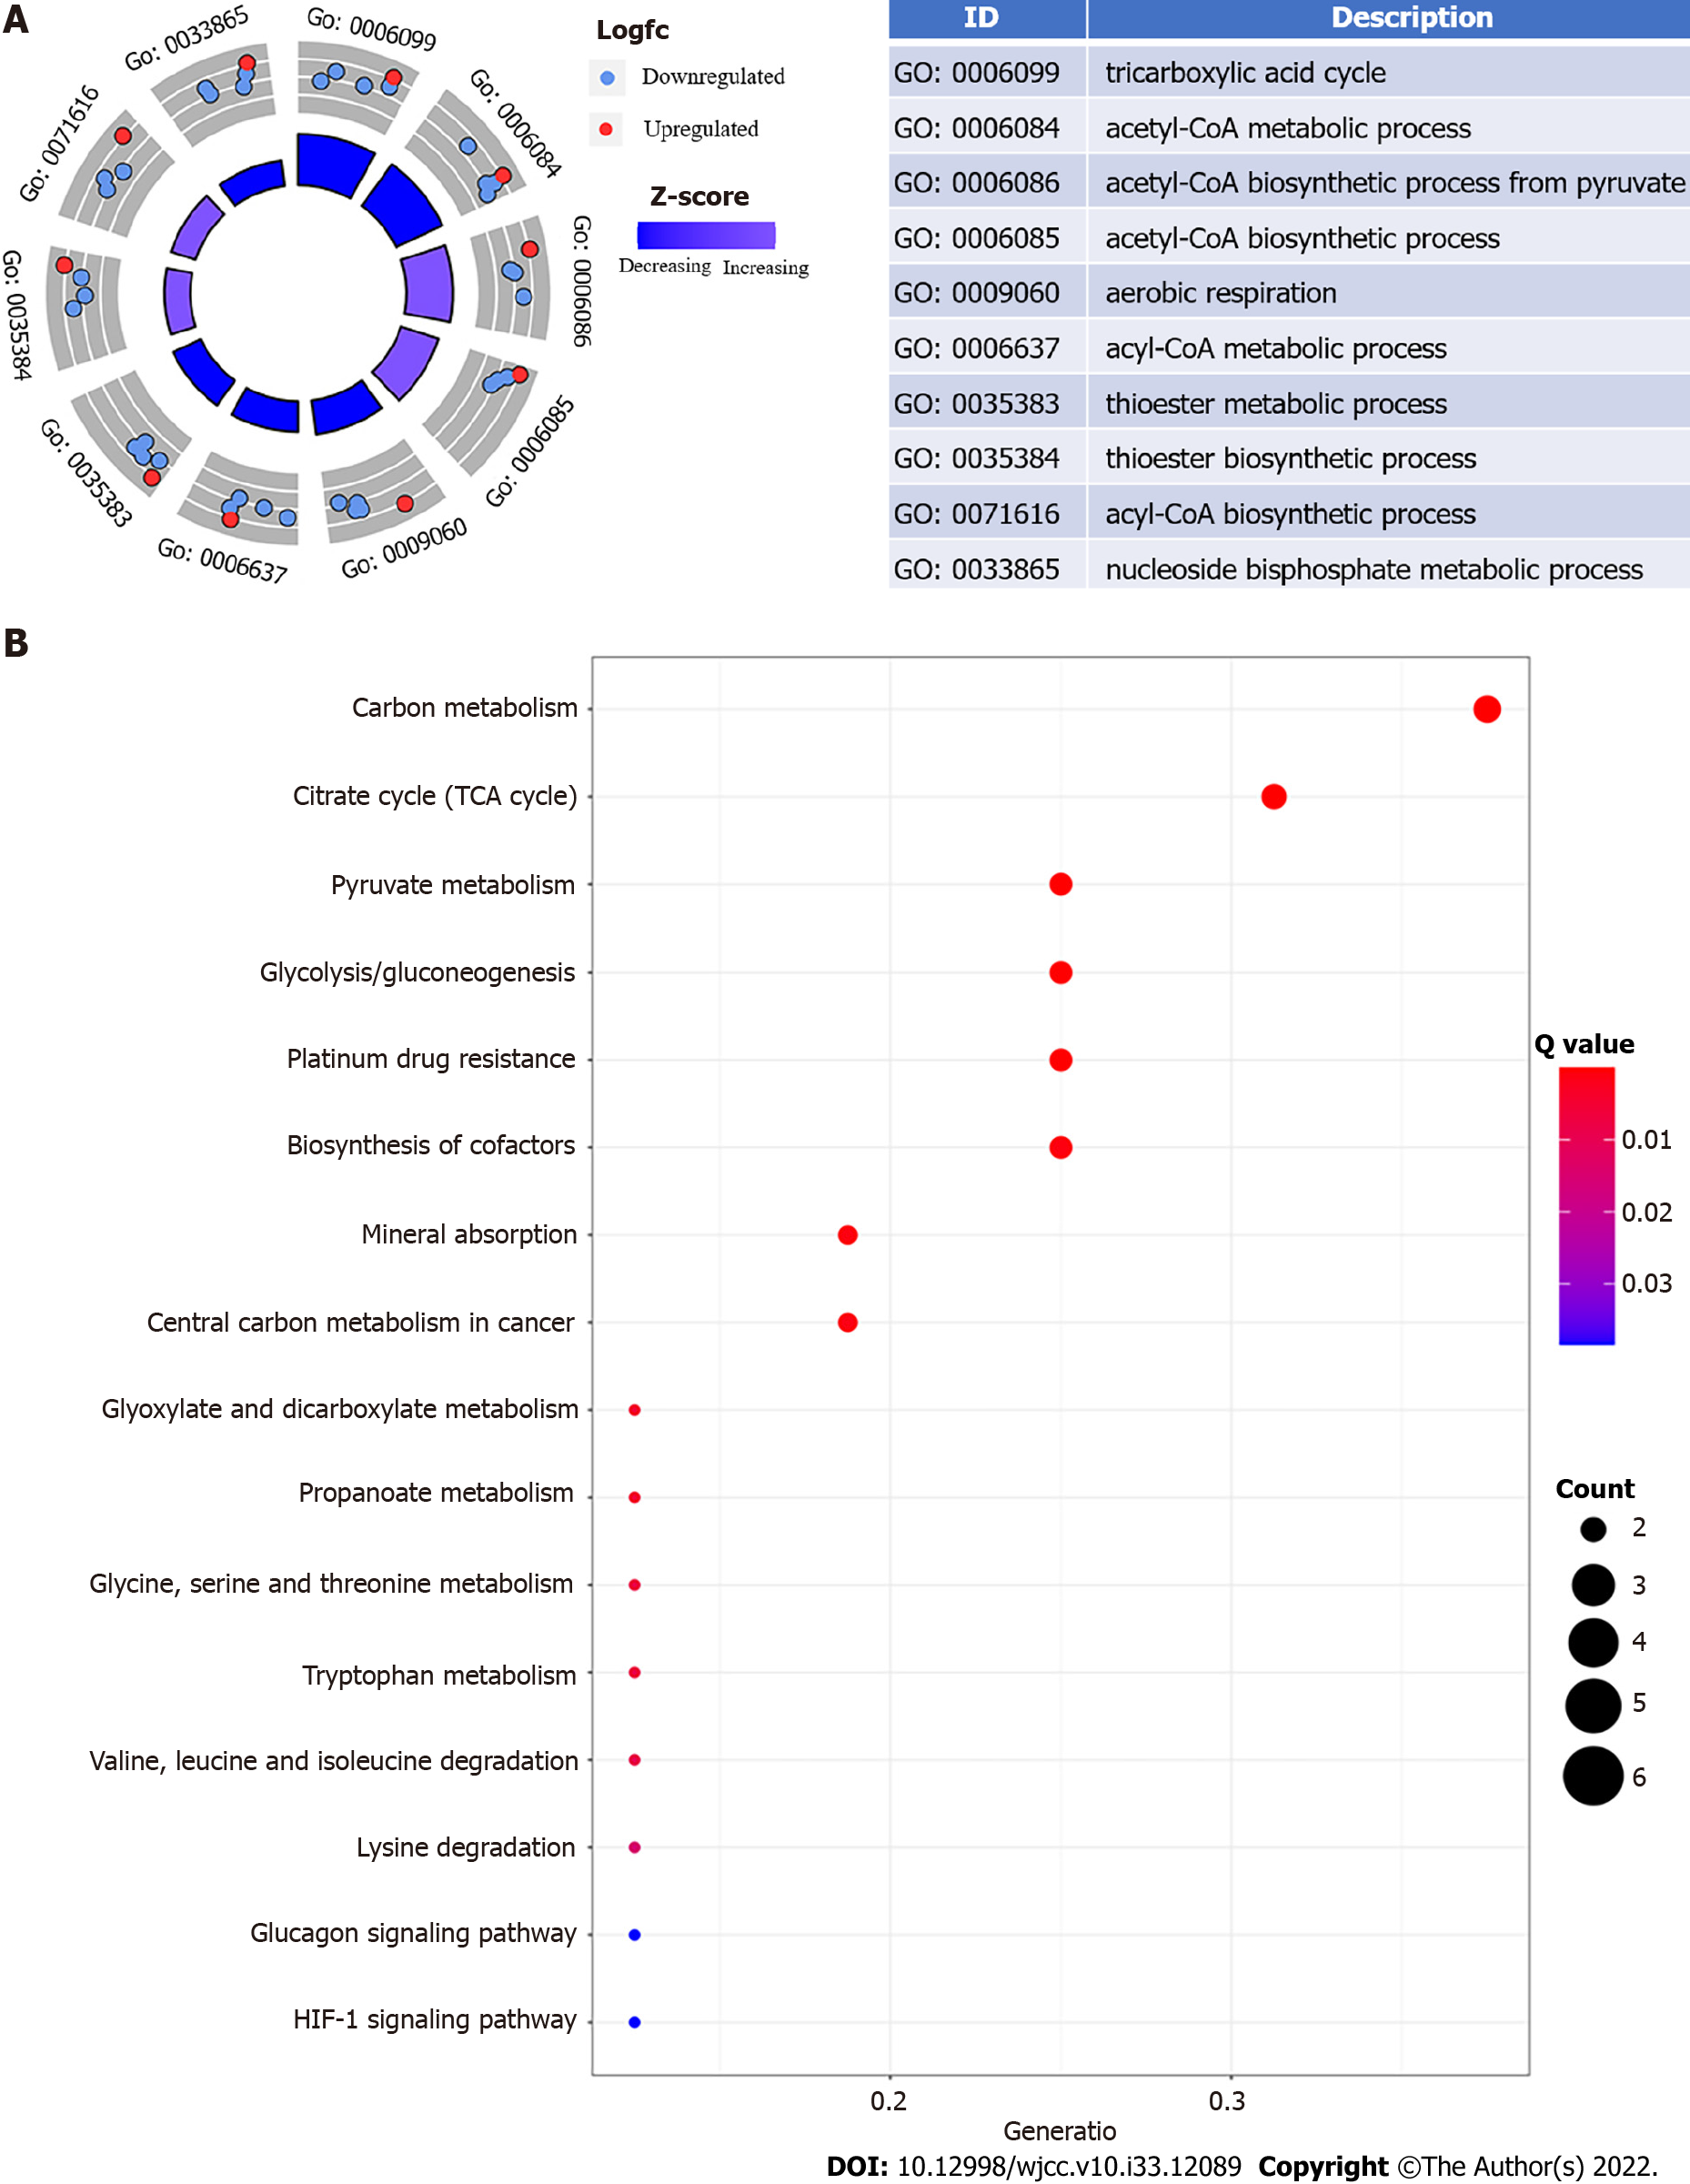
Figure 1 Esophageal cancer functional enrichment analysis of cuproptosis-related genes.
A: The expression of cuproptosis-related genes is represented by the outer circle in each enriched Gene Ontology (GO) terms; red dots on each GO term shows upregulated cuproptosis-related genes, and the inner circle indicates the importance of GO terms (log10 adjusted P value). The downregulated cuproptosis-related genes are shown by blue dots, and the chart on the right shows the distribution of cuproptosis-related genes in important GO terms; B: The top 16 Kyoto Encyclopedia of Genes and Genomes pathway enrichment analysis findings are shown. The GeneRatio denotes the number of differentially expressed genes (DEGs) detected in one GO pathway in proportion to the total number of DEGs.
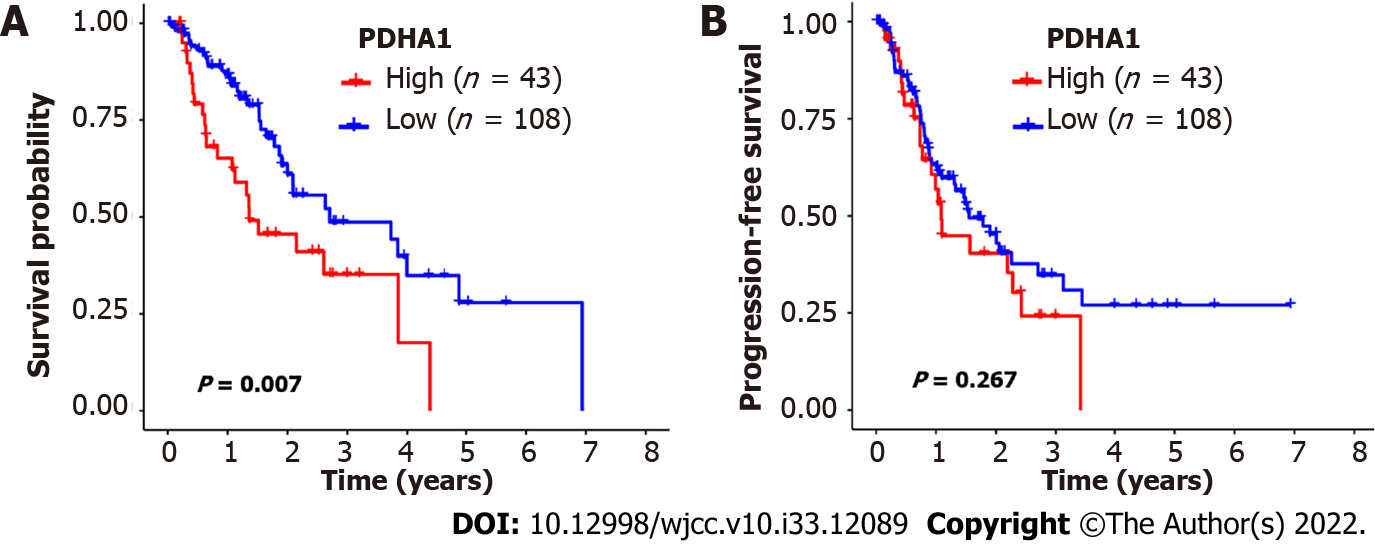
Figure 2 The Kaplan-Meier survival of patients with esophageal cancer who were classified according to pyruvate dehydrogenase A1 expression.
A and B: In esophageal cancer, patients with low pyruvate dehydrogenase A1 (PDHA1) expression levels had better overall survival (A) and progression-free survival (B) than patients with high PDHA1 expression levels. The significance of the difference between high and low expression was calculated using the log-rank test.
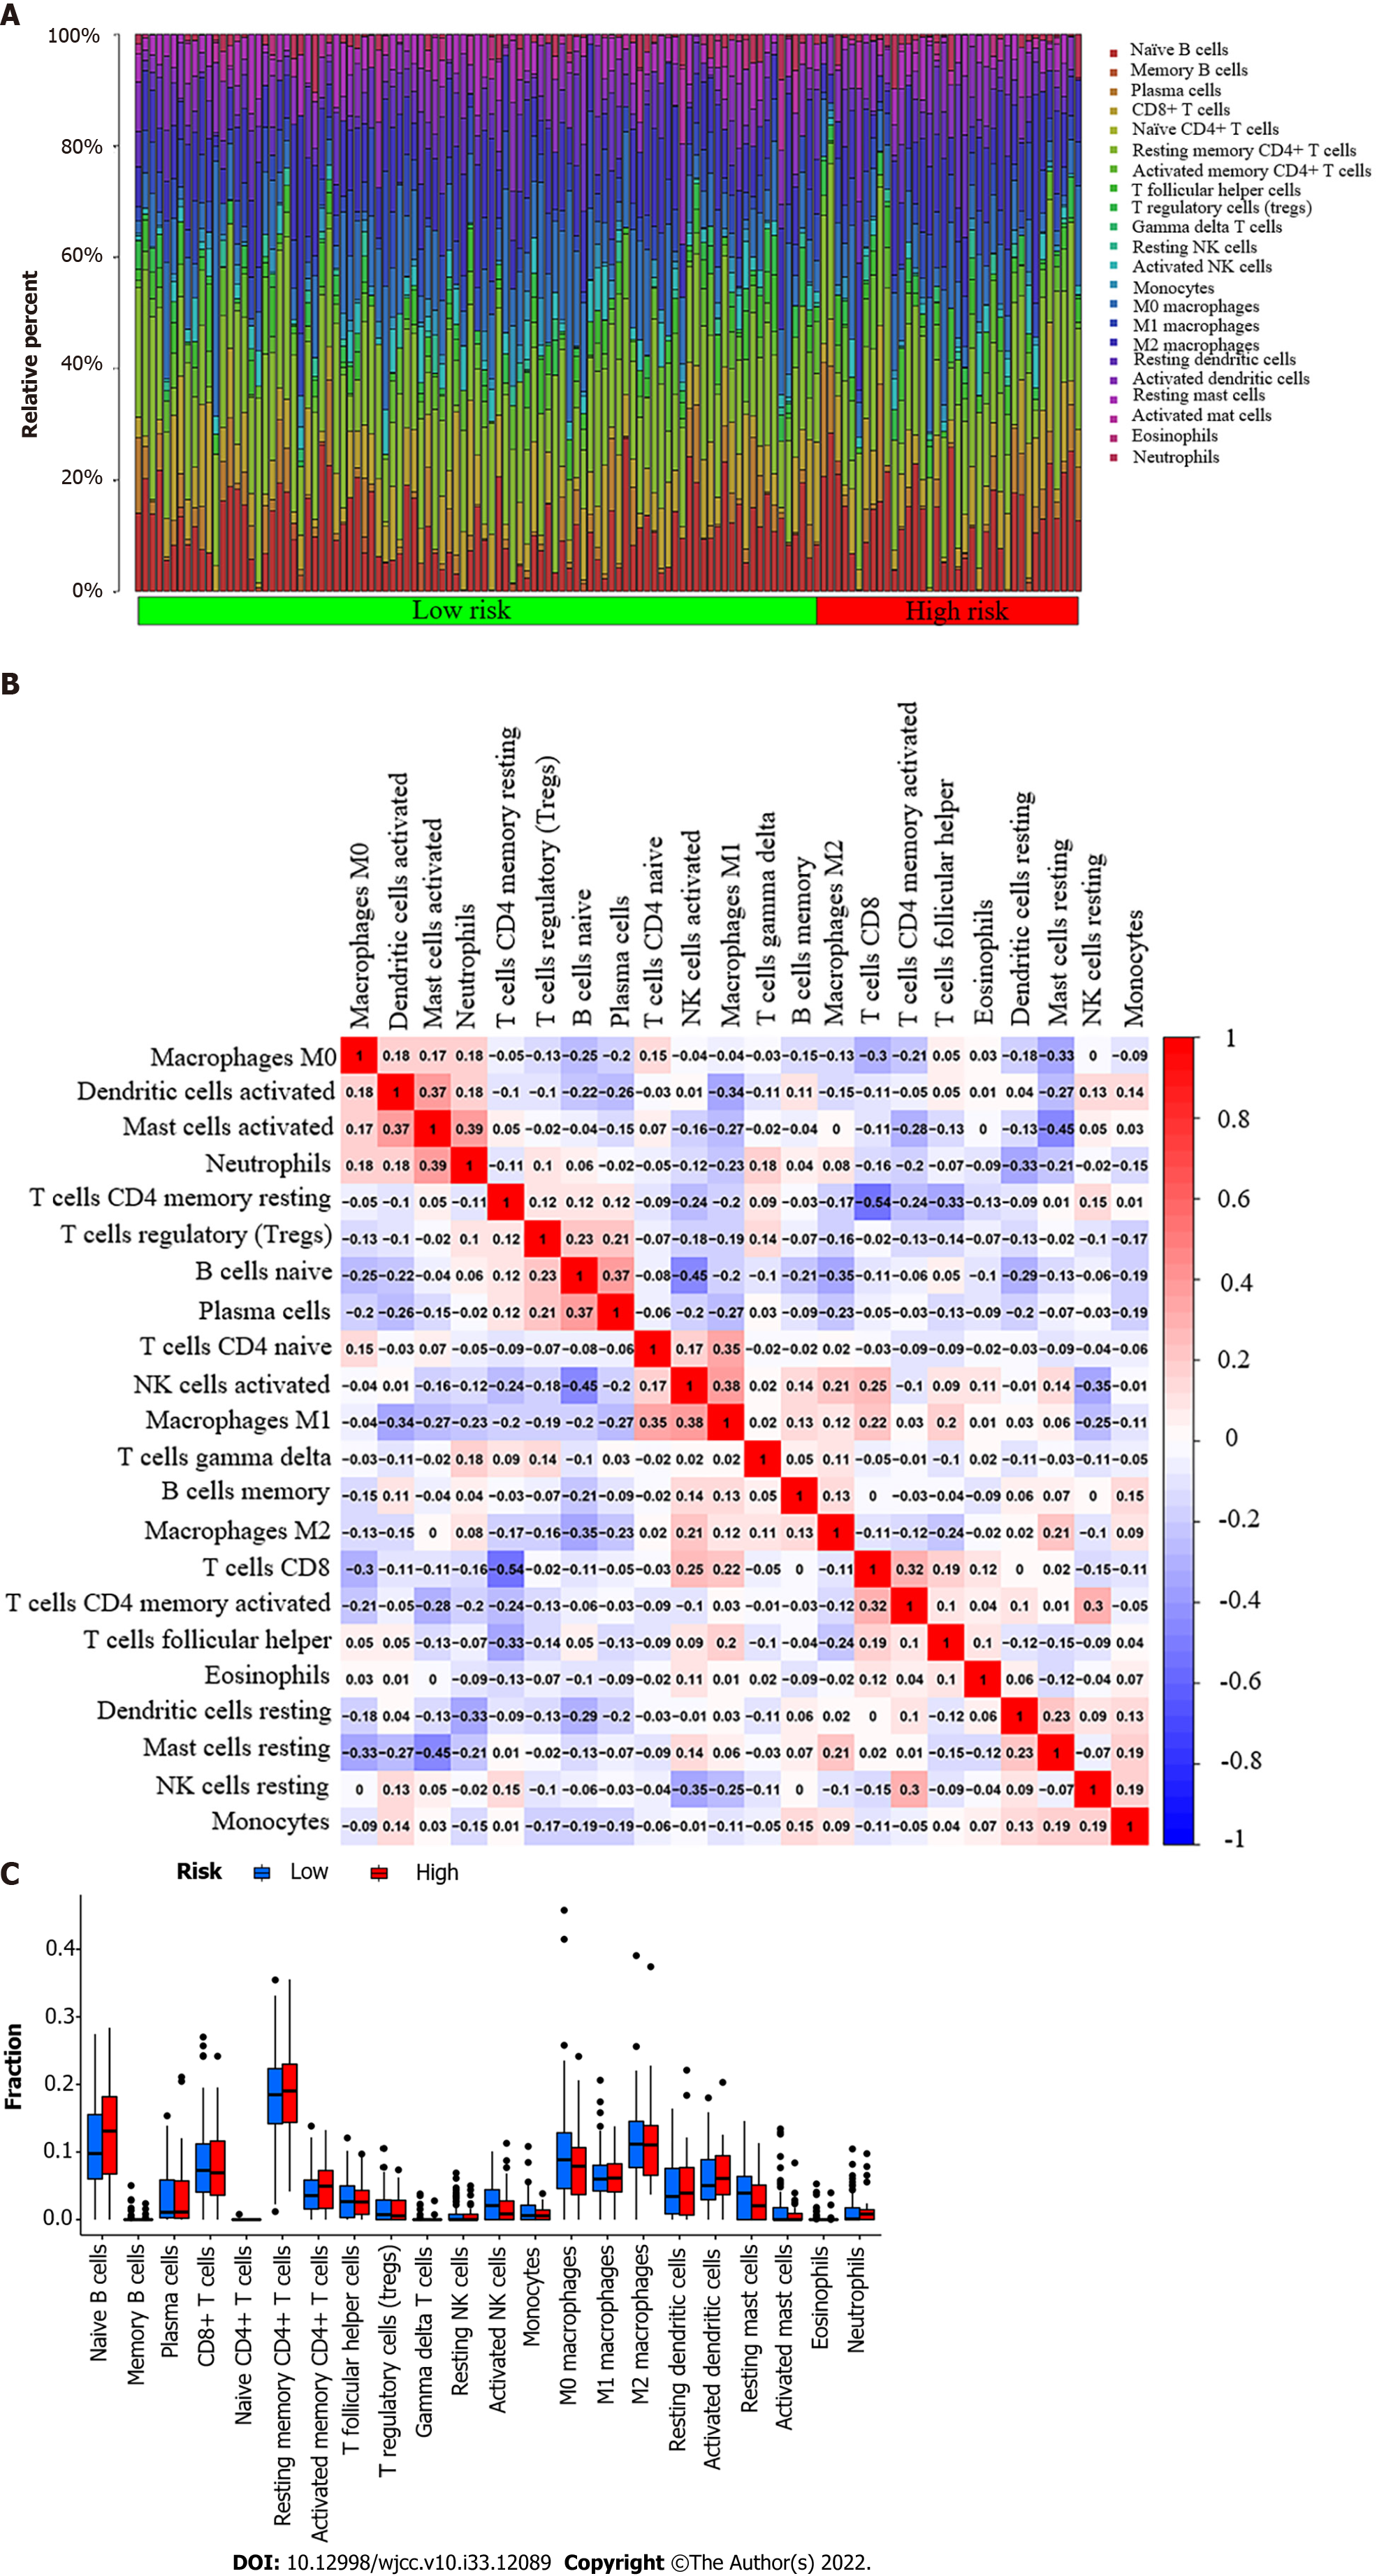
Figure 3 Tumor-infiltrating immune cell profile.
A: A barplot shows the ratio of 22 different tumor-infiltrating immune cells in esophageal cancer patients. Column names (X-axis): sample ID; B: A heatmap shows the association between 22 different types of tumor-infiltrating immune cells. Each dot represents the P value of the correlation between two different cell types, and Pearson’s correlation coefficient was used to determine significance; C: A bar graph shows the difference between esophageal cancer patients with high or low expression of pyruvate dehydrogenase A1 in terms of 22 different types of tumor-infiltrating immune cells. The Wilcoxon rank-sum test was used for the significance test.
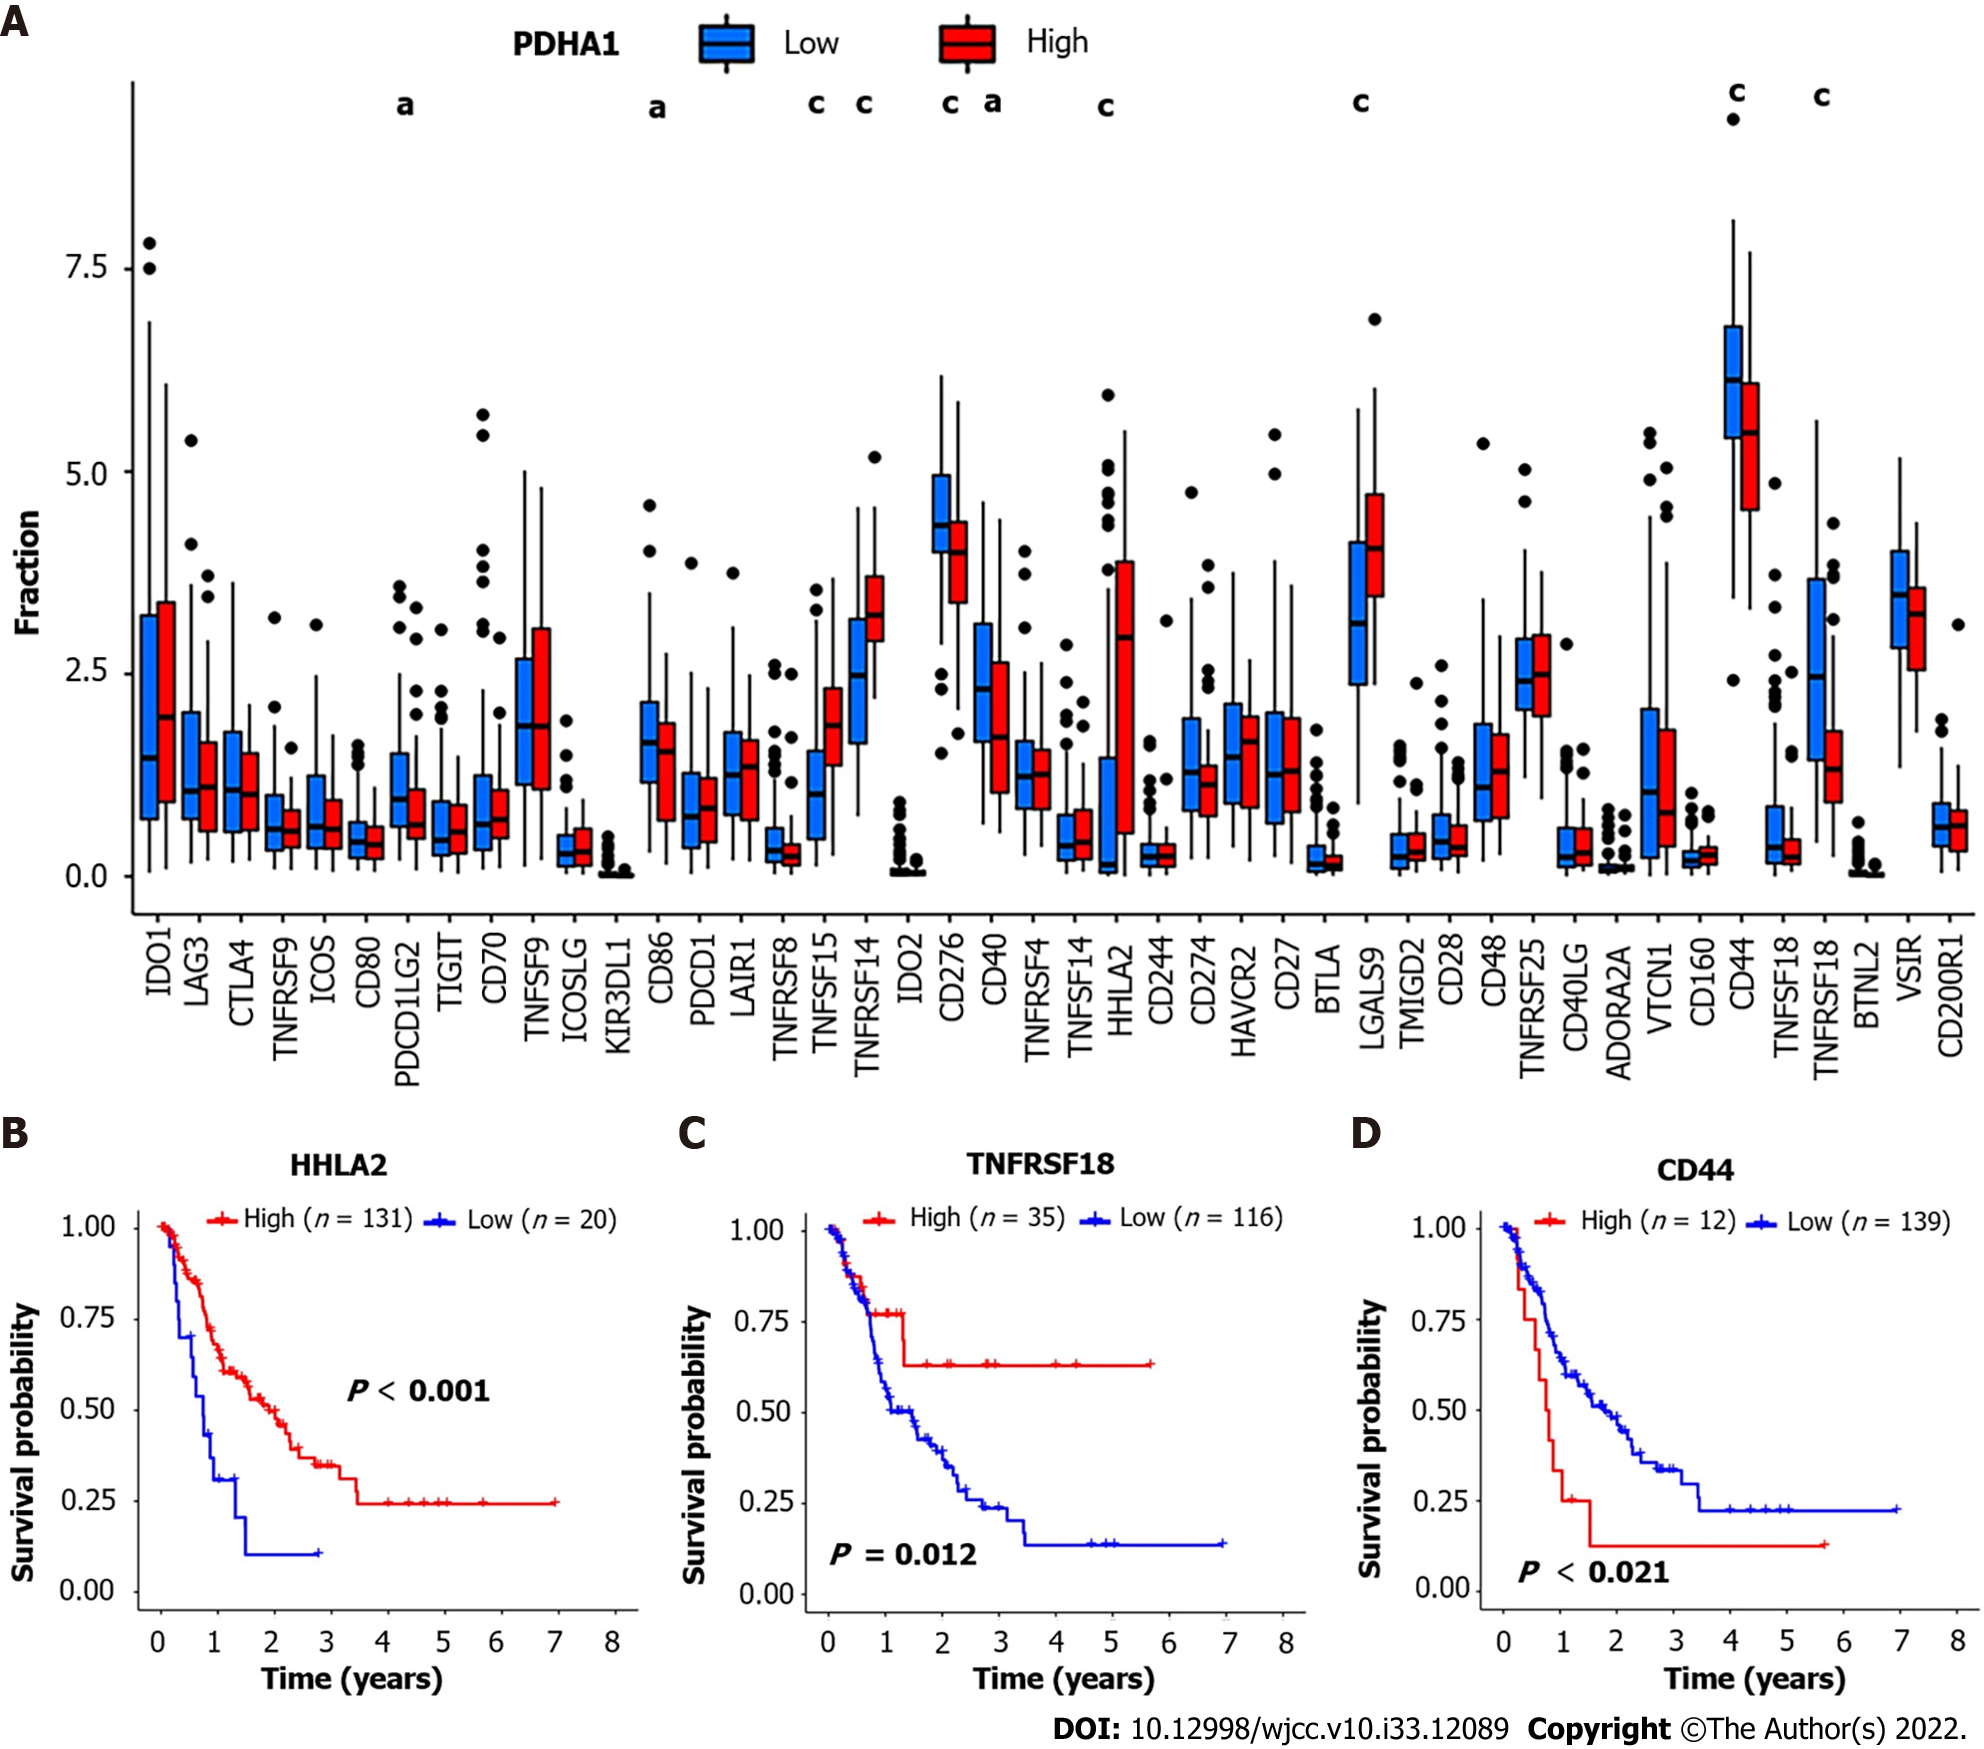
Figure 4 Correlation between pyruvate dehydrogenase A1 expression and immune checkpoint-related genes.
A: Barplot reveals expression of 47 immune checkpoint-related genes in high- and low-pyruvate dehydrogenase A1 (PDHA1) esophageal cancer patients; B-D: H long terminal repeat-associating 2 (B), tumor necrosis factor superfamily member 18 (C), and cluster of differentiation 44 (D) Kaplan-Meier survival curves of high and low expression of immune checkpoint-related genes. aP < 0.05; bP < 0.01; cP < 0.001.
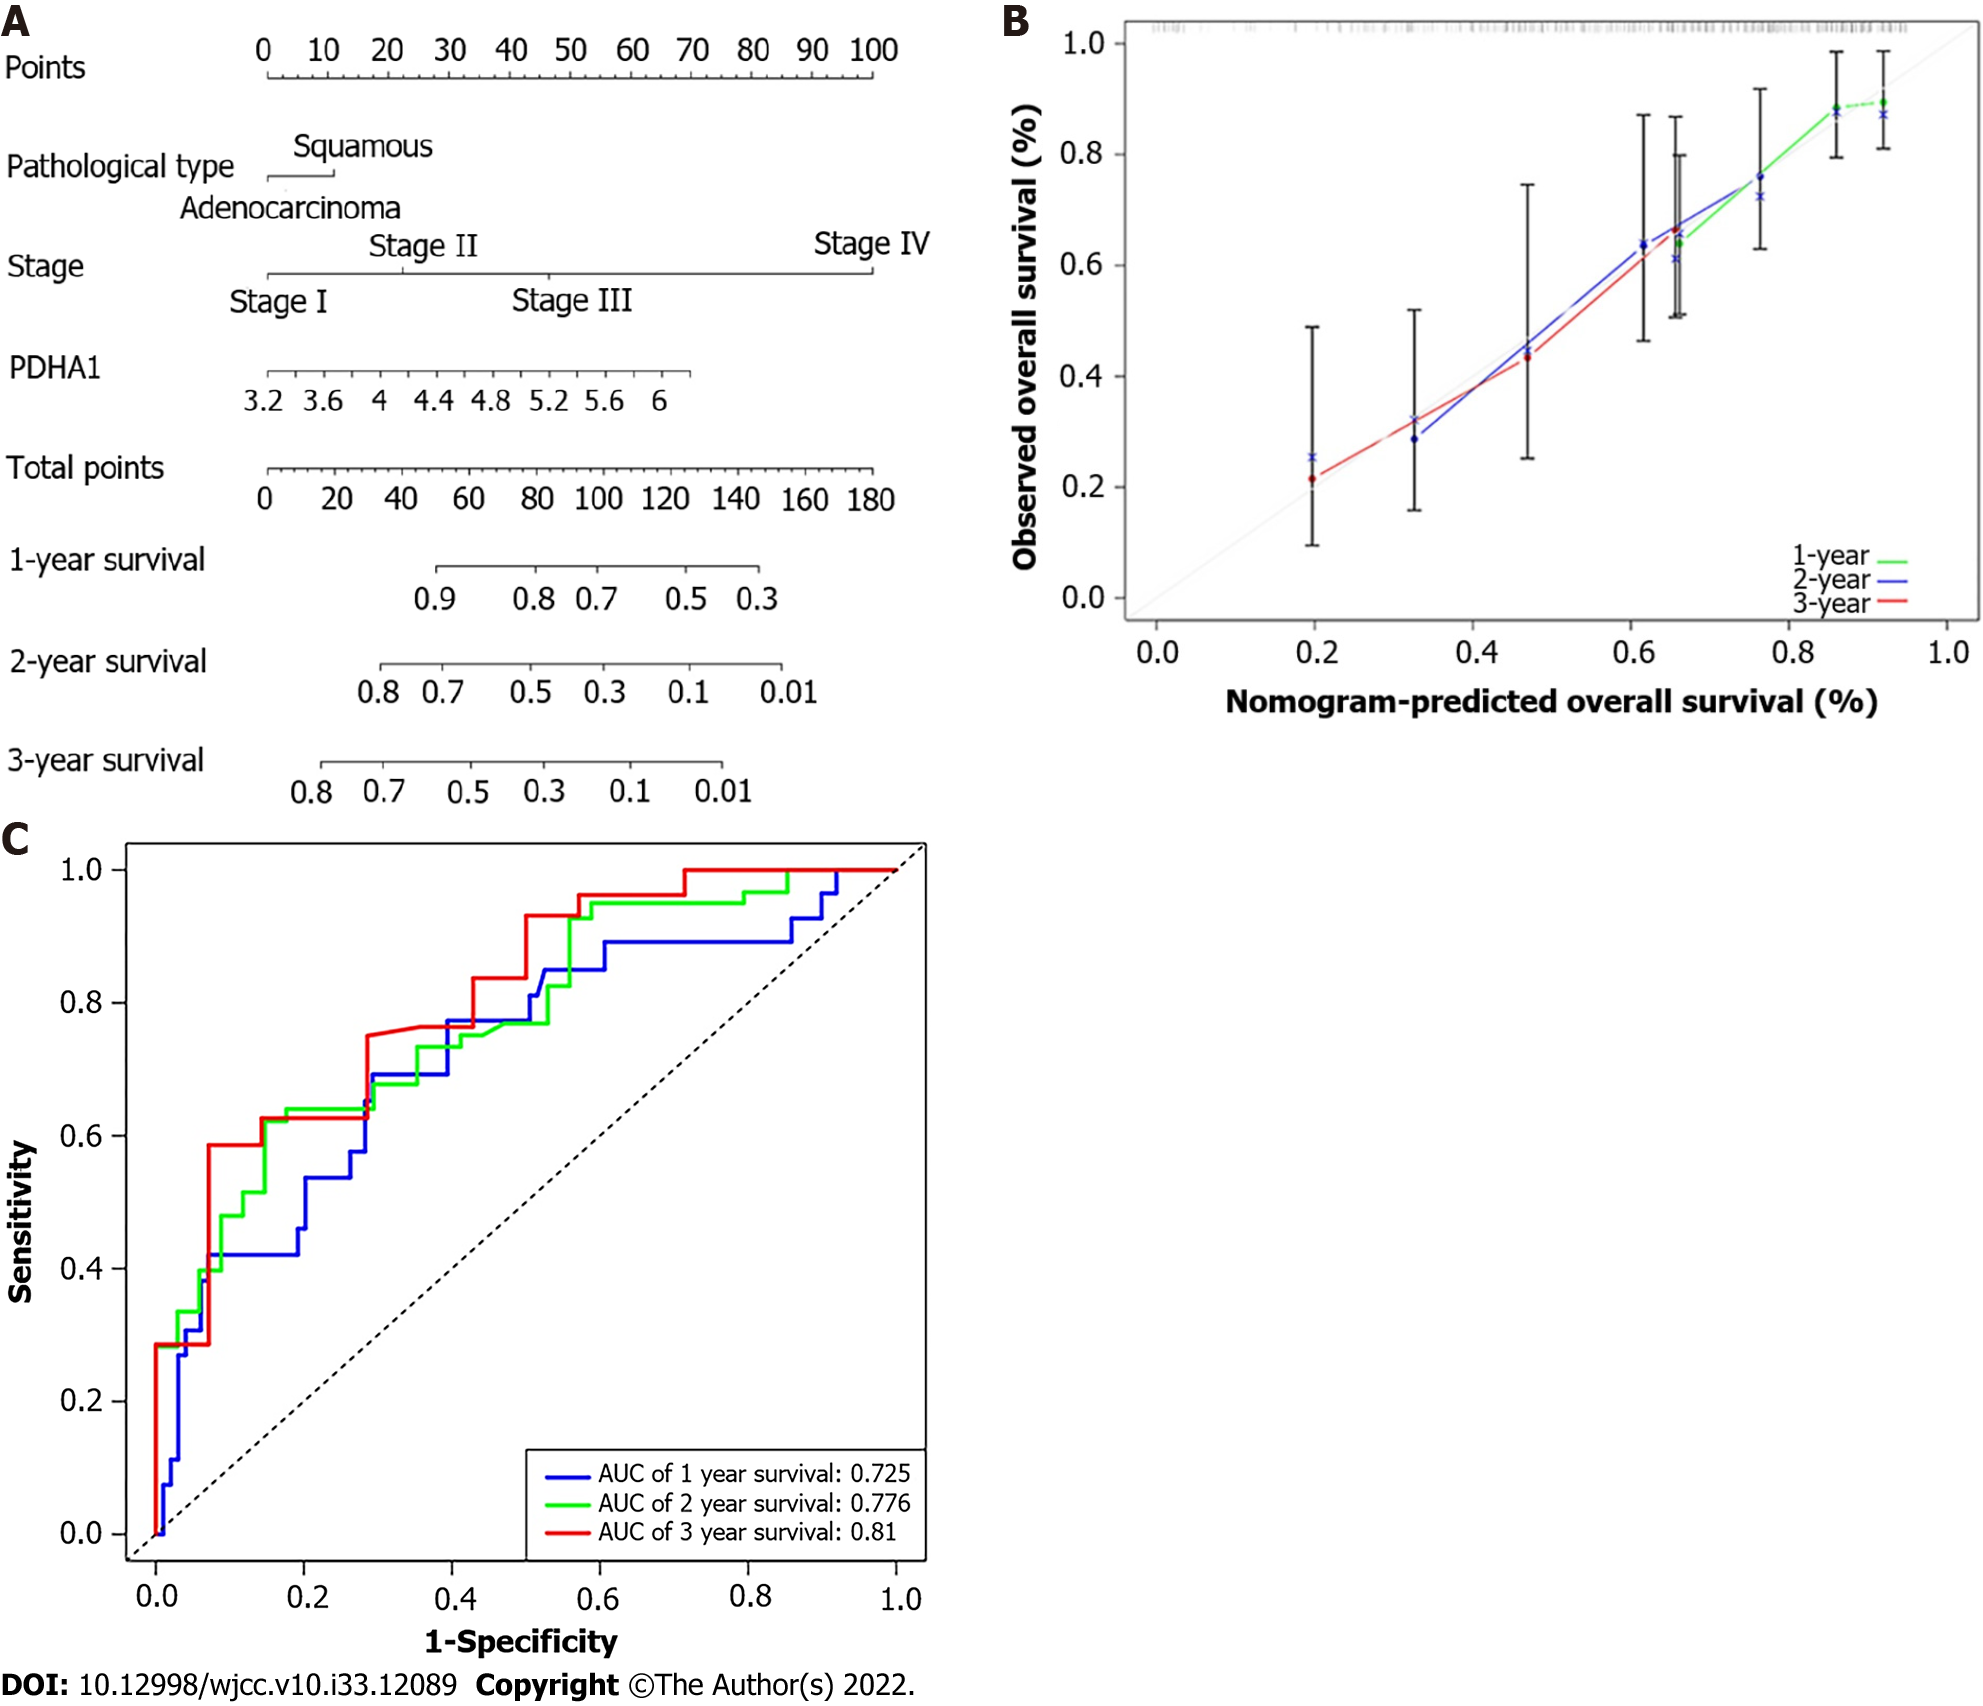
Figure 5 Developing a predictive nomogram.
A: A nomogram that predicts patients with esophageal cancer’s 1-, 2-, and 3-year survival; B: A calibration curve of 1-, 2-, and 3-year survival in the nomogram and ideal model; C: Receiver operating characteristic curves and area under the curve for the nomogram’s 1, 2, and 3-year survival. AUC: Area under the curve; PDHA1: Pyruvate dehydrogenase A1.
- Citation: Xu H, Du QC, Wang XY, Zhou L, Wang J, Ma YY, Liu MY, Yu H. Comprehensive analysis of the relationship between cuproptosis-related genes and esophageal cancer prognosis. World J Clin Cases 2022; 10(33): 12089-12103
- URL: https://www.wjgnet.com/2307-8960/full/v10/i33/12089.htm
- DOI: https://dx.doi.org/10.12998/wjcc.v10.i33.12089


