Copyright
©The Author(s) 2022.
World J Clin Cases. Nov 26, 2022; 10(33): 12089-12103
Published online Nov 26, 2022. doi: 10.12998/wjcc.v10.i33.12089
Published online Nov 26, 2022. doi: 10.12998/wjcc.v10.i33.12089
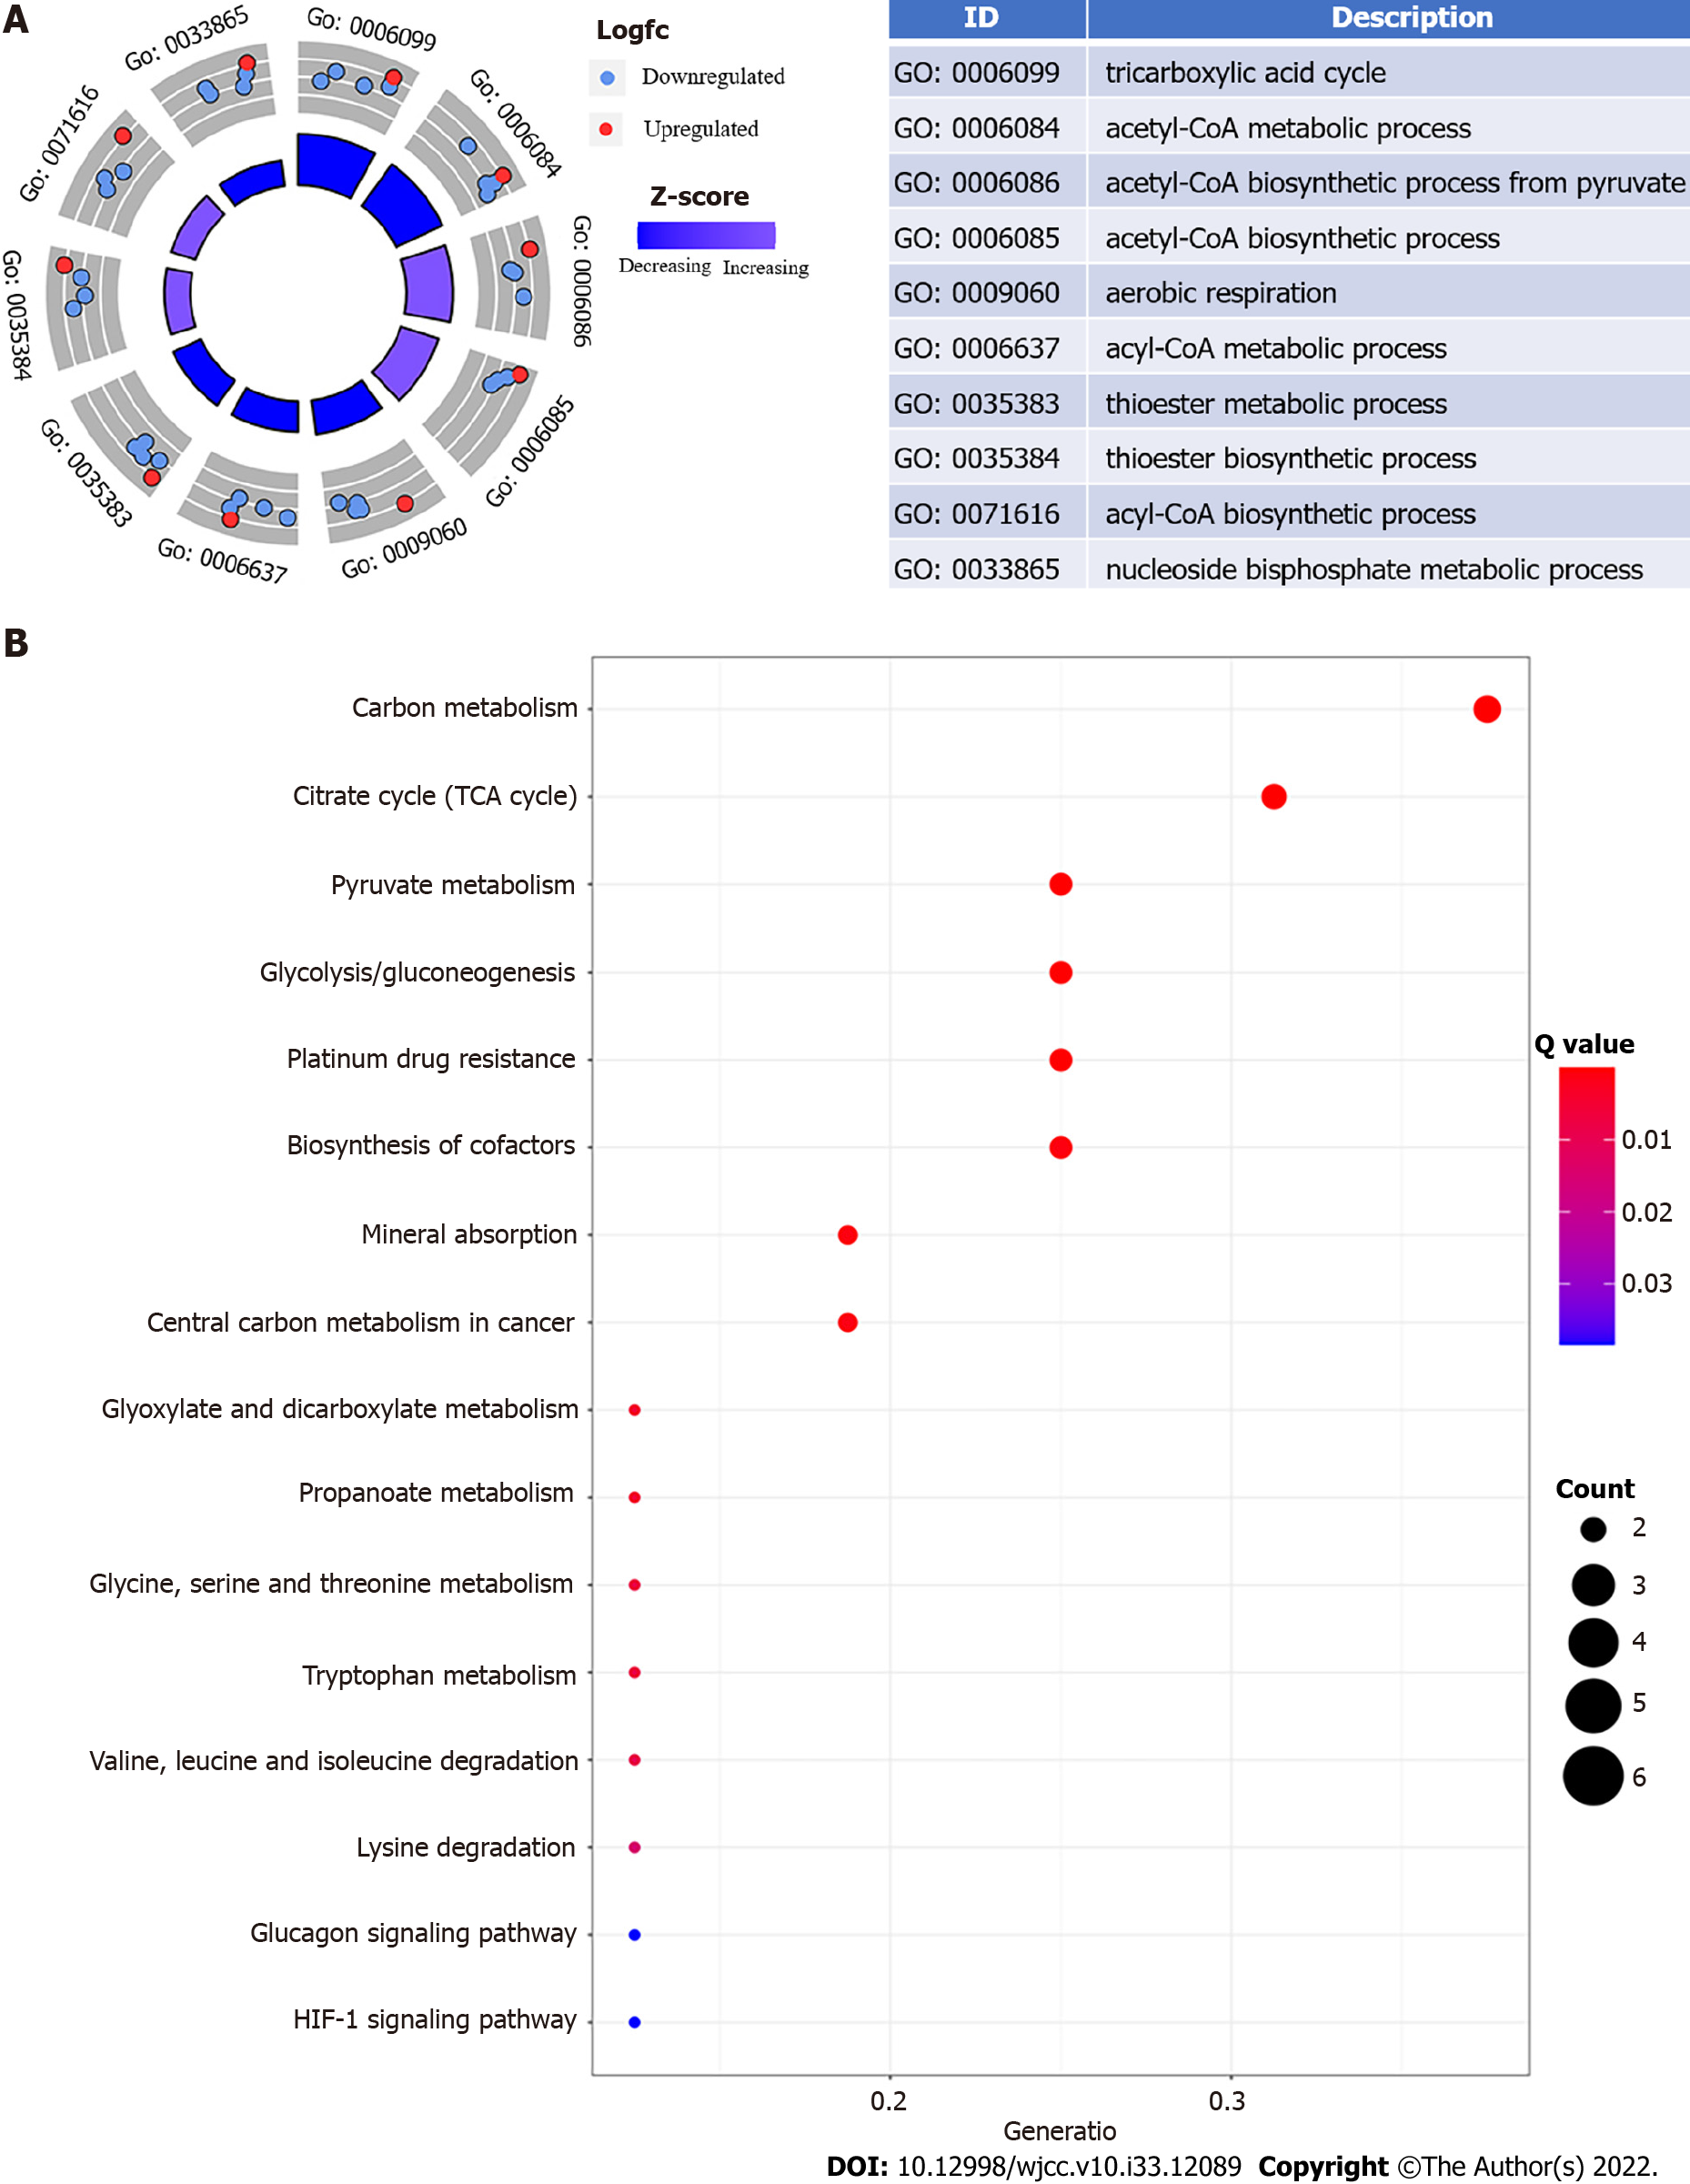
Figure 1 Esophageal cancer functional enrichment analysis of cuproptosis-related genes.
A: The expression of cuproptosis-related genes is represented by the outer circle in each enriched Gene Ontology (GO) terms; red dots on each GO term shows upregulated cuproptosis-related genes, and the inner circle indicates the importance of GO terms (log10 adjusted P value). The downregulated cuproptosis-related genes are shown by blue dots, and the chart on the right shows the distribution of cuproptosis-related genes in important GO terms; B: The top 16 Kyoto Encyclopedia of Genes and Genomes pathway enrichment analysis findings are shown. The GeneRatio denotes the number of differentially expressed genes (DEGs) detected in one GO pathway in proportion to the total number of DEGs.
- Citation: Xu H, Du QC, Wang XY, Zhou L, Wang J, Ma YY, Liu MY, Yu H. Comprehensive analysis of the relationship between cuproptosis-related genes and esophageal cancer prognosis. World J Clin Cases 2022; 10(33): 12089-12103
- URL: https://www.wjgnet.com/2307-8960/full/v10/i33/12089.htm
- DOI: https://dx.doi.org/10.12998/wjcc.v10.i33.12089


