INTRODUCTION
The motoric cognitive risk (MCR) syndrome is a predementia condition proposed by Verghese et al[1] in 2013, characterized by the presence of subjective cognitive decline (SCD) and slow gait (SG) speed in adults aged 45 years and older[2] without dementia or mobility disability. The reported prevalence of MCR varies widely, ranging from 2.0% to 27.3% due to heterogeneity in assessment tools[3,4]. Additionally, MCR increases the risk of Alzheimer’s disease and vascular dementia by threefold and twelvefold, respectively[3], and is also associated with adverse outcomes, including falls[5], disability[6], and death[7]. Early detection and management of modifiable risk factors in community settings are vital to slowing cognitive and functional deterioration[8] and preventing MCR progression.
There is growing evidence that potentially modifiable risk factors, such as medical illness, depressive symptoms, obesity, sedentary behavior, and low levels of physical activity, may increase the risk of MCR[3,9,10]. Recently, additional modifiable risk factors, including personality traits[11], purpose in life[12], apathy[13], frailty[14], pain[15], sleep disorders[16], social support[17], and fear of falling[18] have also been associated with MCR. Aside from this, the role of less understood factors, such as social engagement, remains uncertain despite its known association with cognitive impairment[19,20]. While previous studies have contributed valuable insights into modifiable risk factors within the MCR framework, a more comprehensive exploration of these factors and their interactive effects is still needed.
Furthermore, the primary criteria for diagnosing MCR-SCD and SG-make it suitable for resource-limited settings, as it does not require extensive neuropsychological testing or biomarkers[3]. This simplicity facilitates its use as a risk-screening strategy in community settings[1]. However, the risk of MCR may vary due to demographic, psychosocial, lifestyle, and health-related factors[3], and few studies have explored the interaction among these factors or developed a clinical prediction model. Previous approaches to predicting MCR have primarily employed the traditional logistic regression (LR) model and Cox proportional risk regression model to calculate the risk of MCR occurrence. For instance, Sathyan et al[14] found that obesity-related genetic traits increased the risk of MCR using the LR method, Whereas Kravatz et al[21] used the Cox model to identify poor olfaction as a risk factor for MCR. Moreover, Sun et al[2] used the traditional LR method to identify 10 predictors, including nutrient intake frequency, social support utilization score, and handgrip strength.
The traditional LR model is widely used as a primary parametric method, whereas the Cox proportional hazards model serves as a fundamental semi-parametric approach[22]. Non-parametric models incorporating machine learning (ML) techniques, such as decision trees (DT), have advanced significantly in medical applications[23]. These models excel at capturing complex nonlinear relationships where LR may fall short. Specifically, the DT model, using the classification and regression trees (CART) algorithm, offers clear interpretability and effectively handles variable interactions[24], often outperforming LR[25]. While DT models reveal promise for predicting conditions such as MCR[26], their application in MCR prediction remains largely unexplored.
The current study aimed to: (1) Construct two binary classification MCR screening tools using LR and DT methods to evaluate modifiable risk factors; and (2) Assess and compare the performance of these models to recommend the optimal predictive tool. An effective model would classify individuals by risk level and identify modifiable risk factors and their interactions, thereby enhancing prevention strategies.
MATERIALS AND METHODS
Study design and participants
The Community Study on Health Aging is an ongoing observational study investigating risk factors for chronic neurodegenerative conditions in adults aged 50 years and older in Huzhou City, Zhejiang province, China. Participants were recruited from community activity centers, healthcare centers, and individual homes. The current study follows the transparent reporting of a multivariable prediction model for individual prognosis or diagnosis (Supplementary Table 1)[27].
A total of 1250 potential community participants were recruited from May 1, 2022, to March 15, 2023, to assess eligibility. Of these, 61 dropped out due to personal reasons, changes in disease status, or treatment-related factors. The remaining 1189 participants were deemed eligible and completed questionnaire surveys and physical assessments.
The inclusion criteria were as follows: (1) Age 50 years or older, given the relevance of this age group for early cognitive decline and preventive care[28]; (2) Diagnosis of MCR according to the criteria proposed by Verghese et al[1]; (3) Absence of severe visual or hearing impairment; (4) Adequate reading comprehension and willingness to participate in the survey; and (5) Ability to provide informed consent. The exclusion criteria included the following: (1) Serious physical or mental illness (for example, major depressive disorder or schizophrenia); (2) Inability to walk independently; (3) Recent or planned medical procedures that could affect gait (for example, surgery or hemodialysis)[16]; and (4) Using cognitive enhancers (for example memantine) within the past six months.
The operational criteria for MCR screening, applied by two trained neurologist-psychiatrists, were based on previous studies[1,2,9] and included the following: (1) Absence of dementia, determined using the diagnostic and statistical manual of mental disorders-V criteria, along with neuropsychological assessments. The consensus was reached through discussion, using tools such as the Chinese versions of the mini-mental status examination scale[29], with cutoff scores of ≥ 17 for illiterate individuals, ≥ 20 for those with primary school education, and ≥ 24 for those with middle school education or higher; (2) Absence of mobility disability, defined as the ability to perform daily activities without impairment, assessed using the katz activities of daily living and law ton instrumental activities of daily living scale, with total scores of ≤ 16 points[30]; (3) Presence of SCD, assessed through a standardized item from the nine-item SCD questionnaire, with scores exceeding three points indicating SCD[31]; and (4) Gait speed, assessed using the 6-meter walking test, in which participants walked from a stationary start to the finish line twice at their normal pace. Time was recorded and converted to meter per second, and the average speed was calculated. SG was defined as a walking speed one SD or more below the age- and sex- specific means, as previously described (Supplementary Table 2)[1,3,32].
Sampling and recruitment method
A multi-stage random sampling method was employed in Wuxing District, Huzhou City, starting with 19 streets listed on the district’s website. Six streets were randomly selected, followed by three communities per street, resulting in a total of 18 communities. Potential participants were recruited from community health care centers and senior centers. Recruitment leaflets were distributed by trained staff, with local healthcare providers assisting with participant referrals. Seven trained interviewers conducted face-to-face interviews using structured questionnaires, whereas well-experienced technicians performed physical examination and anthropometric measurements. Data collection continued until the predetermined sample size was reached.
Outcome and predictor variables
The occurrence of MCR was treated as a binary outcome variable. A total of 45 research variables were collected, covering demographic characteristics, lifestyle and behavioral patterns, physical functional status, and psychological conditions. These variables included information on participants’ background, health behaviors, physical and cognitive functioning, comorbidities, and emotional well-being. Full details are provided in Supplementary Table 3.
Sample size estimation
The effective sample size for prediction research was determined by the number of outcome events, with guidelines suggesting targeting at least 5-10 events per variable (EPV) for training dataset accuracy[33]. Given that MCR prevalence in China has been reported between 4.40% and 13.85%[2,34-36], an event rate of 12.00% was anticipated. To accommodate a final multivariable LR model with no more than 10 predictors, based on the analysis experience of previous studies[2,35,37] and considering the potential sample loss, an expansion of the sample size by 10% was necessary. Consequently, at least 463 samples were required for the training dataset. According to the principle of random division at a 7:3 ratio, the testing dataset necessitated at least 198 samples. The sample size and number of outcome events in the current study exceeded EPV method recommendations, ensuring highly reliable estimates.
Data collection
Data collection was conducted by seven trained interviewers and technicians, with questionnaire completeness verified on-site and missing items addressed immediately. Before model construction, categorical variables were transformed into dummy variables. Regression imputation with a ten-fold cross-validation procedure was used for the missing continuous variables, considering the low missing rate (2.12%), whereas none of the categorical variables exhibited missing values (Supplementary Table 3).
Statistical analysis
The statistical package for the social sciences (version 26.0; IBM, United States) and R (version 4.0.3) software were used for data processing and statistical analyses. Categorical variables are presented as frequencies and percentages [n (%)] and compared using the χ2 test. The Shapiro-Wilk test was used to assess the normality. Normally distributed data are described as mean and standard deviation and were compared using t-tests. Non-normally distributed continuous variables are described with medians and inter-quartile ranges and compared using the Kruskal-Wallis H test.
A pure random sampling method allocated 70% (810/1189) of the sample size to the training dataset for parameter calculation and model construction, while the remaining 30% (379/1189) constituted the testing dataset for model validation and evaluation. The least absolute shrinkage and selection operator (LASSO) method was applied to the training dataset to select predictors based on single-factor analysis[38]. P values were relaxed to < 0.10 to capture potential interactions. Ten-fold cross-validation was used in the LASSO regression model to fit the parameters lambda.1se and lambda.min. Ultimately, lambda.min was chosen as the optimal coefficient, and the non-zero coefficients of selected variables were reported.
The model construction and analysis involved three stages. First, LASSO selected optimal variables to construct and validate LR and DT models using the training dataset, with verification performed using the testing dataset: (1) An LR-based nomogram was created using variables with significant regression coefficients (P value < 0.05) and clinical relevance[39]; and (2) A CART-based classification tree diagram was developed with a Gini index algorithm, and optimal pruning was determined using minimum error under the complexity parameter (CP) through ten-fold cross-validation[40]. Second, the models were compared using a confusion matrix and metrics such as optimal cutoff value, sensitivity, specificity, accuracy, and the Youden index to validate classification performance. Furthermore, the receiver operating characteristic curves were used to assess discriminability, with comparisons of the non-inferiority test. Prediction accuracy and clinical practicality were further evaluated using decision curve analyses (DCAs) based on net benefit and threshold probability. In the third stage, Shapley additive explanations (SHAP) values were calculated to evaluate the contribution of each predictor to LR and DT models.
RESULTS
Recruitment, attrition, and prevalence of MCR
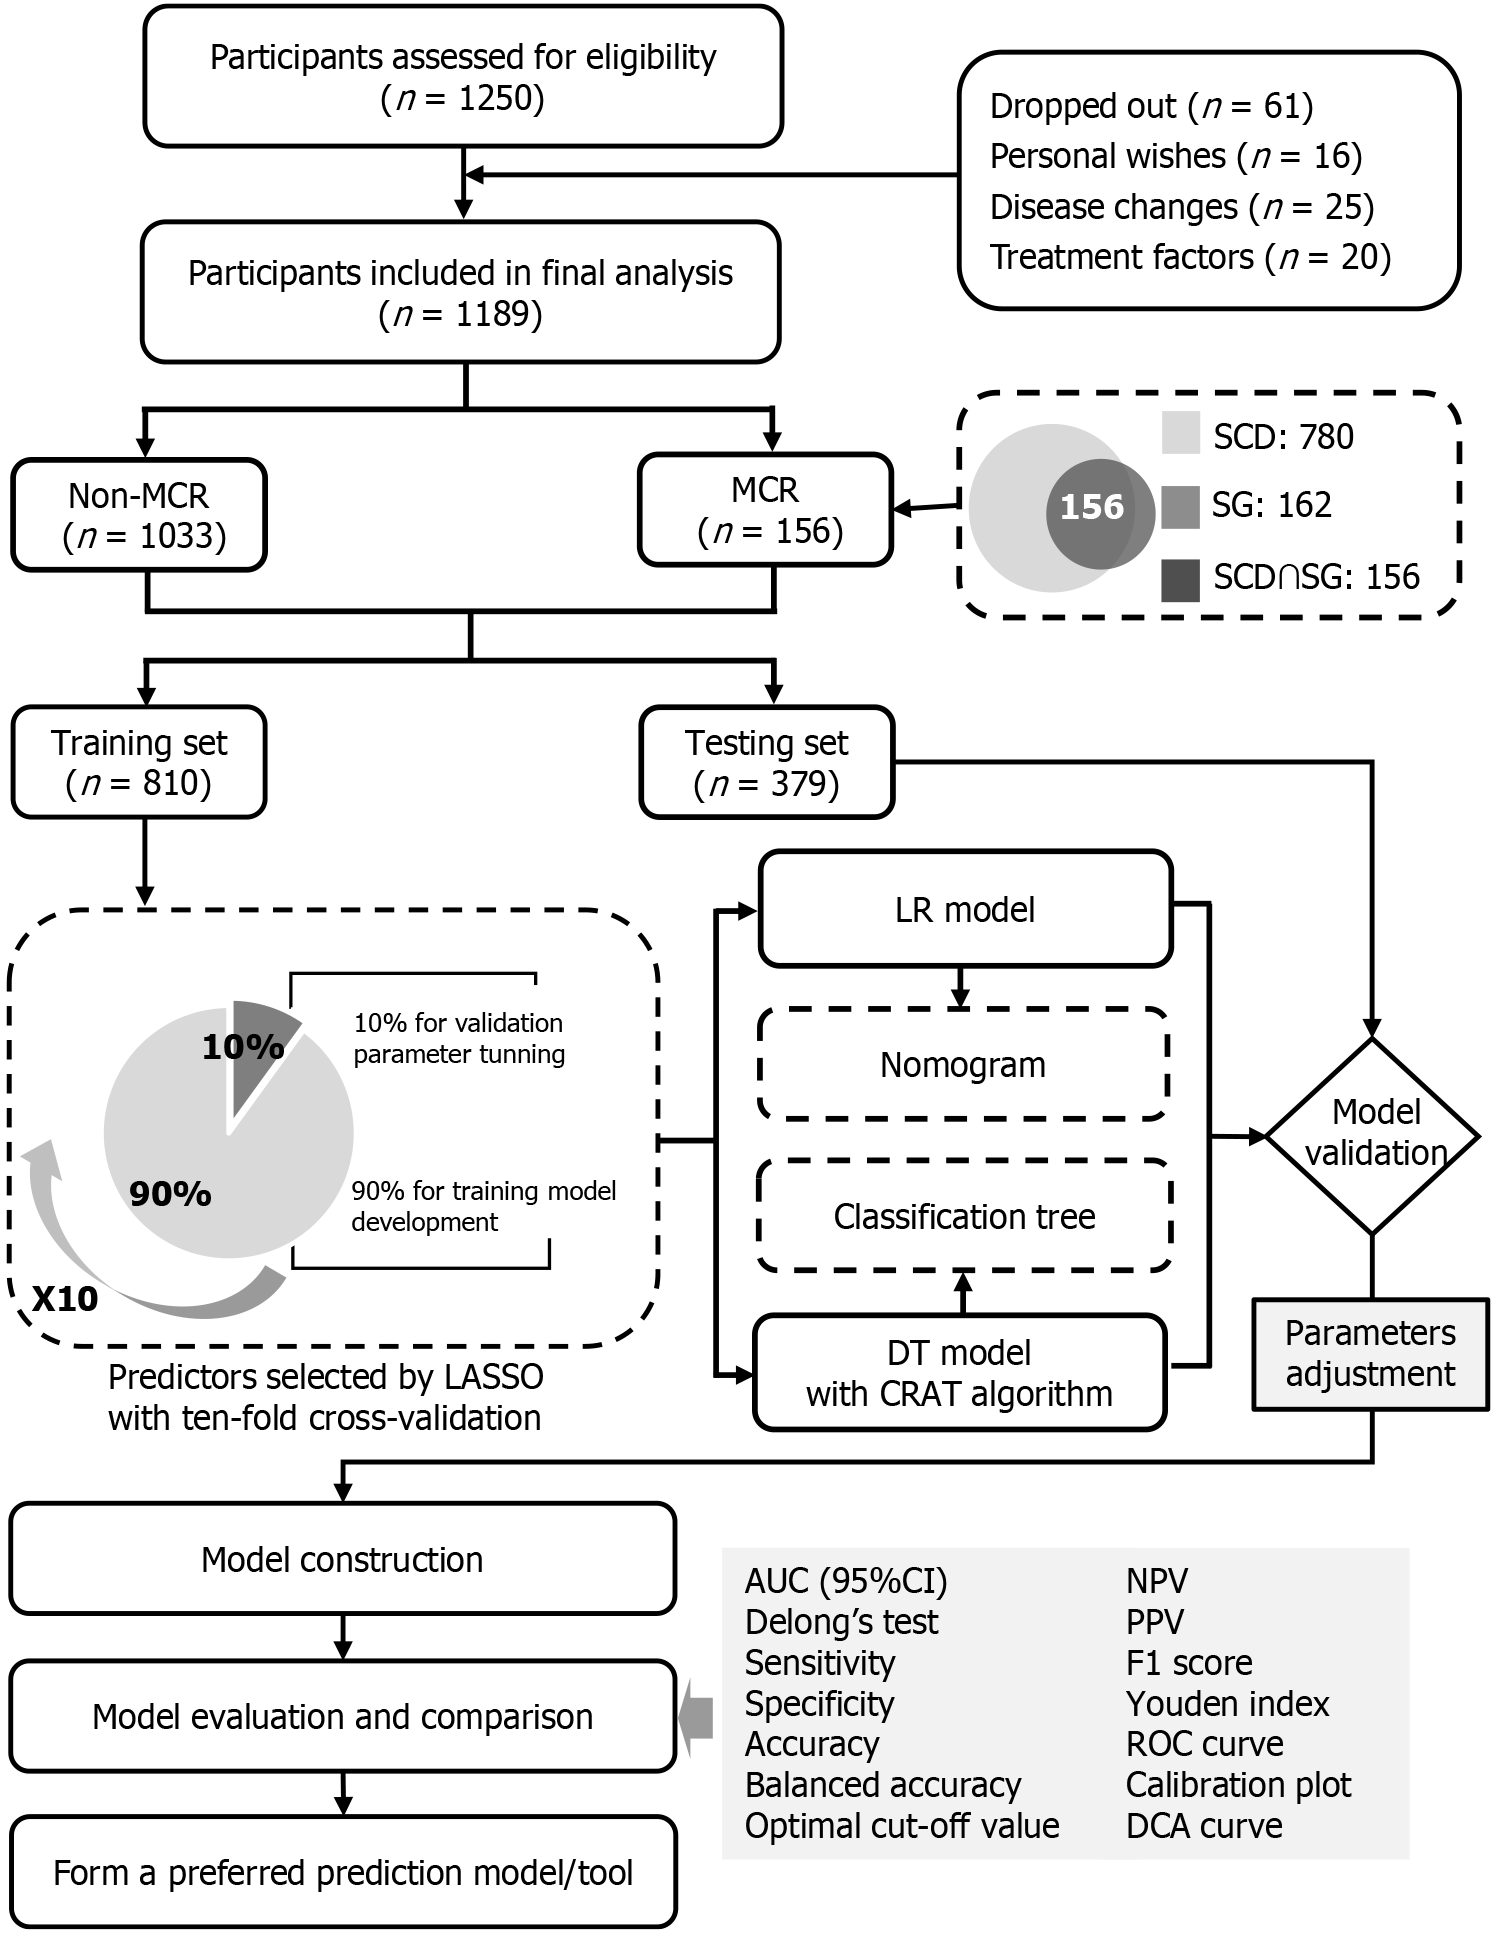
In the current study, 1189 participants were included in the final analysis, of whom 156 were diagnosed with MCR, as depicted in Figure 1. The overall prevalence of MCR was 13.12% (Supplementary Table 4).
Figure 1 Research flowchart and framework of statistical analysis.
Non-MCR: Without motoric cognitive risk syndrome; MCR: Motoric cognitive risk; SCD: Subjective cognitive decline; SG: Slow gait speed; LASSO: Least absolute shrinkage and selection operator; LR: Logistic regression; DT: Decision tree; CRAT: Classification and the regression trees; AUC: Area under the receiver operating characteristic curve; 95%CI: 95% confidence interval; NPV: Negative predictive value; PPV: Positive predictive value; ROC: Receiver operating characteristic curve; DCA: Decision curve analysis.
Characteristics of the study cohort
In Supplementary Table 3, all participants with MCR had a median age of 68.00 years old, with more females (60.05%) than males (39.95%). At baseline, significant differences across the datasets were observed only in education level, social engagement, physical activity level, polypharmacy, hypertension, and personality traits. Meanwhile, the occurrence of MCR was similar between the training dataset (13.33%) and the testing dataset (12.66%).
Results of the predictor-selection
In Supplementary Table 3, 23 predictive variables from the training dataset were statistically significant (P values < 0.10). The LASSO method identified 12 predictors with non-zero coefficients for constructing LR and DT models, including age, education level, pre-retirement occupation, social engagement, physical activity level, history of hospitalization, nutritional status, polypharmacy, hypertension, stroke, depressive symptoms, and purpose in life (Supplementary Figure 1 and Supplementary Table 5). The training dataset exhibited a sufficient positive sample size (108 MCR events vs 12 variables), adhering to the 5-EPV rule[33].
Results of the model construction
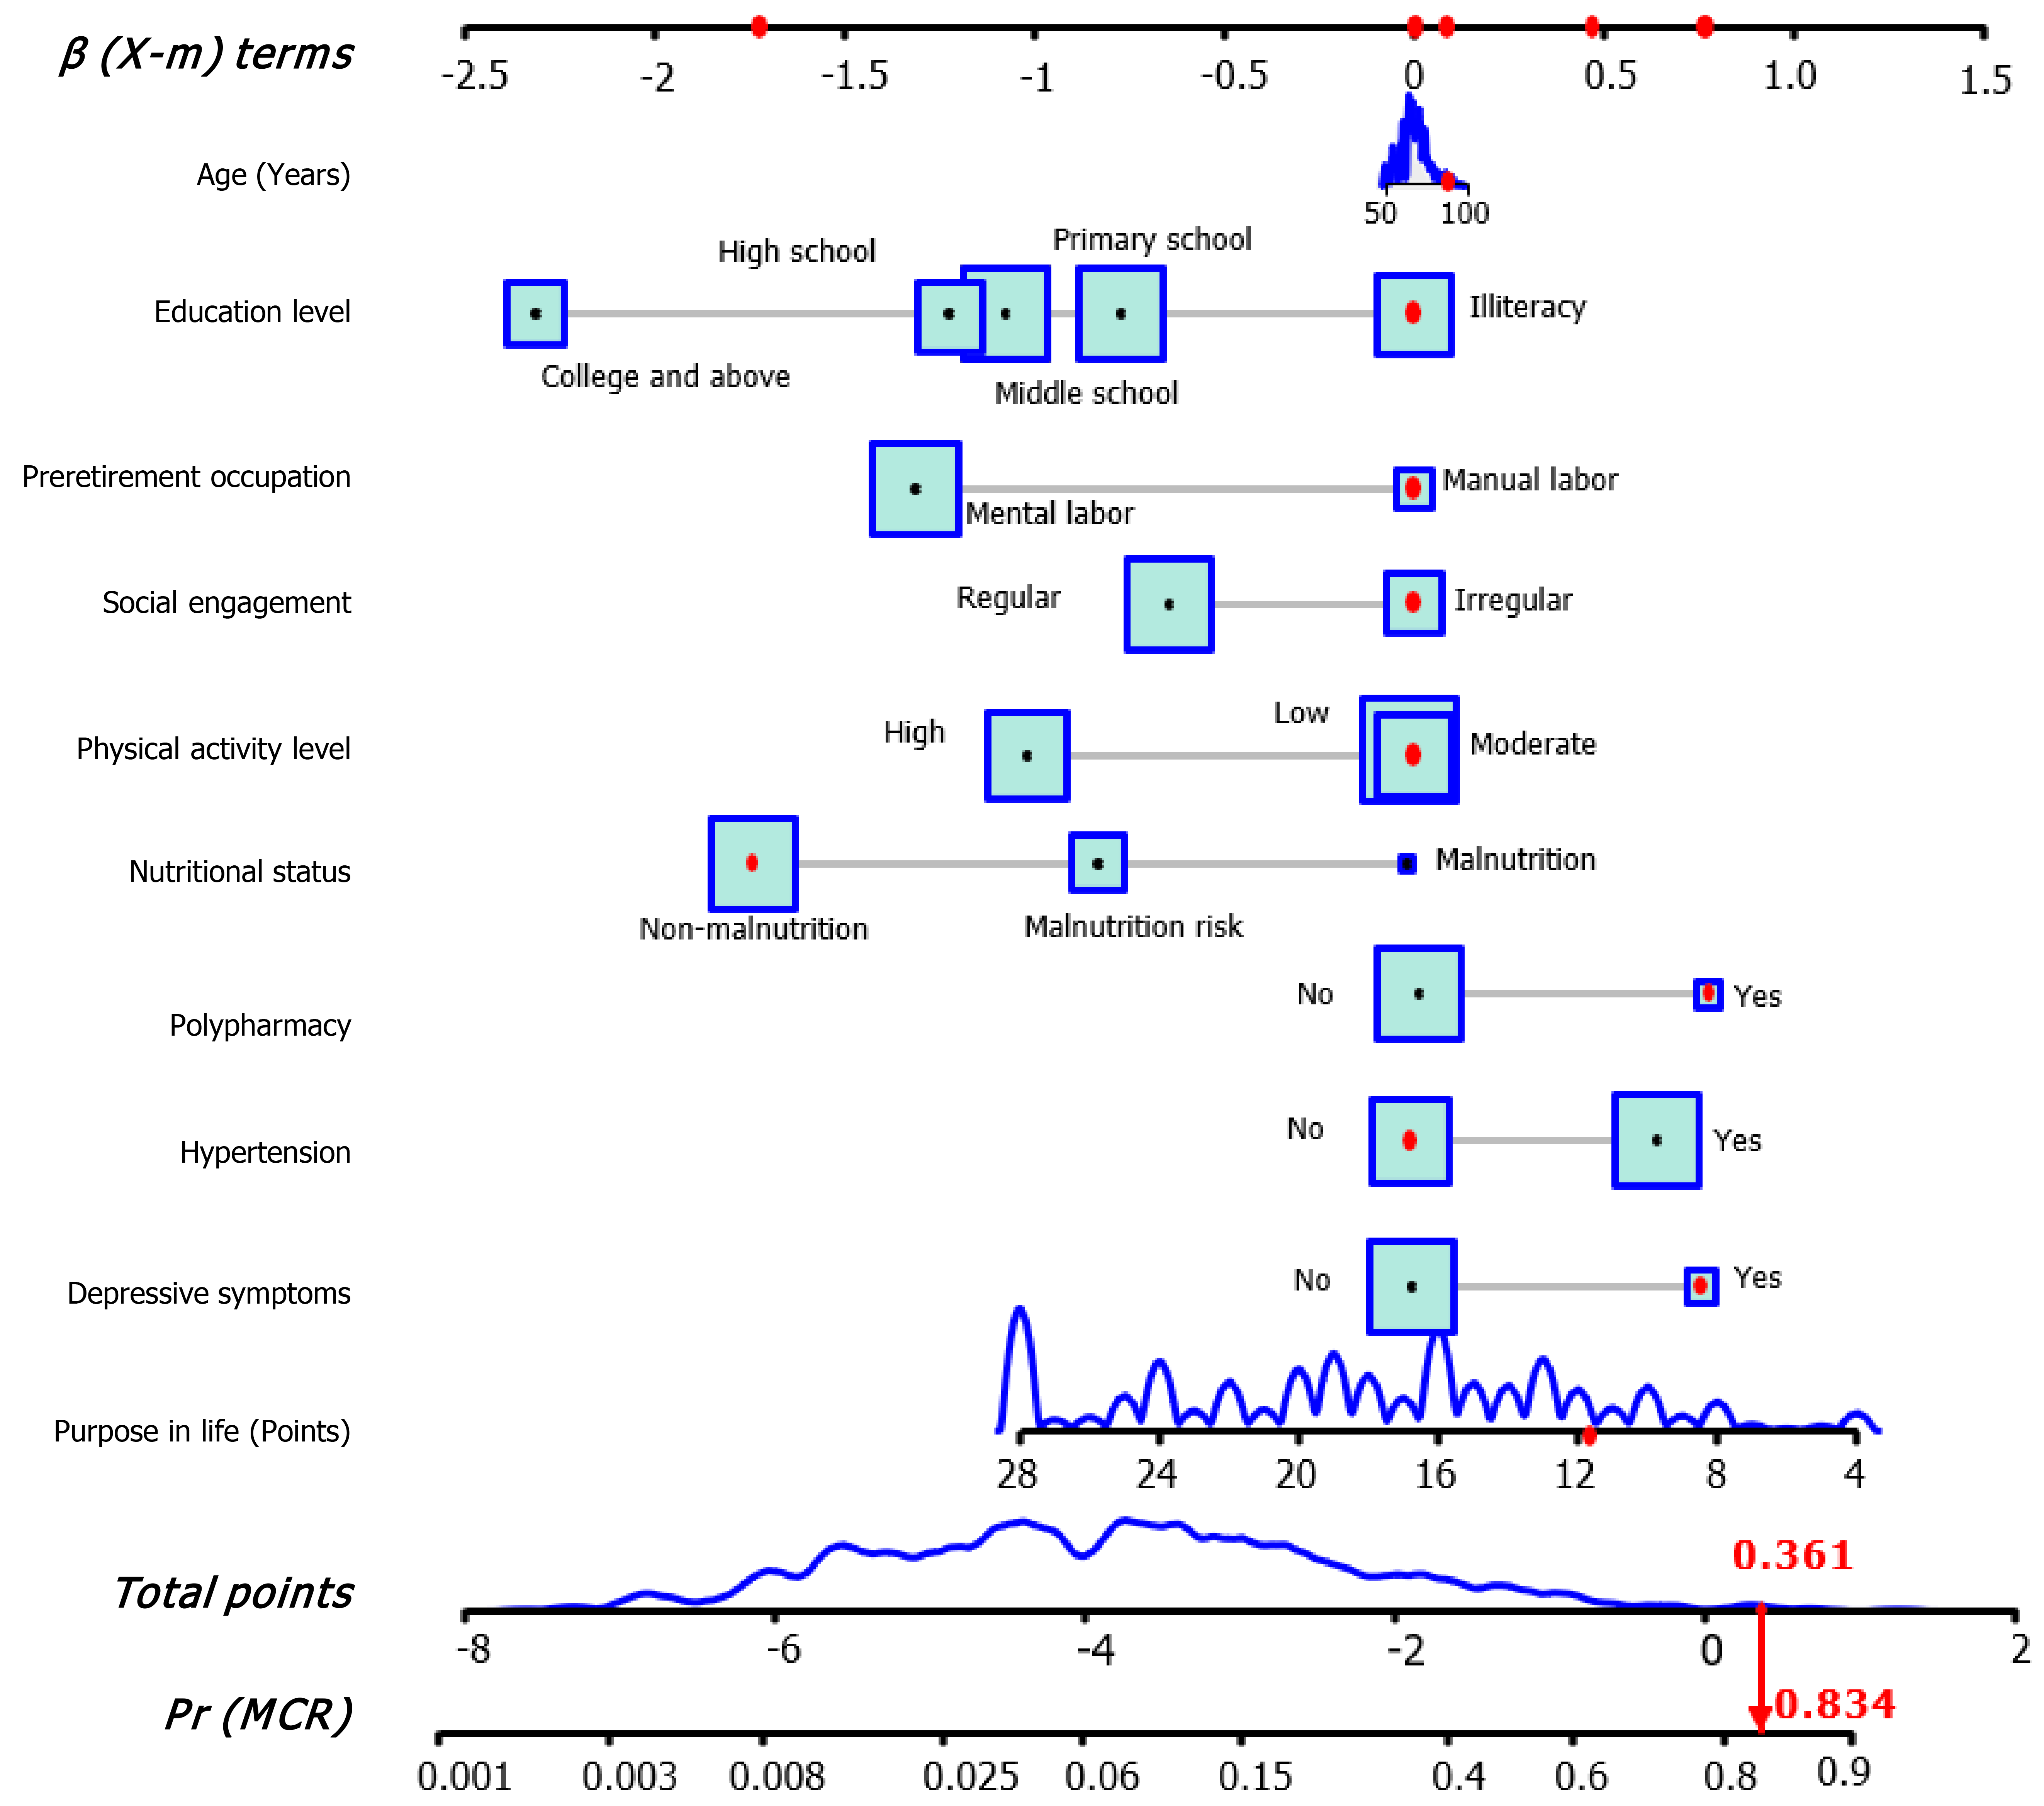
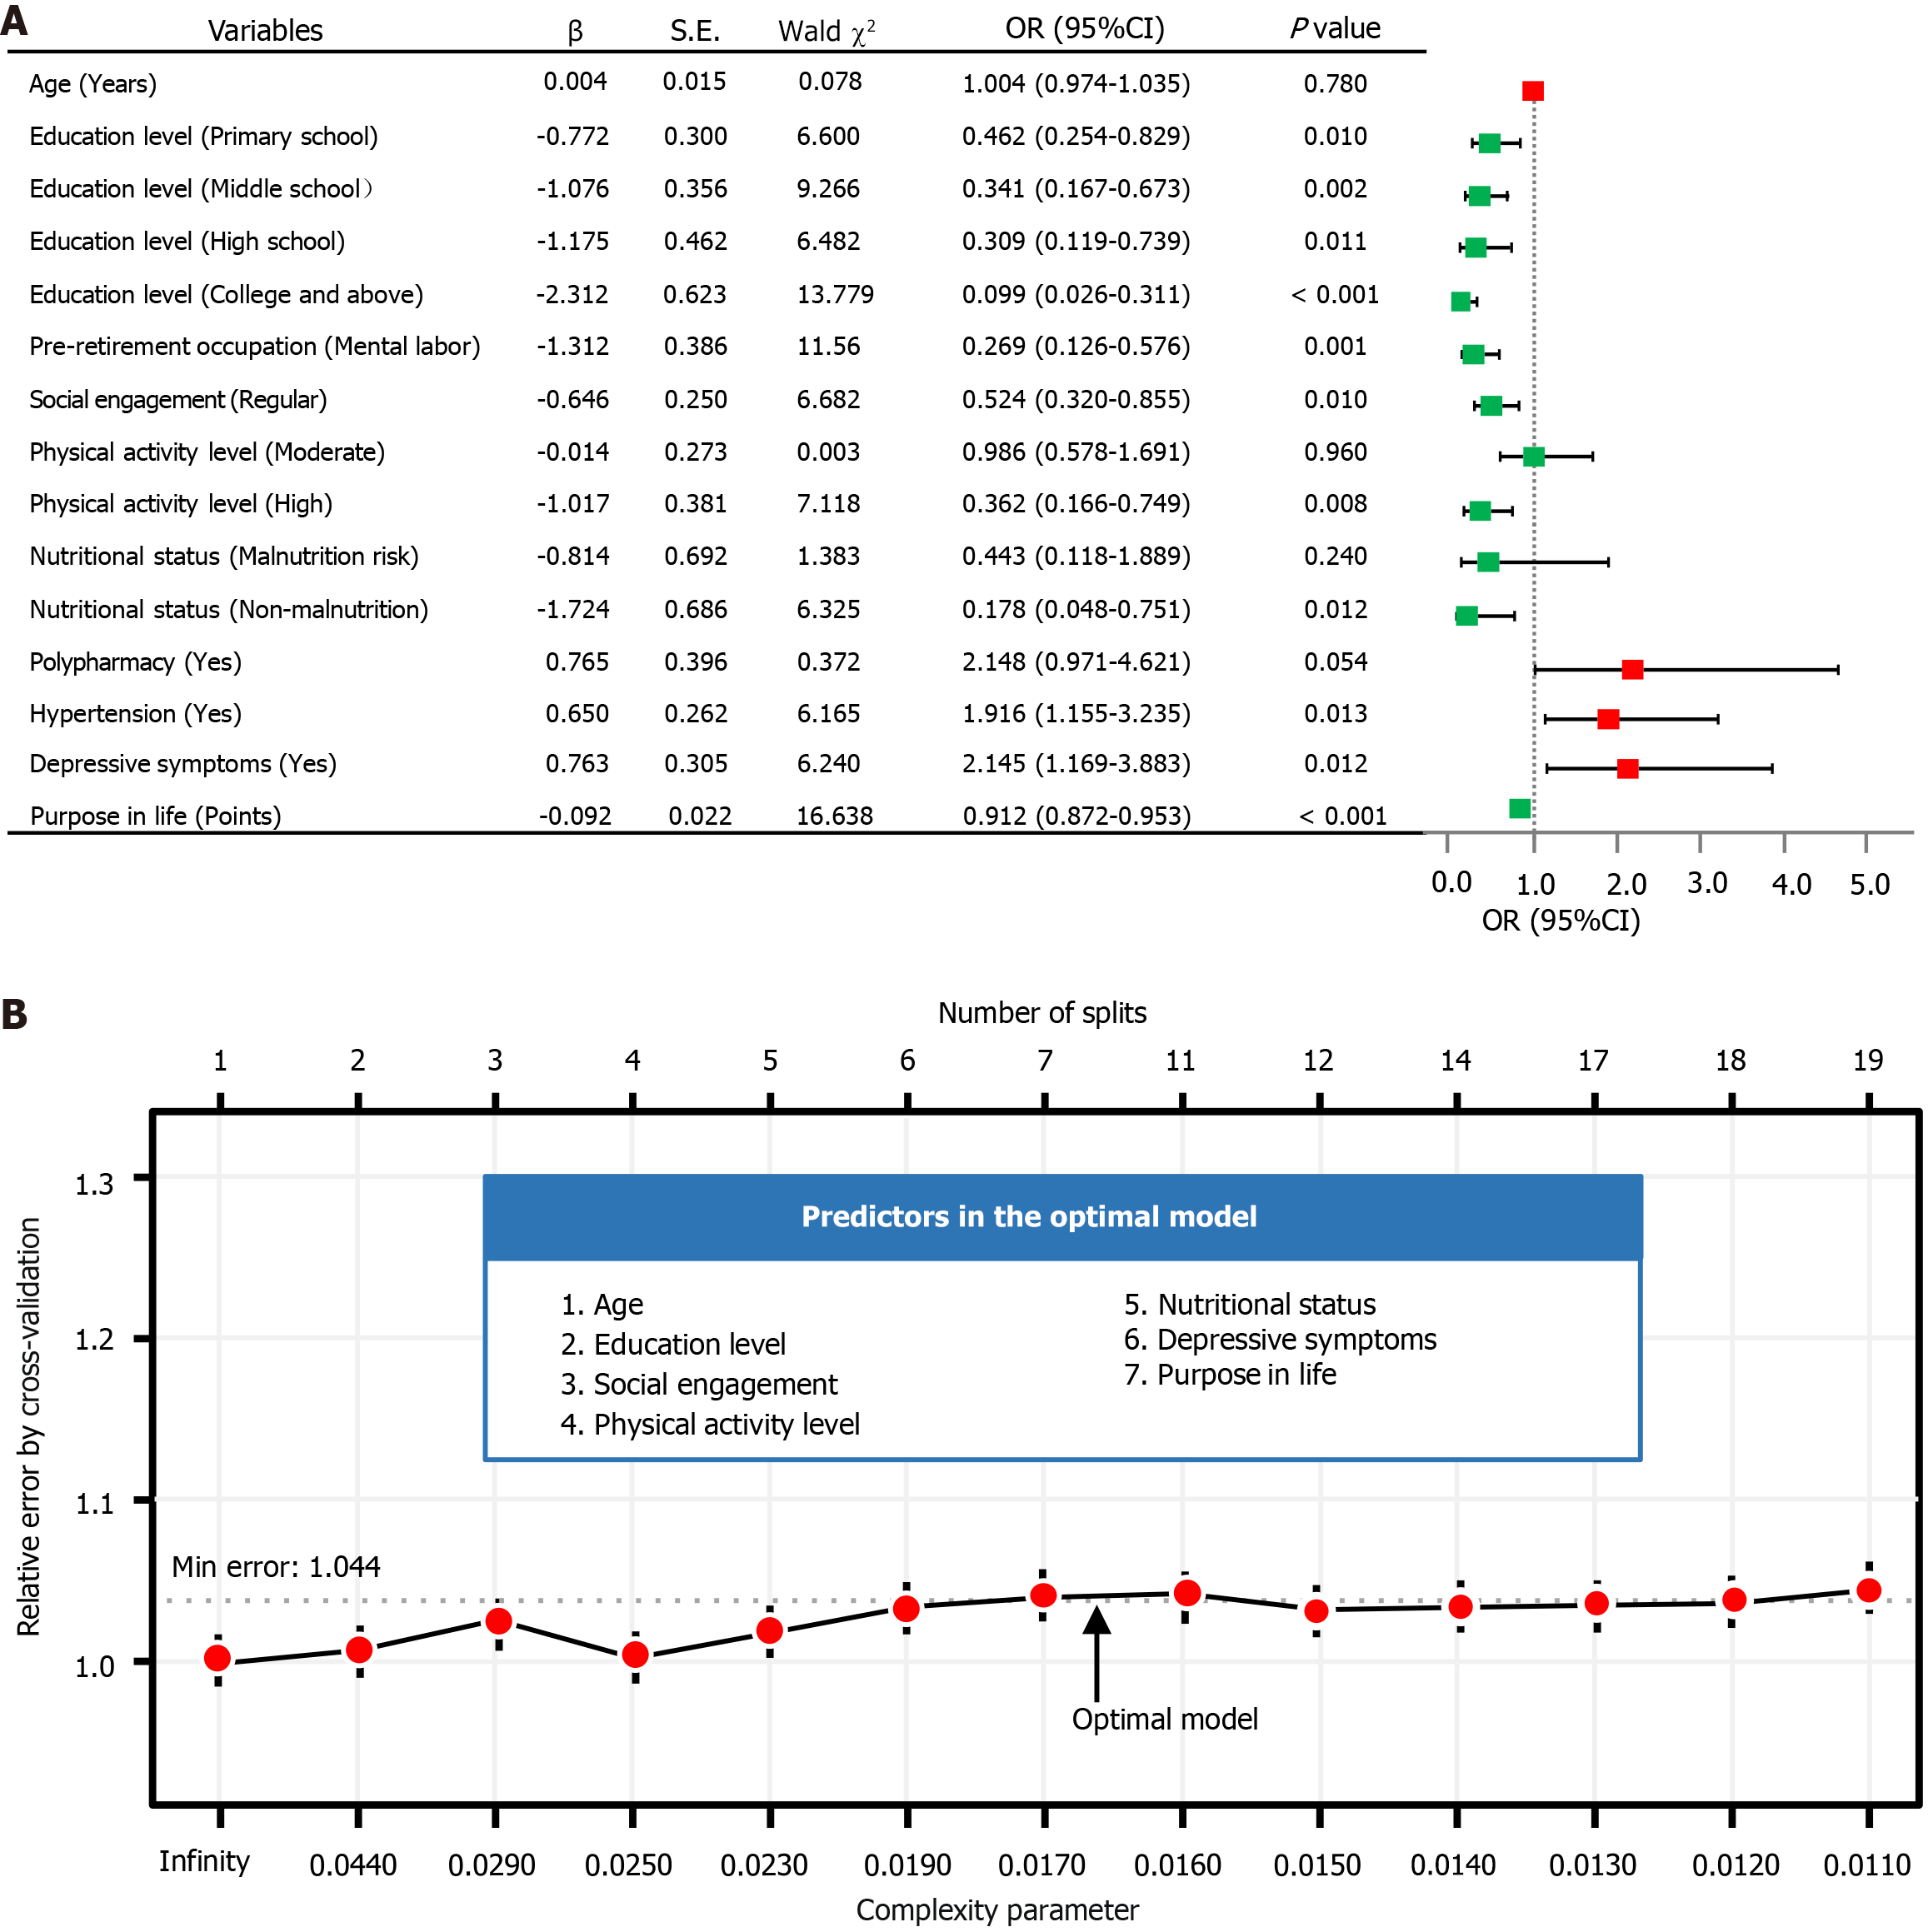
Establishment and exhibition of the LR model: Multivariable LR analysis in Supplementary Table 6 identified nine variables significantly associated with MCR (all P values < 0.05), including education level, pre-retirement occupation, social engagement, physical activity level, nutritional status, polypharmacy, hypertension, depressive symptoms, and purpose in life. Age was also included in the final LR model due to its clinical significance[2,34,35]. Subsequently, a forest plot was generated, followed by the development of an interactive nomogram (Figure 2 and Figure 3A). Education level of primary school or above, mental labor, regular social engagement, high physical activity level, good nutritional status, and high purpose in life scores were identified as protective factors against MCR. In contrast, polypharmacy, hypertension, and depressive symptoms were associated with increased risks of MCR. Additionally, a web calculator was developed based on the LR model (https://webcalculatorofmcr.shinyapps.io/DynNomapp/).
Figure 2 The interactive nomogram for motoric cognitive risk screening.
The nomogram estimates motoric cognitive risk (MCR) probability by summing variable points and locating the total on the scale. Higher points indicate higher risk. For example, an 89-year-old retired manual laborer with irregular social engagement, moderate physical activity, no malnutrition or hypertension, depressive symptoms, and a purpose in life score of 13, has a total point of 0.361, resulting in an estimated MCR probability of 83.4%. MCR: Motoric cognitive risk.
Figure 3 Inference of predictors by two models on training dataset.
A: Multivariable logistic regression (LR) forest plot of motoric cognitive risk; B: Optimization of the decision tree (DT) model using cross-validation. Through the forest plot of LR analysis to construction of the interactive nomogram (odds ratios are tested with Wald χ2 tests with 1 degree of freedom). The figure of DT model displays the dynamic relationship between the relative error (Y-axis), splits number (upper X-axis), and complexity parameter (lower X-axis). OR: Odds ratio; CI: Confidence interval; Min: Minimum.
Establishment and exhibition of the DT model: The DT model, using the CART algorithm as detailed in Supplementary Table 7, was optimized by pruning with a CP of 0.016 and a minimum cross-validation error of 1.044, improving interpretability and predictive performance. The optimal DT model for MCR analysis incorporates seven key variables: Age, education level, social engagement, physical activity level, nutritional status, depressive symptoms, and purpose in life, as illustrated in Figure 3B.
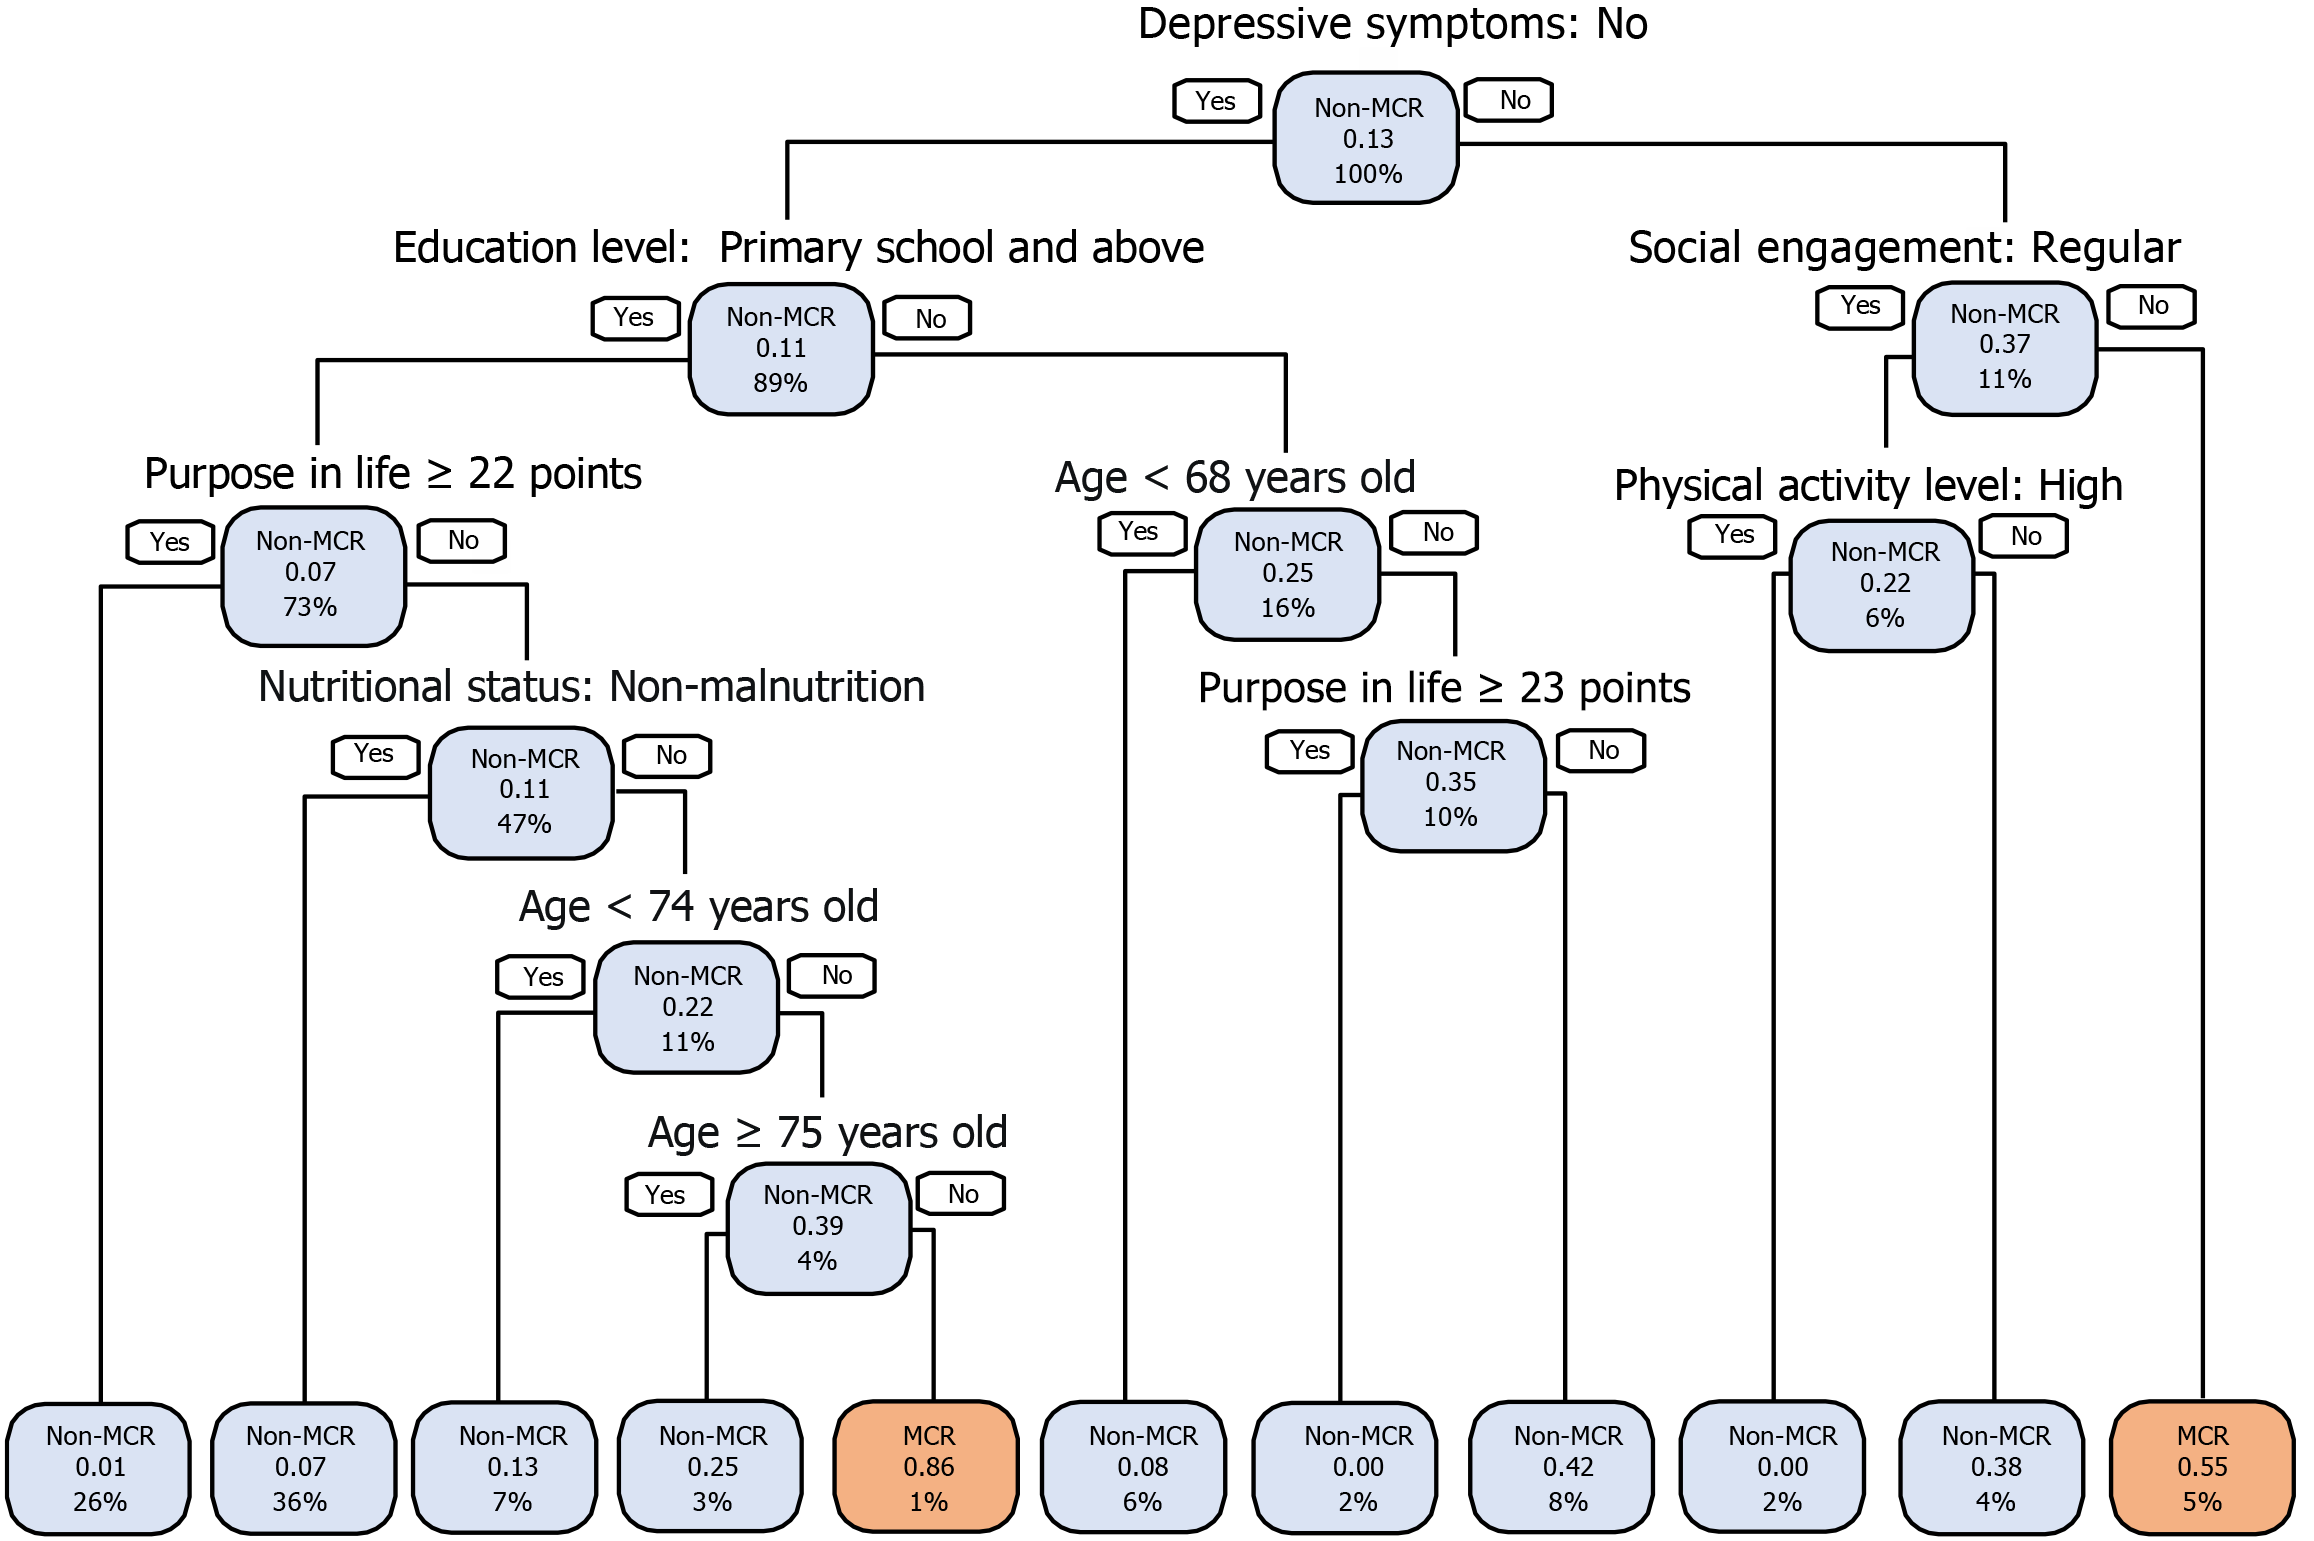
The DT model is visualized as a classification tree in Figure 4, with depressive symptoms positioned at the root node. It features 10 decision nodes and 20 decision paths. The model categorizes MCR occurrence as high (probability above 0.55) or low (below 0.55). Participants needed to answer a minimum of two decision questions (for example, depressive symptoms = yes, social engagement = irregular) to reach a 55% predicted probability of MCR. Up to six questions-depressive symptoms = no, education level = primary school, middle school, high school, or college and above, purpose in life < 22 points, nutritional status = risk of malnutrition or malnutrition, age ≥ 74 years old, and age < 75 years predicted a high MCR probability of 86%. These factors are integrated into a web classifier (https://Limingsu.github.io/prediction_web/).
Figure 4 Visualization of the classification tree of decision tree model for identifying motoric cognitive risk.
Each node’s text shows the predicted event [non-motoric cognitive risk (MCR)/MCR], the estimated event probability, and the percentage of participants in the training dataset. Blue nodes indicate higher non-MCR prevalence, while pink nodes indicate higher MCR prevalence. The classification tree, constructed using the training dataset, incorporating age, purpose in life, nutritional status, education level, social engagement, depressive symptoms, and physical activity level. MCR: Motoric cognitive risk.
Results of the model performance
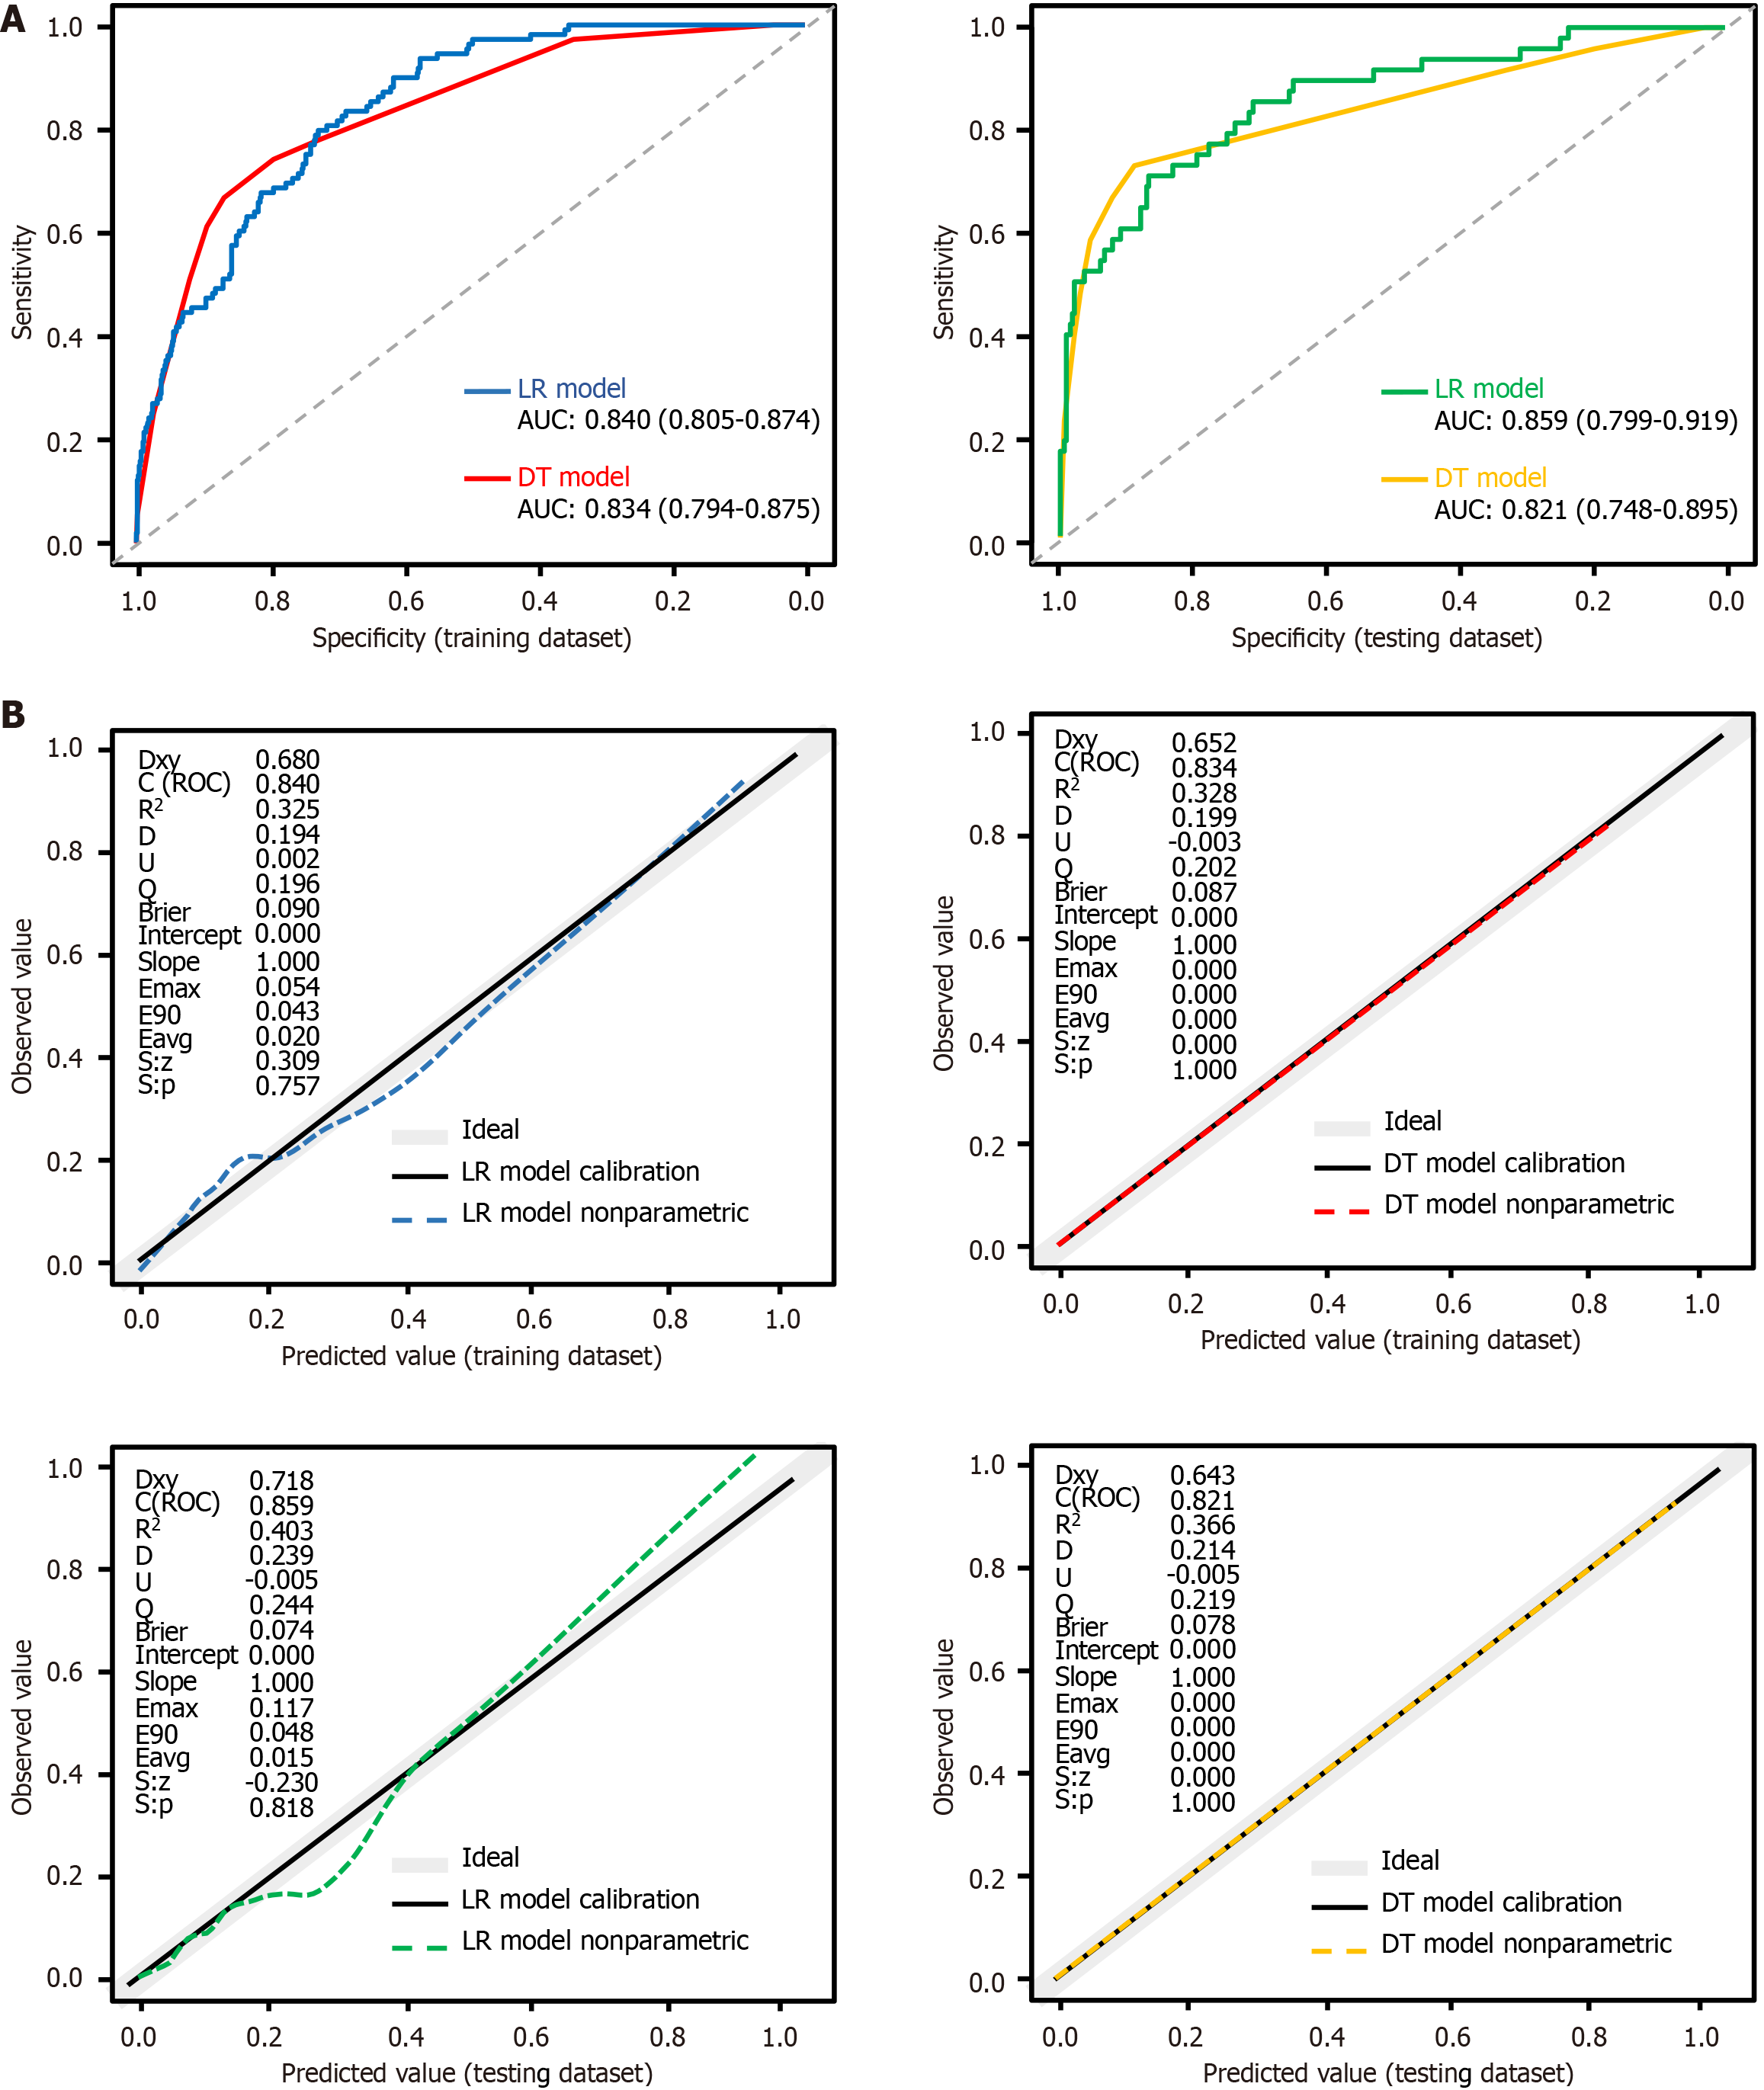
Model discrimination and comparison of the model’s area under the curves: The confusion matrix results for LR and DT models across both datasets are detailed in Supplementary Tables 8 and 9, with performance metrics presented in Supplementary Table 10. In the training dataset, the LR model outperformed the DT model in accuracy, specificity, positive predictive value, and F1 score. However, performance was comparable between both models in the testing dataset. While both models indicated similar balanced accuracy in the training dataset, the LR model slightly underperformed compared to the DT model in the testing dataset. Sensitivity was higher for the LR model in the training dataset but lower in the testing dataset, whereas negative predictive values were similar across datasets for both models. Both models demonstrated strong discriminatory performance, with area under the curve (AUC) values ≥ 0.8 (Supplementary Table 10 and Figure 5A). Minimal differences in AUCs [0.006, 95% confidence interval (CI): -4.569 to 2.867] and 0.038 (95%CI: -11.125 to 2.258) suggested that the DT model’s screening capability is comparable to that of the LR model
(Supplementary Table 10 and Figure 5A).
Figure 5 The receiver operating characteristic curves and calibration plots for both models on training dataset and testing dataset.
A: Receiver operating characteristic and area under the curve for both models in training dataset and testing dataset; B: Calibration plots for both models in both datasets. The dashed line represents the predicted value curve; the black solid line represents the actual value curve and the gray line represents the ideal reference curve at 45°. P values > 0.05 in all four graphs indicate no statistically significant difference between the predicted and actual incidence curves. LR: Logistic regression; DT: Decision tree; AUC: Area under the receiver operating characteristic curve; ROC: Receiver operating characteristic curve.
Model calibration: Figure 5B illustrates the calibration and discrimination of both models across training and testing datasets. The predicted curves of both models closely align with the actual value curves, with statistically non-significant differences observed (all P values > 0.05). The LR model exhibited an average absolute error of 0.020 in the training dataset and 0.015 in the testing dataset for predicting MCR occurrence, whereas the DT model achieved a perfect average absolute error of 0.000 in both datasets. The DT model demonstrated superior calibration, as its predicted values perfectly followed the diagonal line in both datasets, indicating no deviation. In contrast, the LR model exhibited deviations of 0.054 in the training and 0.117 in the testing dataset.
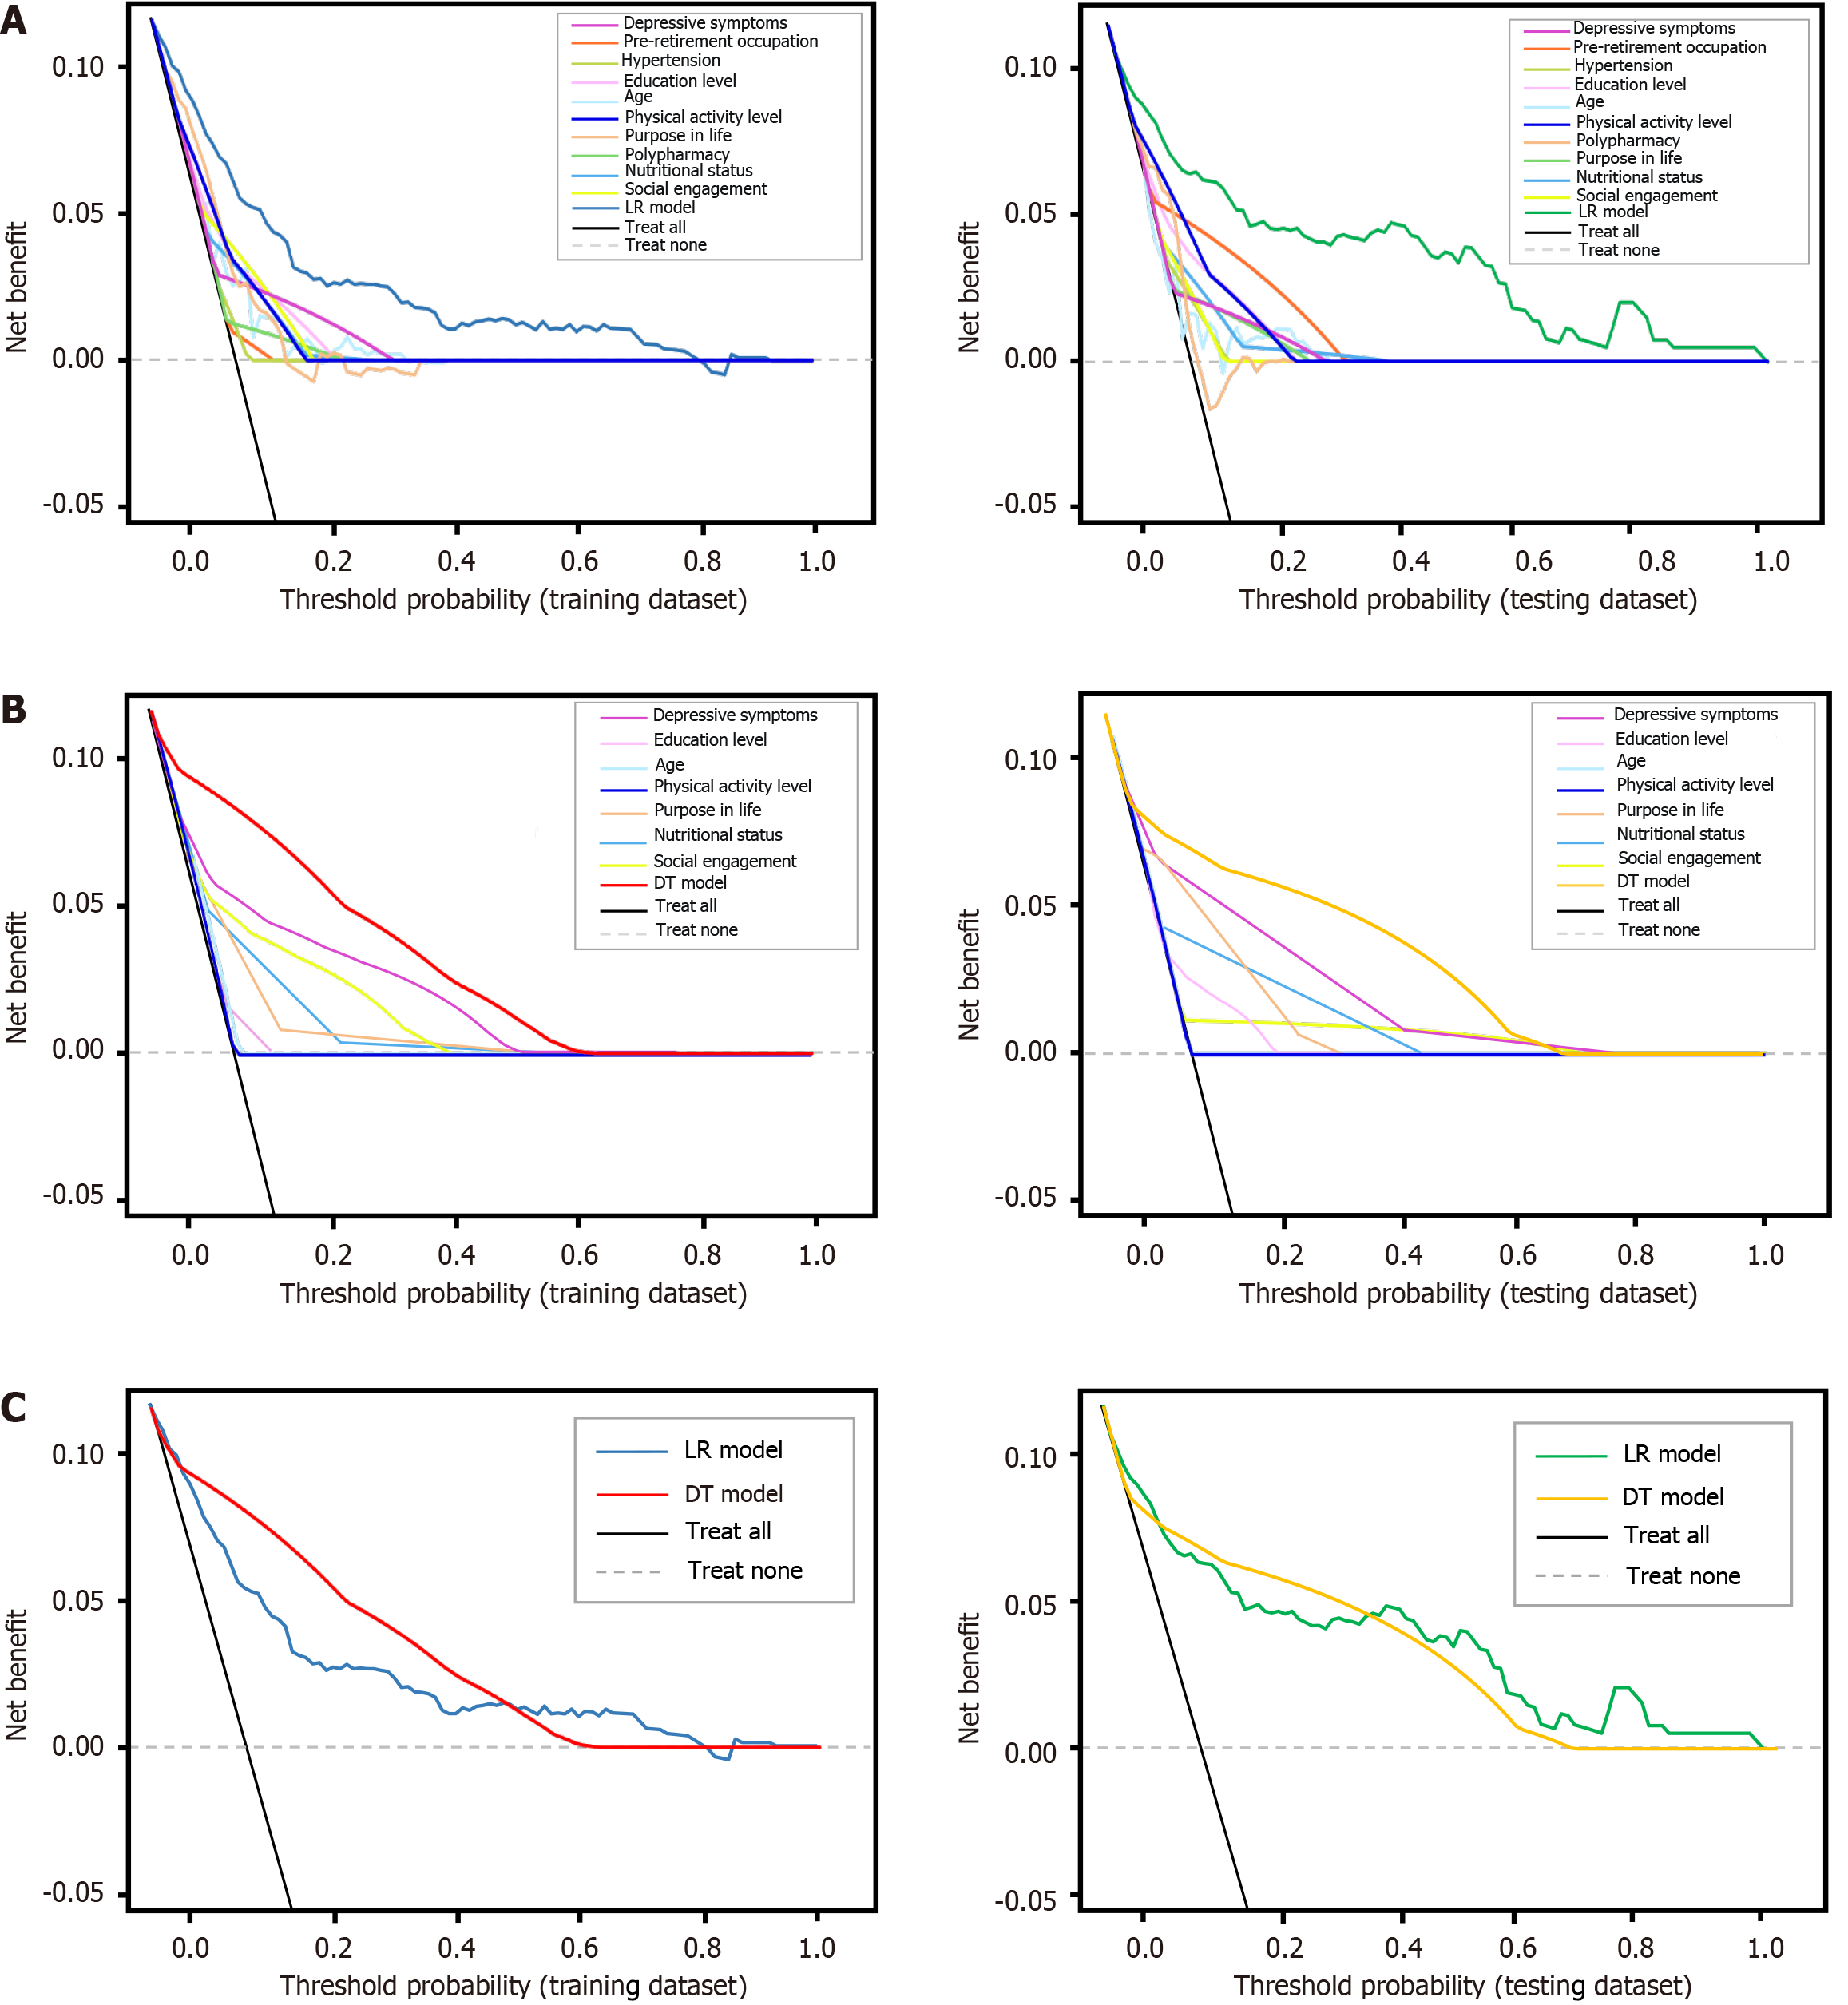
Model clinical utility: Figure 6 depict the clinical utility of both models are evaluated by DCAs on the training and testing datasets. LR and DT models demonstrated clinical benefit in predicting MCR among middle-aged and older adults when the threshold probability range was below 70%, with overlapping curves indicating similar net benefits. In the training dataset, the DT model exhibited a slightly higher benefit than the LR model and performed comparably in the testing dataset.
Figure 6 The decision curve analyses curves for both models on training dataset and testing dataset.
A: Decision curve analyses (DCA) curves for logistic regression (LR) models and its ten predictors in both datasets; B: DCA curves for decision tree (DT) models and its seven predictors in both datasets; C: DCA curves for both models in both datasets. The grey dashed line represents no motoric cognitive risk (MCR) in individuals, the black solid line represents MCR occurred in all individuals, and the lines between them indicates the net benefit of using the LR or DT models for MCR prediction. The X-axis represents threshold probabilities, and the Y-axis represents net benefit. LR: Logistic regression; DT: Decision tree.
Key predictors among the important variables: SHAP values[41] were used to quantify the importance of each predictor in MCR screening for both models. The predictors were ranked from most to least influential, with the top seven being depressive symptoms, nutritional status, social engagement, physical activity level, education level, age, and purpose in life.
DISCUSSION
Summary of the findings
The low prevalence of MCR is often overlooked; however, its risk of progressing to dementia underscores the importance of high-precision screening. The current study pioneers the application of ML to develop and validate accessible web-based tools for MCR screening, incorporating modifiable risk factors. The DT model outperformed the LR in calibration and DCA trends. Moreover, seven predictors were identified as crucial for assessing the occurrence of MCR.
Comparison with the current models for MCR prediction
In a previous study, LASSO was employed to identify key features of MCR without evaluating a predictive model’s performance[2]. Traditional LR was later applied to assess subjective MCR[42], but the approach faced issues such as recall bias and information concealment[43]. In the current study, LASSO was employed to minimize collinearity, thereby enhancing the performance of LR and DT models in classifying MCR occurrence. The nomogram derived from the LR model offers a precise risk point-scoring scheme, although its interpretability remains limited[44]. Conversely, the DT model offered intuitive classification with visualized predictors and optimal clinical thresholds[24].
Model performance evaluation
LR and DT models satisfactorily predicted MCR in both datasets, demonstrating good discrimination, calibration, and clinical utility with modifiable risk factors for screening MCR occurrence. Consistent with the findings of Marioni et al[26], the DT model outperformed the LR model in predicting dementia. In terms of calibration, the DT model also indicated superior performance, whereas the LR model exhibited potential issues of underestimation and overestimation. The current study evaluated whether clinical decisions based on the models would enhance outcomes, thereby justifying their clinical utility. DCAs indicated that the DT model provided slightly higher net benefits in the training dataset and performed comparably in the testing dataset.
Application and interpretability of models
The LR model utilized a nomogram with significant variables to calculate MCR probabilities, improving interpretability. The DT model featured a classification tree resembling clinical decision-making, segmenting MCR occurrence into 20 decision paths for quick probability assessment. Depressive symptoms, as the root node, underscore their significance in MCR occurrence. Cutoff values and other factors were crucial for accurate MCR prediction. The DT model distinguished probabilities based on decision paths, even when they were numerically identical[44], demonstrating a nuanced assessment. For example, it classified two individuals with a 0.00% MCR probability differently based on their symptoms and lifestyle factors.
Important modifiable risk factors with MCR
Feature importance analysis using SHAP identified seven crucial predictors: Depressive symptoms, nutritional, social engagement, physical activity, education level, age, and purpose in life. The SHAP ranking offers insights for calculating index weights in screening tools and highlights the importance of initially assessing depressive symptoms for MCR screening.
Depressive symptoms were significantly linked to MCR, confirming findings from prior interaction studies[9,14]. Depressive symptoms may signal early neurocognitive disorders in middle-aged and older adults with low education, potentially linked to vascular brain disease or neurodegeneration[35]. Aging contributes to subcortical white matter hyperintensity, as well as reductions in cerebellar gray matter and hippocampal volume, which are associated with decreased gait speed and cognitive impairment[45], thereby accelerating the onset of MCR. In the DT model, participants aged 75 years and older had a higher MCR occurrence than those under 74 years (25% vs 13%). High-risk groups for MCR, especially those aged 74, exhibited lower life purpose and increased susceptibility to malnutrition, with MCR rates reaching up to 86%. This observation could reflect specific sample traits or have broader clinical relevance, warranting further exploration with a larger sample. A high proportion of malnutrition among participants, which impacts brain function and increases white matter hyperintensities, was associated with MCR, consistent with a prior study[46]. Sutin et al[12] discovered a connection between a lower sense of life purpose and MCR, independent of depressive symptoms, potentially due to emerging neuropsychiatric symptoms. Meanwhile, lower education levels may diminish cognitive reserve and accelerate cognitive deterioration[26]. Physical activity and social engagement protect against MCR, with the former boosting cerebral circulation and the latter mitigating age-related brain changes and cognitive impairment[47] through neurobiological pathways[48]. Besides, the DT model demonstrated that factor interactions significantly affect MCR development probabilities. Consequently, prioritizing cost-effective early detection and interventions targeting modifiable risk factors are essential for effective MCR management.
Clinical implication and future application
The current study revealed a 13.12% point prevalence of MCR, underscoring the need for improved screening and management. The developed LR and DT models serve as MCR screening tools, with the DT model recommended for broader use due to its simplicity and balanced performance, whereas the LR model is better suited for precise assessments in high-risk individuals[49]. Future efforts should focus on integrating these screening tools into community health systems for digital MCR screening, thereby enhancing cognitive impairment services through guidance, follow-up, and referrals for high-risk individuals.
Strengths and limitations
The current study has several strengths: It validated known associations with MCR and identified new risk factors. The recommended tool uses non-invasive, easily evaluated predictors to cost-effectively screen high-risk MCR groups that are undetected in community settings, particularly in underserved areas. However, the current study has four main limitations: (1) Single-region sampling limits generalizability; (2) Potential selection bias affects model stability; (3) Inclusion of only adults aged 50 and above may limit applicability to younger at-risk populations; and (4) Insufficient data prevents confirming the ML model’s impact on decision-making. Future research should integrate the screening tool into community healthcare, establish internal controls for reproducibility, and conduct prospective clinical trials. The absence of ML analyses on biomarkers and imaging reduced predictive accuracy, and variability in feature interpretation complicates retrospective use. Future studies should standardize criteria, simplify models for clinical application, and consider including younger at-risk populations to enhance generalizability and support early detection.


