Copyright
©The Author(s) 2025.
World J Psychiatry. Aug 19, 2025; 15(8): 105433
Published online Aug 19, 2025. doi: 10.5498/wjp.v15.i8.105433
Published online Aug 19, 2025. doi: 10.5498/wjp.v15.i8.105433
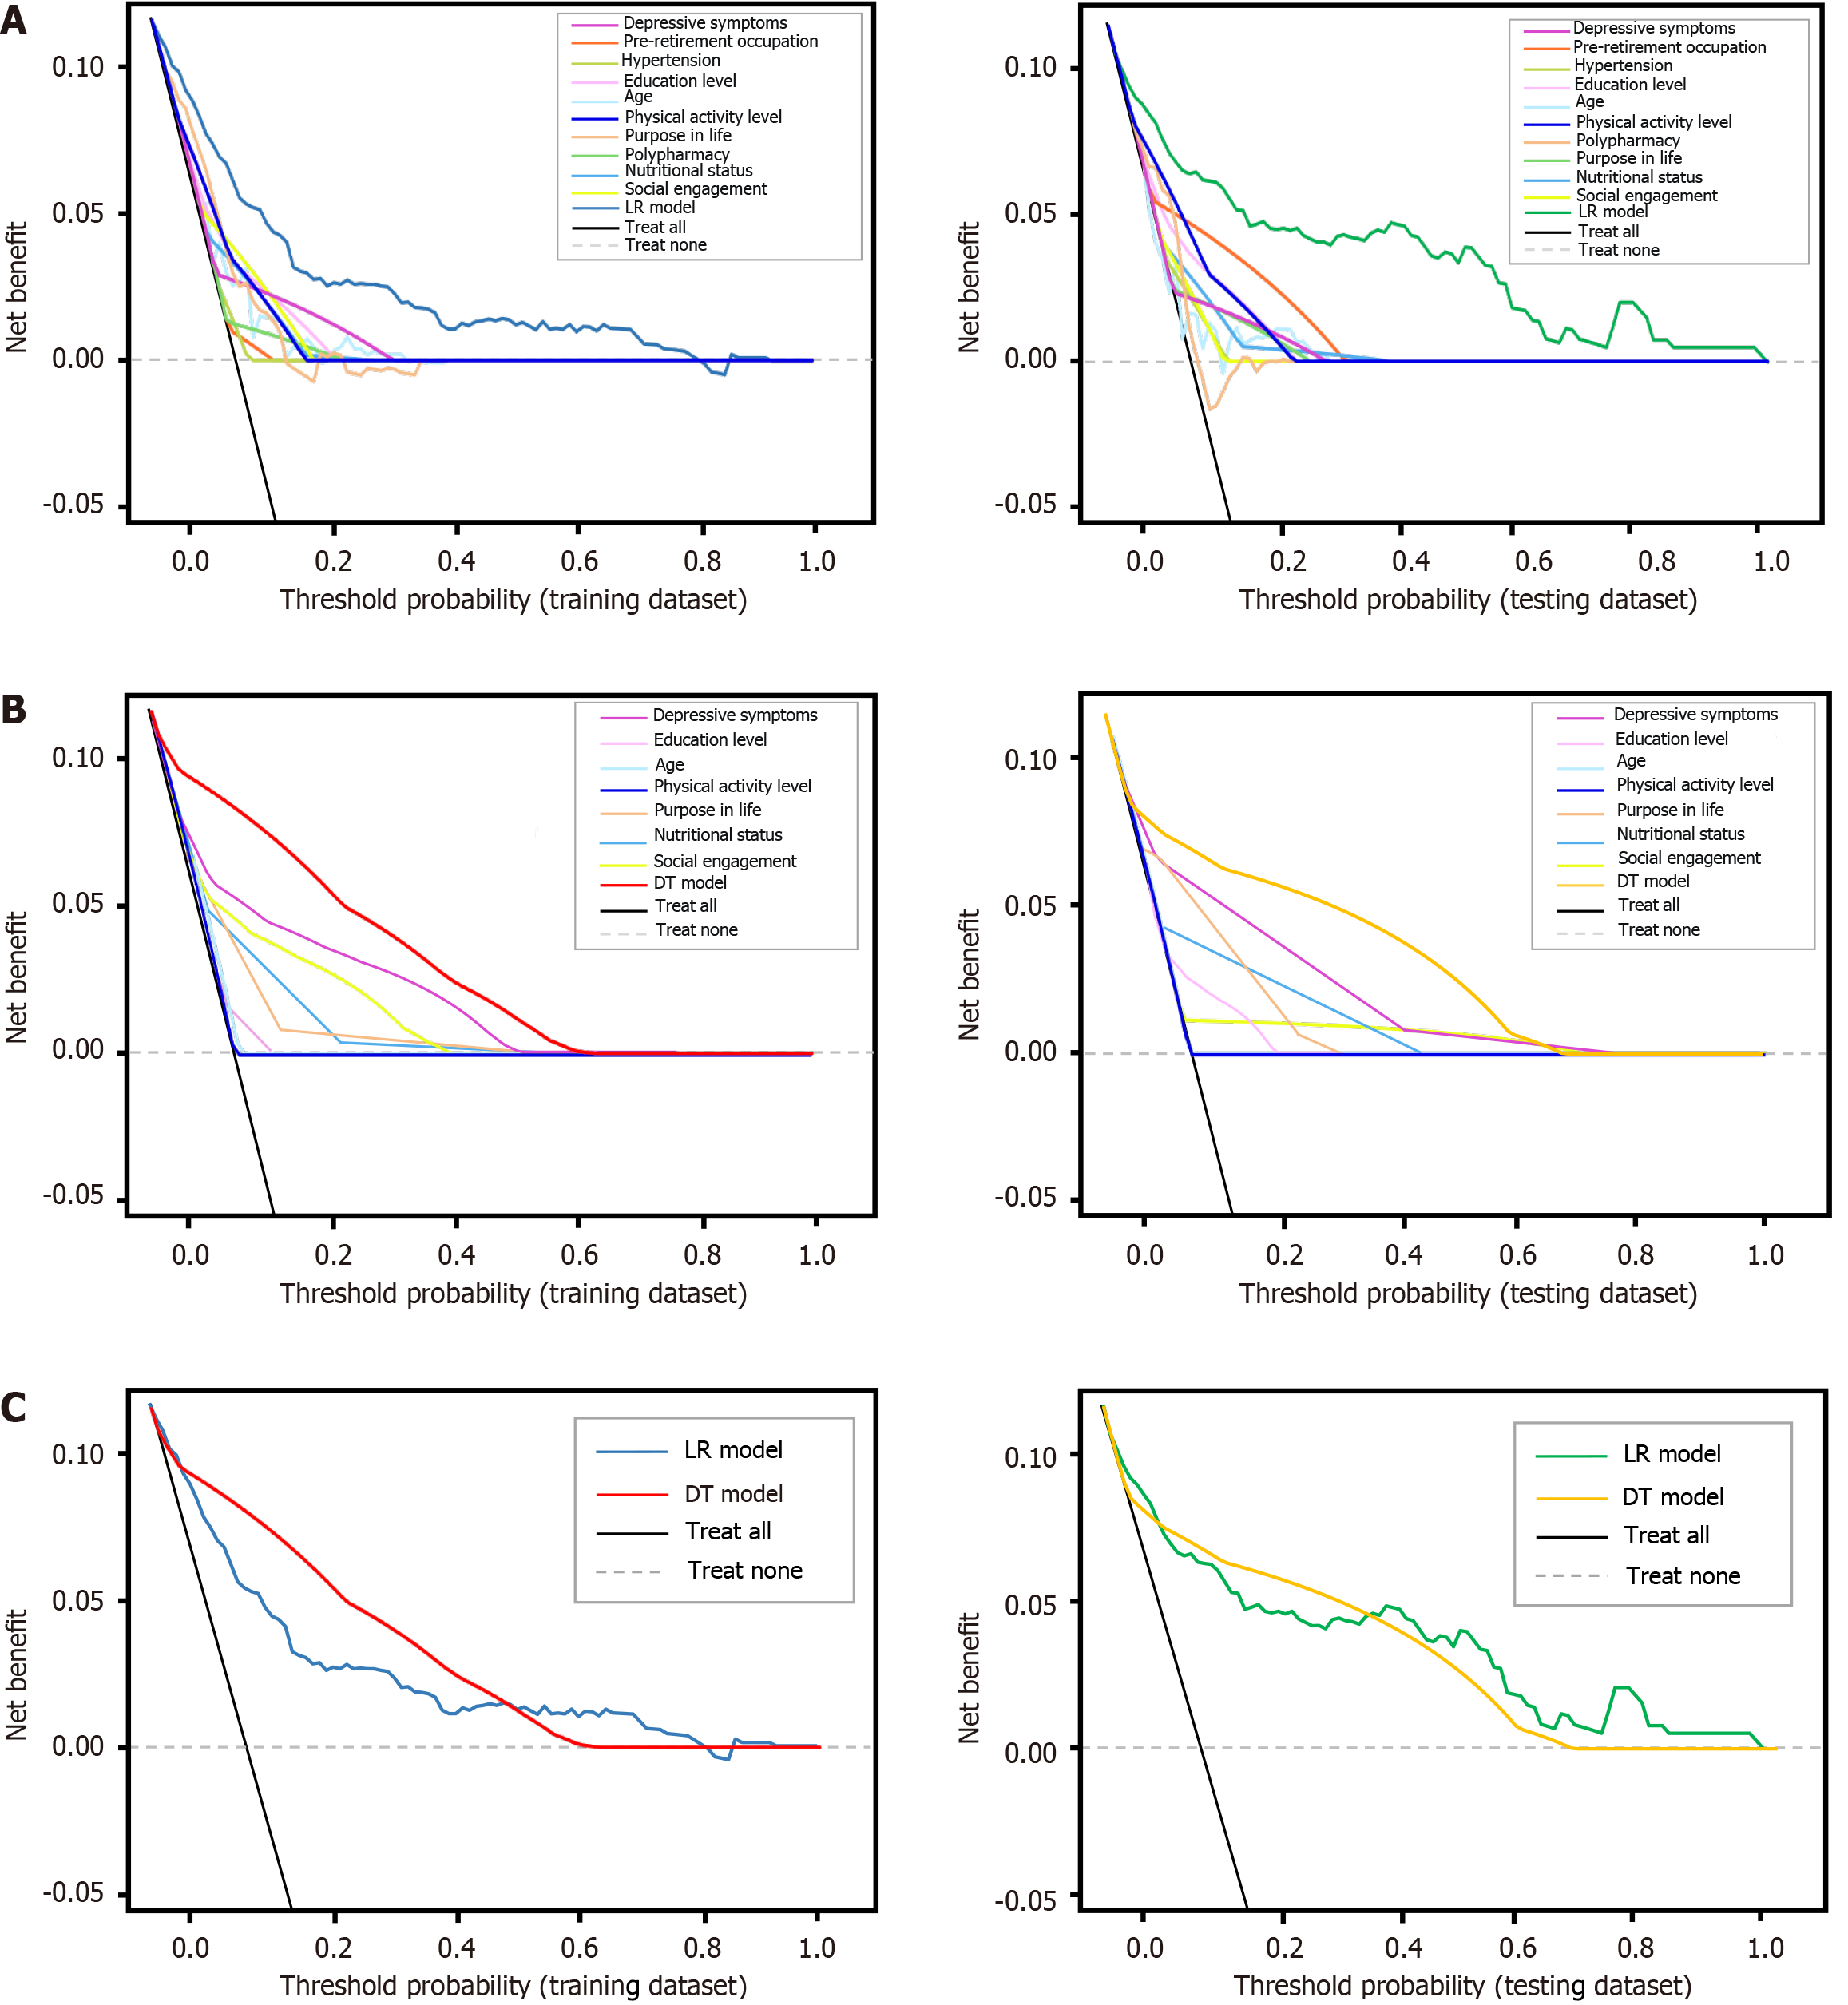
Figure 6 The decision curve analyses curves for both models on training dataset and testing dataset.
A: Decision curve analyses (DCA) curves for logistic regression (LR) models and its ten predictors in both datasets; B: DCA curves for decision tree (DT) models and its seven predictors in both datasets; C: DCA curves for both models in both datasets. The grey dashed line represents no motoric cognitive risk (MCR) in individuals, the black solid line represents MCR occurred in all individuals, and the lines between them indicates the net benefit of using the LR or DT models for MCR prediction. The X-axis represents threshold probabilities, and the Y-axis represents net benefit. LR: Logistic regression; DT: Decision tree.
- Citation: Su LM, Wu B, Chen Z, Wang XY, Shen XH, Wei ZQ, Cheng H, Wang LN. Development and validation of screening tools for motoric cognitive risk syndrome in community settings. World J Psychiatry 2025; 15(8): 105433
- URL: https://www.wjgnet.com/2220-3206/full/v15/i8/105433.htm
- DOI: https://dx.doi.org/10.5498/wjp.v15.i8.105433


