Copyright
©The Author(s) 2025.
World J Psychiatry. Aug 19, 2025; 15(8): 105433
Published online Aug 19, 2025. doi: 10.5498/wjp.v15.i8.105433
Published online Aug 19, 2025. doi: 10.5498/wjp.v15.i8.105433
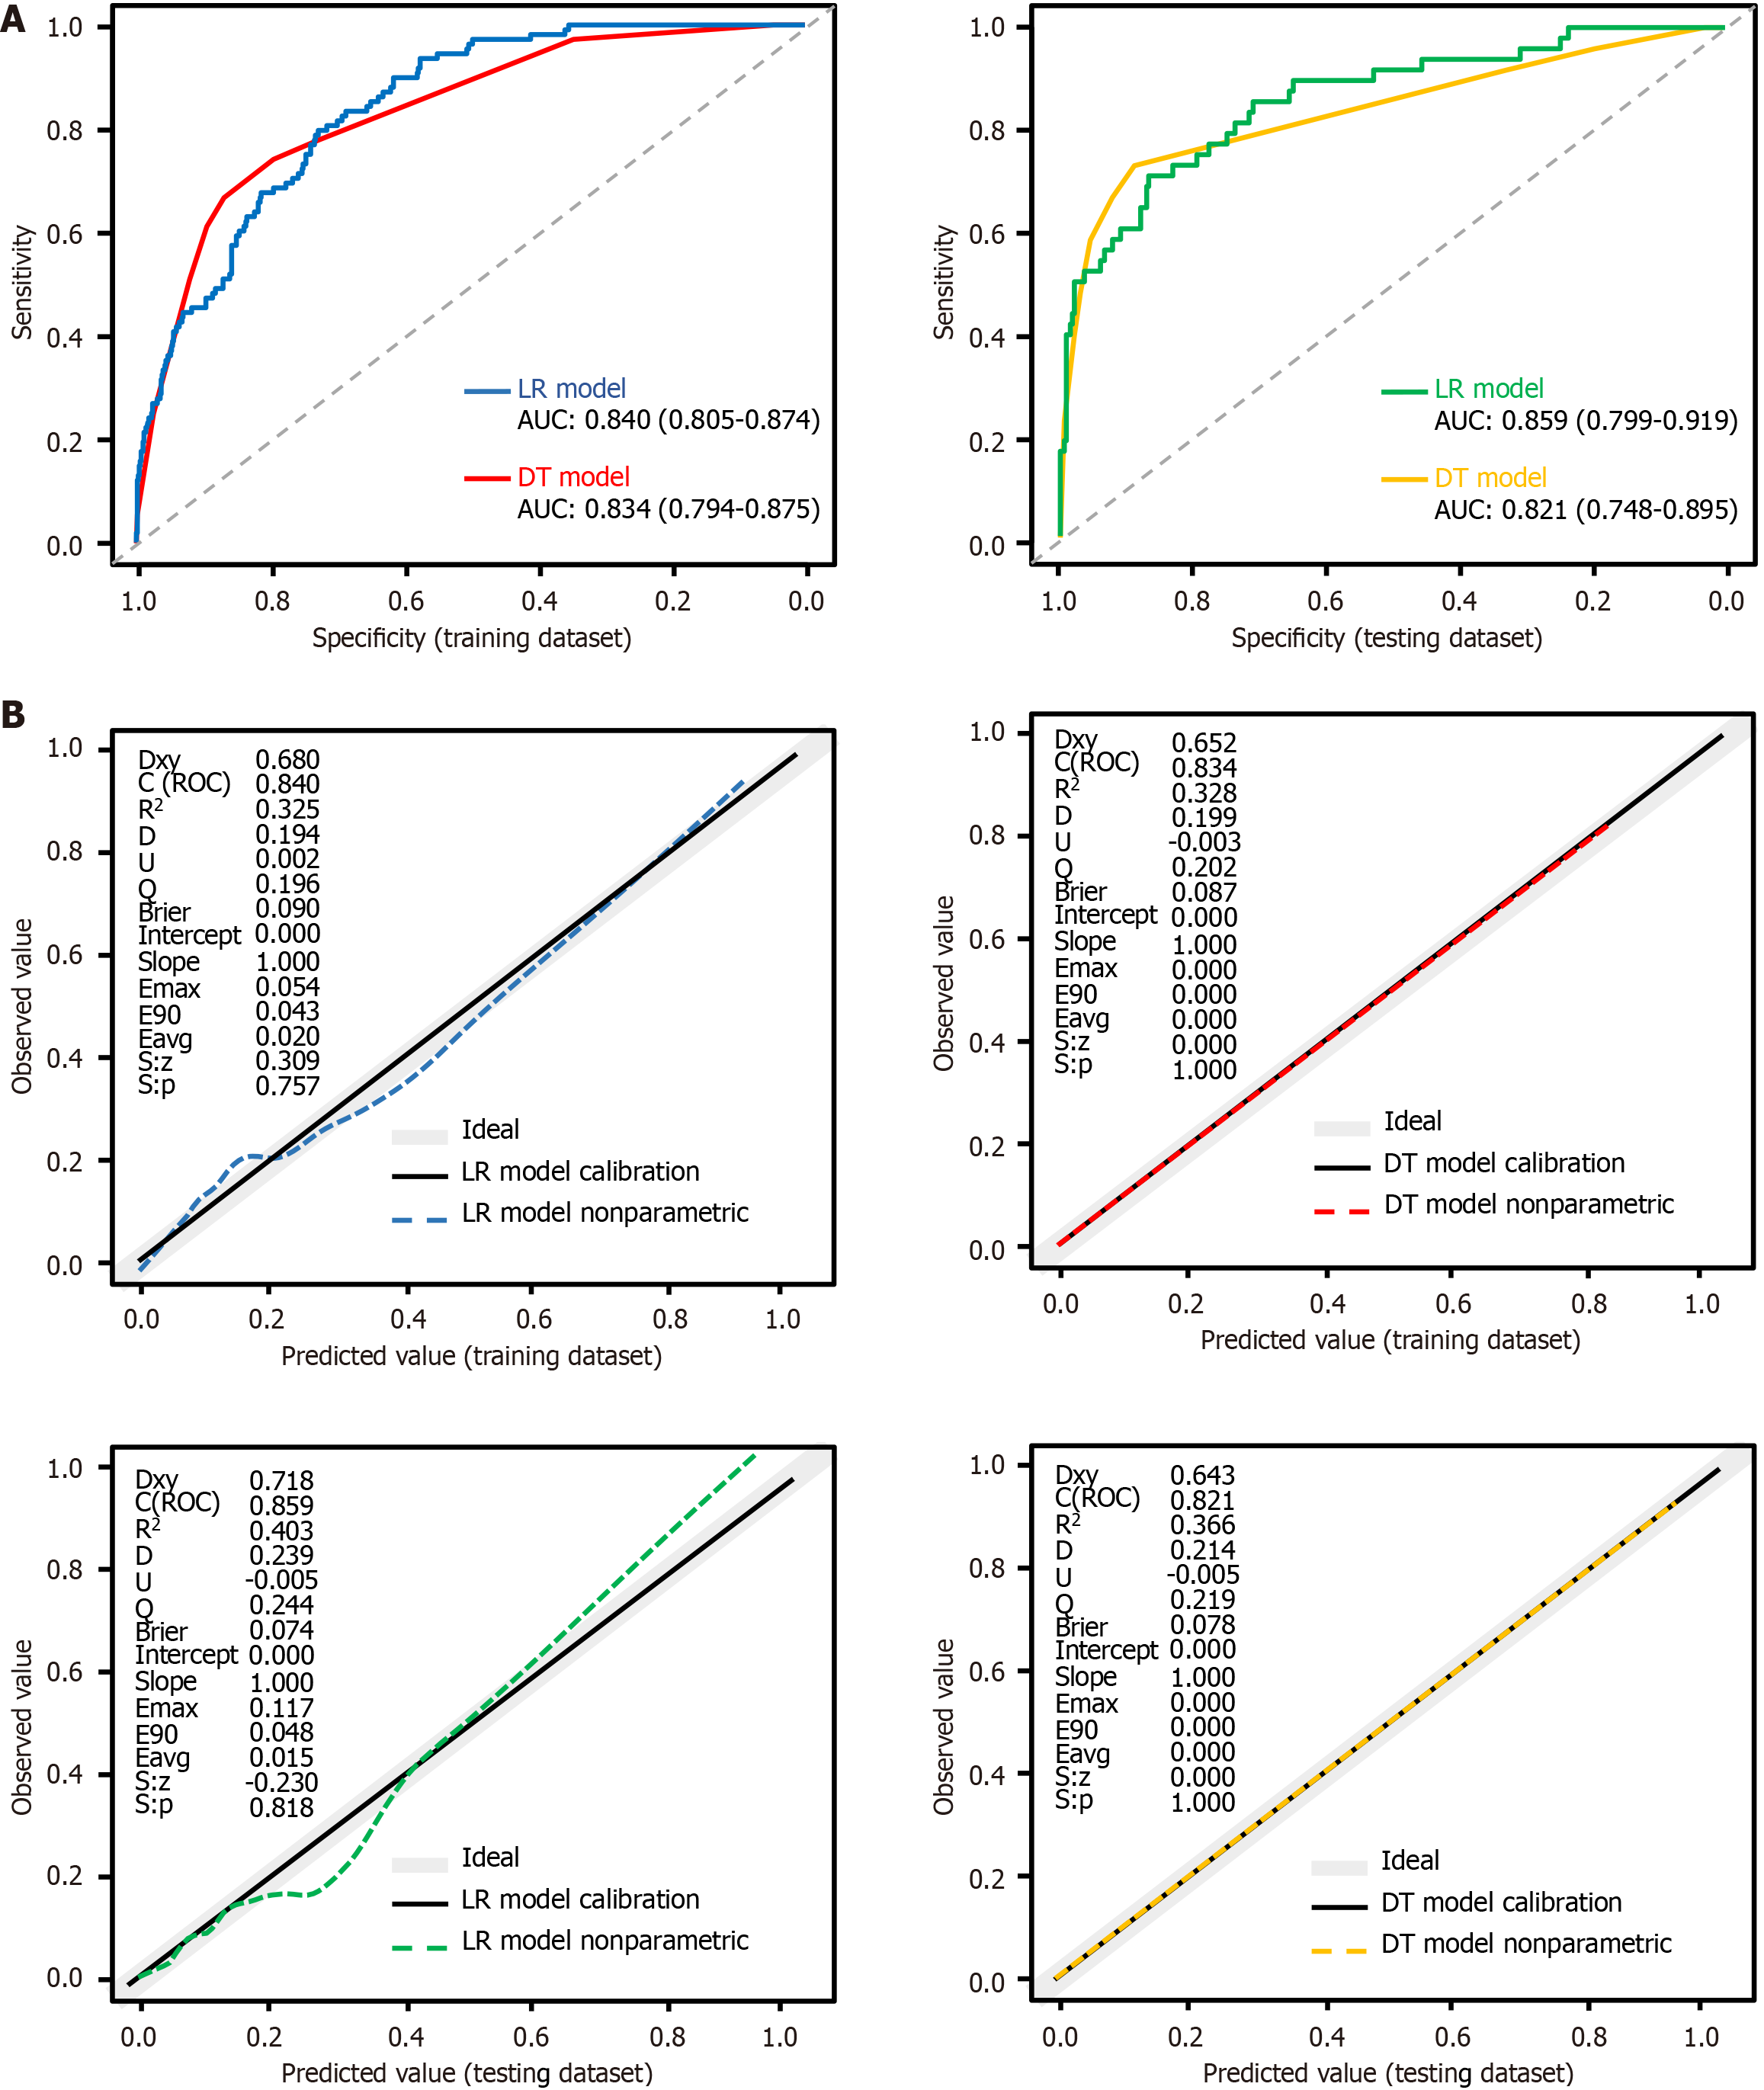
Figure 5 The receiver operating characteristic curves and calibration plots for both models on training dataset and testing dataset.
A: Receiver operating characteristic and area under the curve for both models in training dataset and testing dataset; B: Calibration plots for both models in both datasets. The dashed line represents the predicted value curve; the black solid line represents the actual value curve and the gray line represents the ideal reference curve at 45°. P values > 0.05 in all four graphs indicate no statistically significant difference between the predicted and actual incidence curves. LR: Logistic regression; DT: Decision tree; AUC: Area under the receiver operating characteristic curve; ROC: Receiver operating characteristic curve.
- Citation: Su LM, Wu B, Chen Z, Wang XY, Shen XH, Wei ZQ, Cheng H, Wang LN. Development and validation of screening tools for motoric cognitive risk syndrome in community settings. World J Psychiatry 2025; 15(8): 105433
- URL: https://www.wjgnet.com/2220-3206/full/v15/i8/105433.htm
- DOI: https://dx.doi.org/10.5498/wjp.v15.i8.105433


