Copyright
©The Author(s) 2025.
World J Psychiatry. Aug 19, 2025; 15(8): 105433
Published online Aug 19, 2025. doi: 10.5498/wjp.v15.i8.105433
Published online Aug 19, 2025. doi: 10.5498/wjp.v15.i8.105433
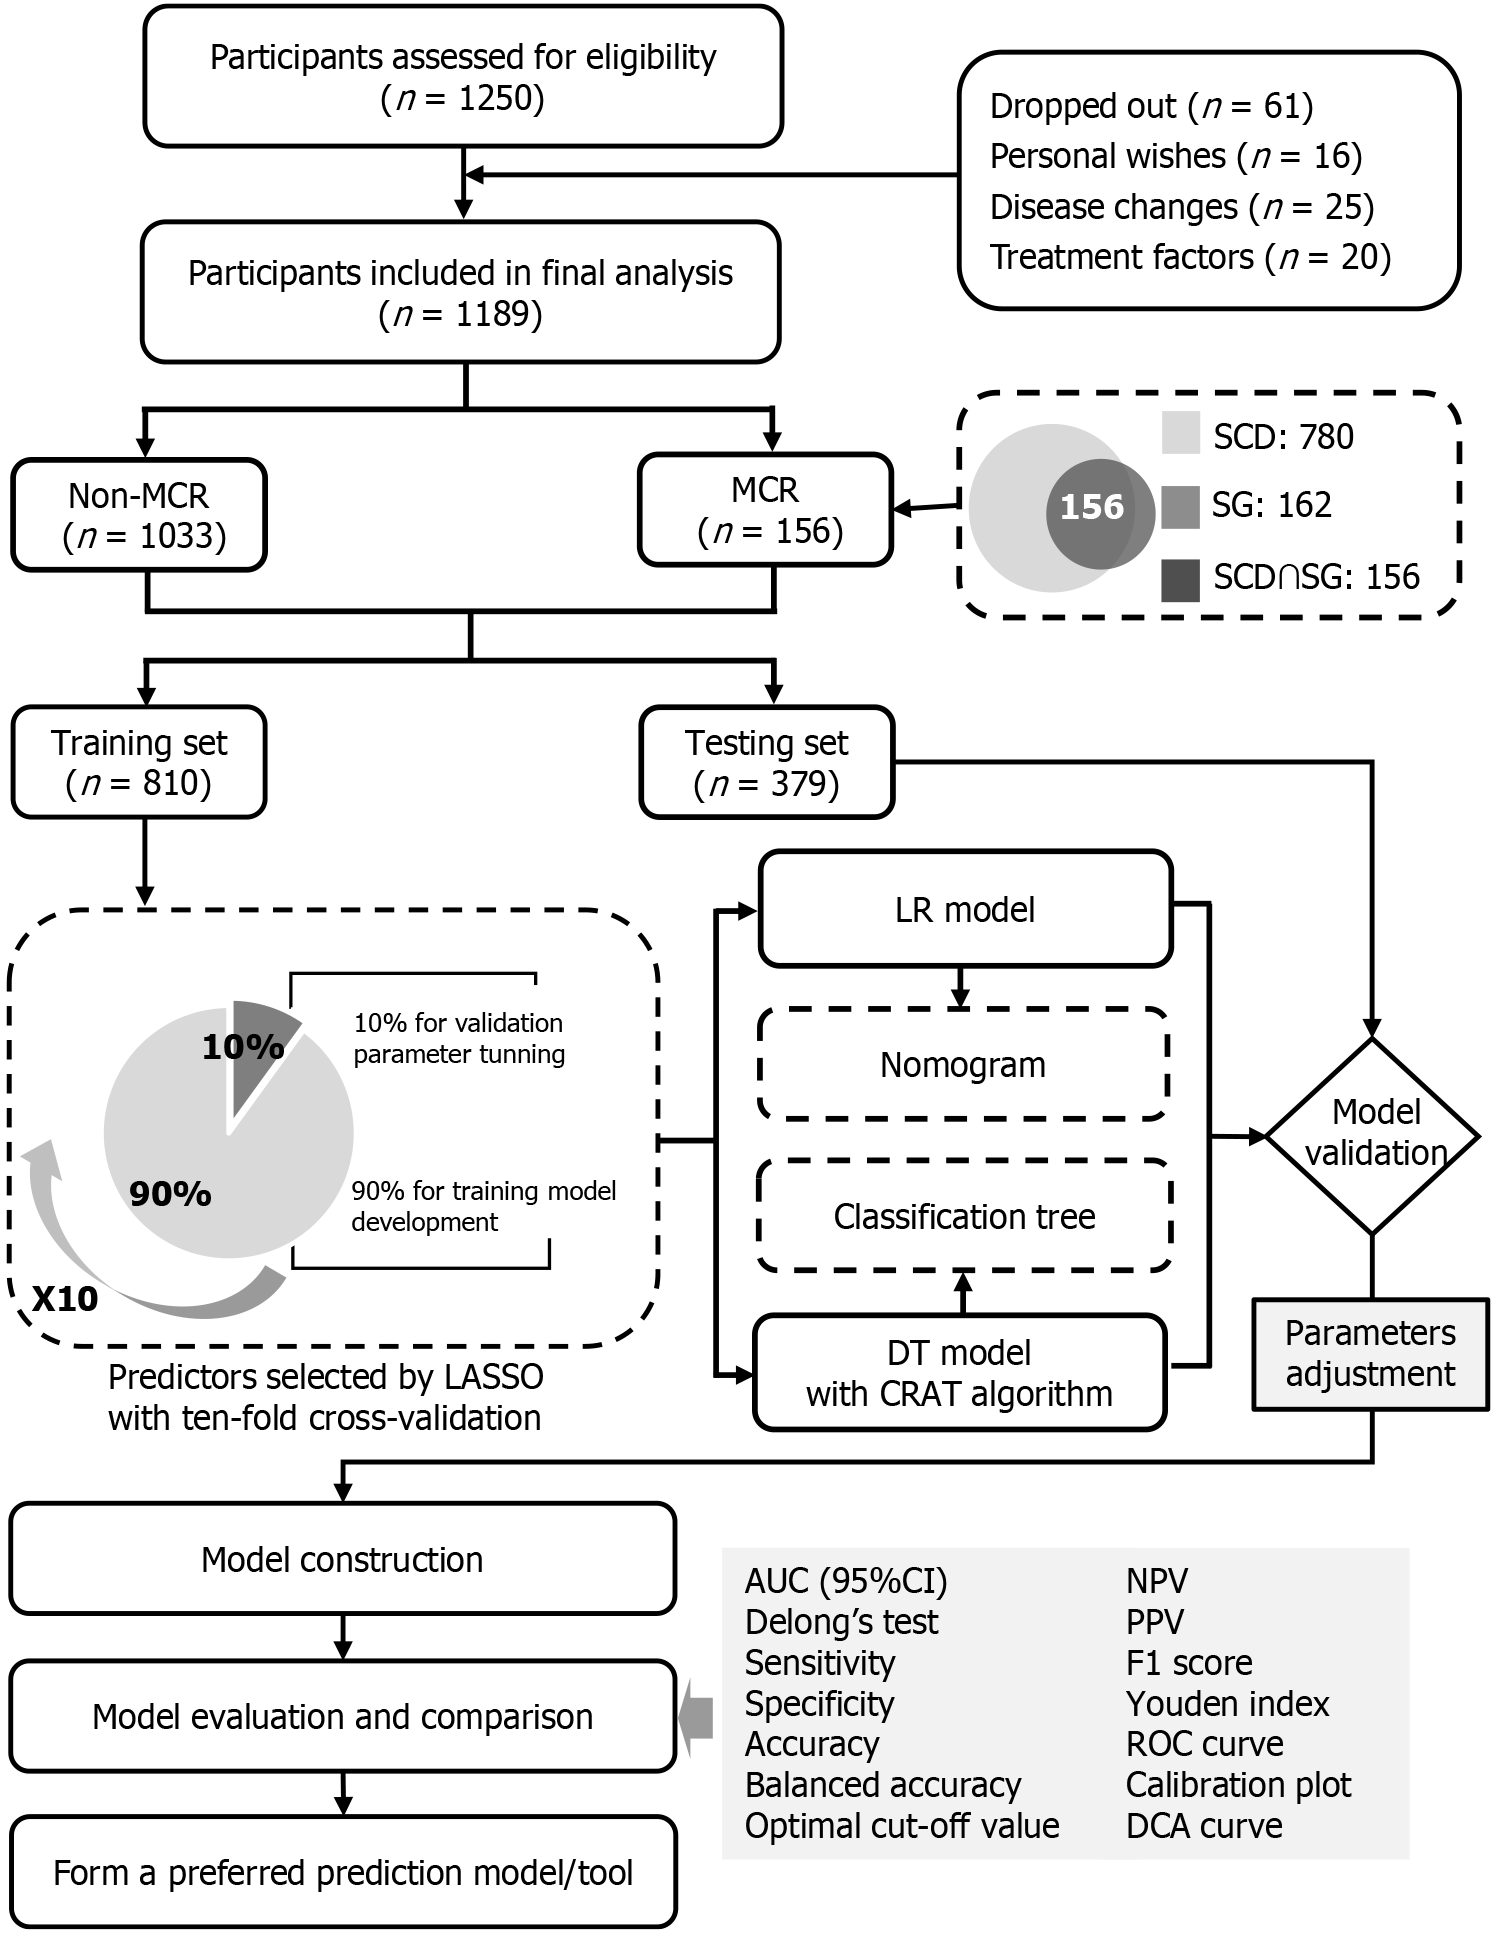
Figure 1 Research flowchart and framework of statistical analysis.
Non-MCR: Without motoric cognitive risk syndrome; MCR: Motoric cognitive risk; SCD: Subjective cognitive decline; SG: Slow gait speed; LASSO: Least absolute shrinkage and selection operator; LR: Logistic regression; DT: Decision tree; CRAT: Classification and the regression trees; AUC: Area under the receiver operating characteristic curve; 95%CI: 95% confidence interval; NPV: Negative predictive value; PPV: Positive predictive value; ROC: Receiver operating characteristic curve; DCA: Decision curve analysis.
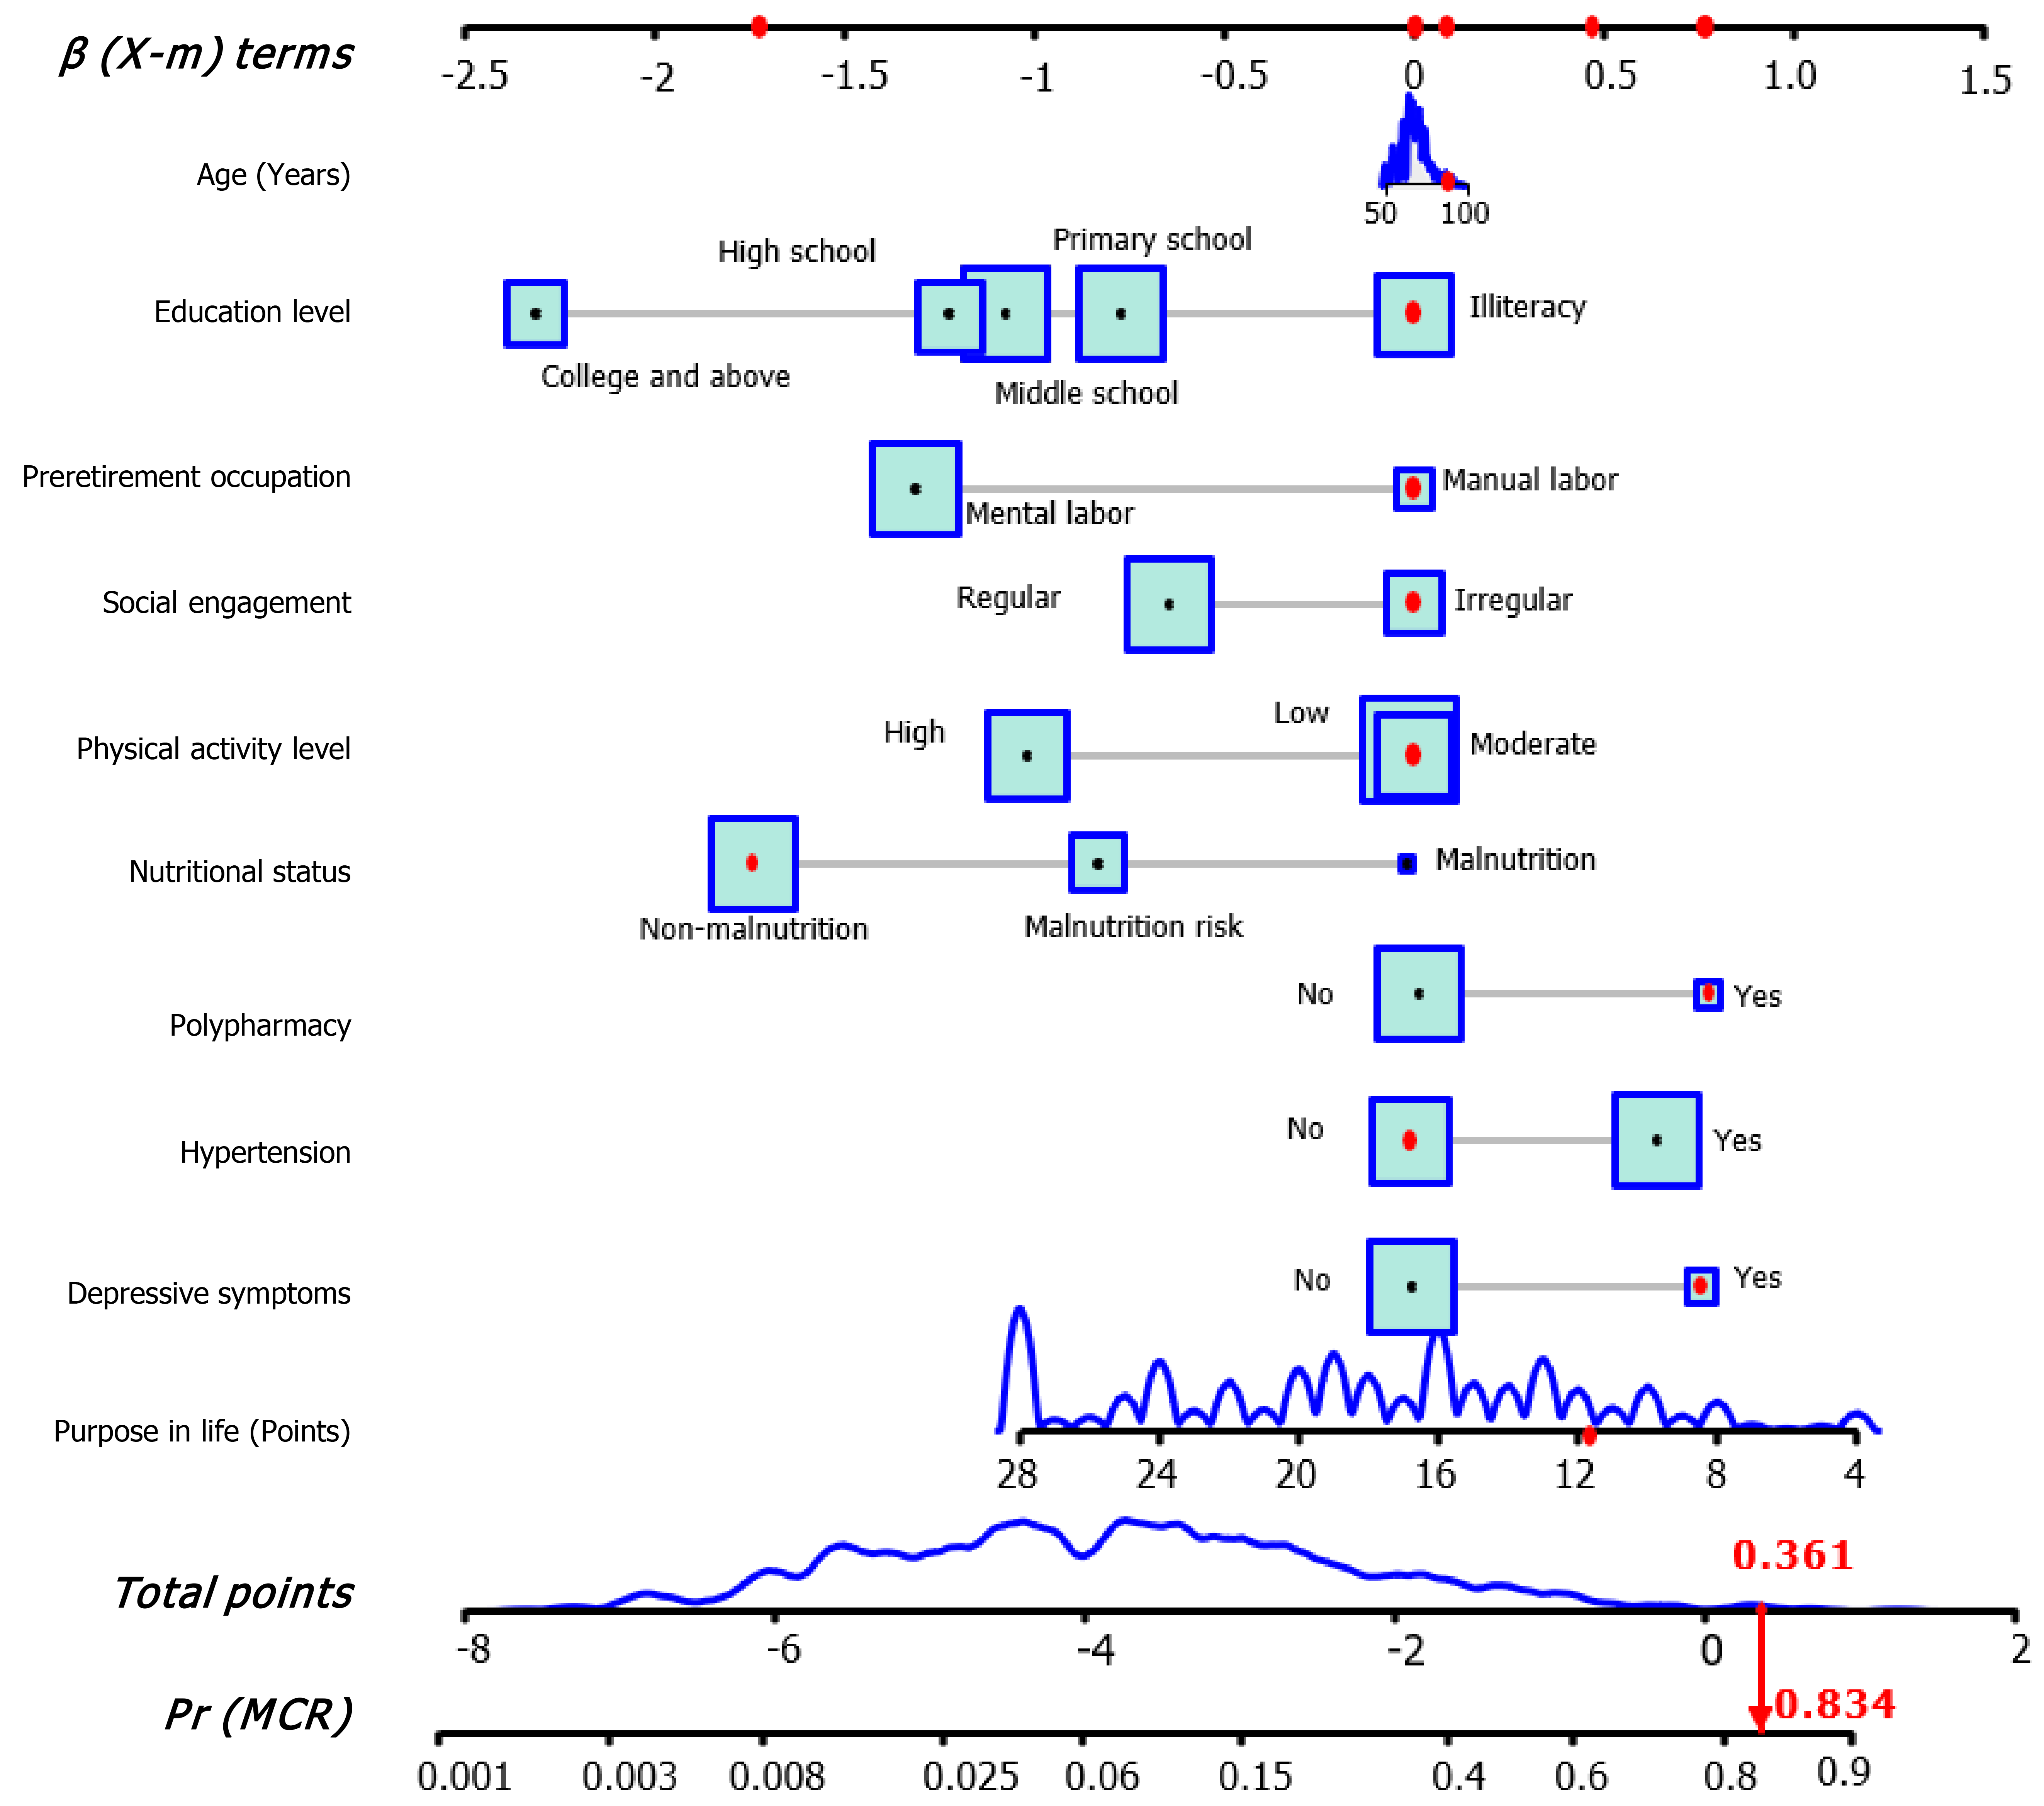
Figure 2 The interactive nomogram for motoric cognitive risk screening.
The nomogram estimates motoric cognitive risk (MCR) probability by summing variable points and locating the total on the scale. Higher points indicate higher risk. For example, an 89-year-old retired manual laborer with irregular social engagement, moderate physical activity, no malnutrition or hypertension, depressive symptoms, and a purpose in life score of 13, has a total point of 0.361, resulting in an estimated MCR probability of 83.4%. MCR: Motoric cognitive risk.
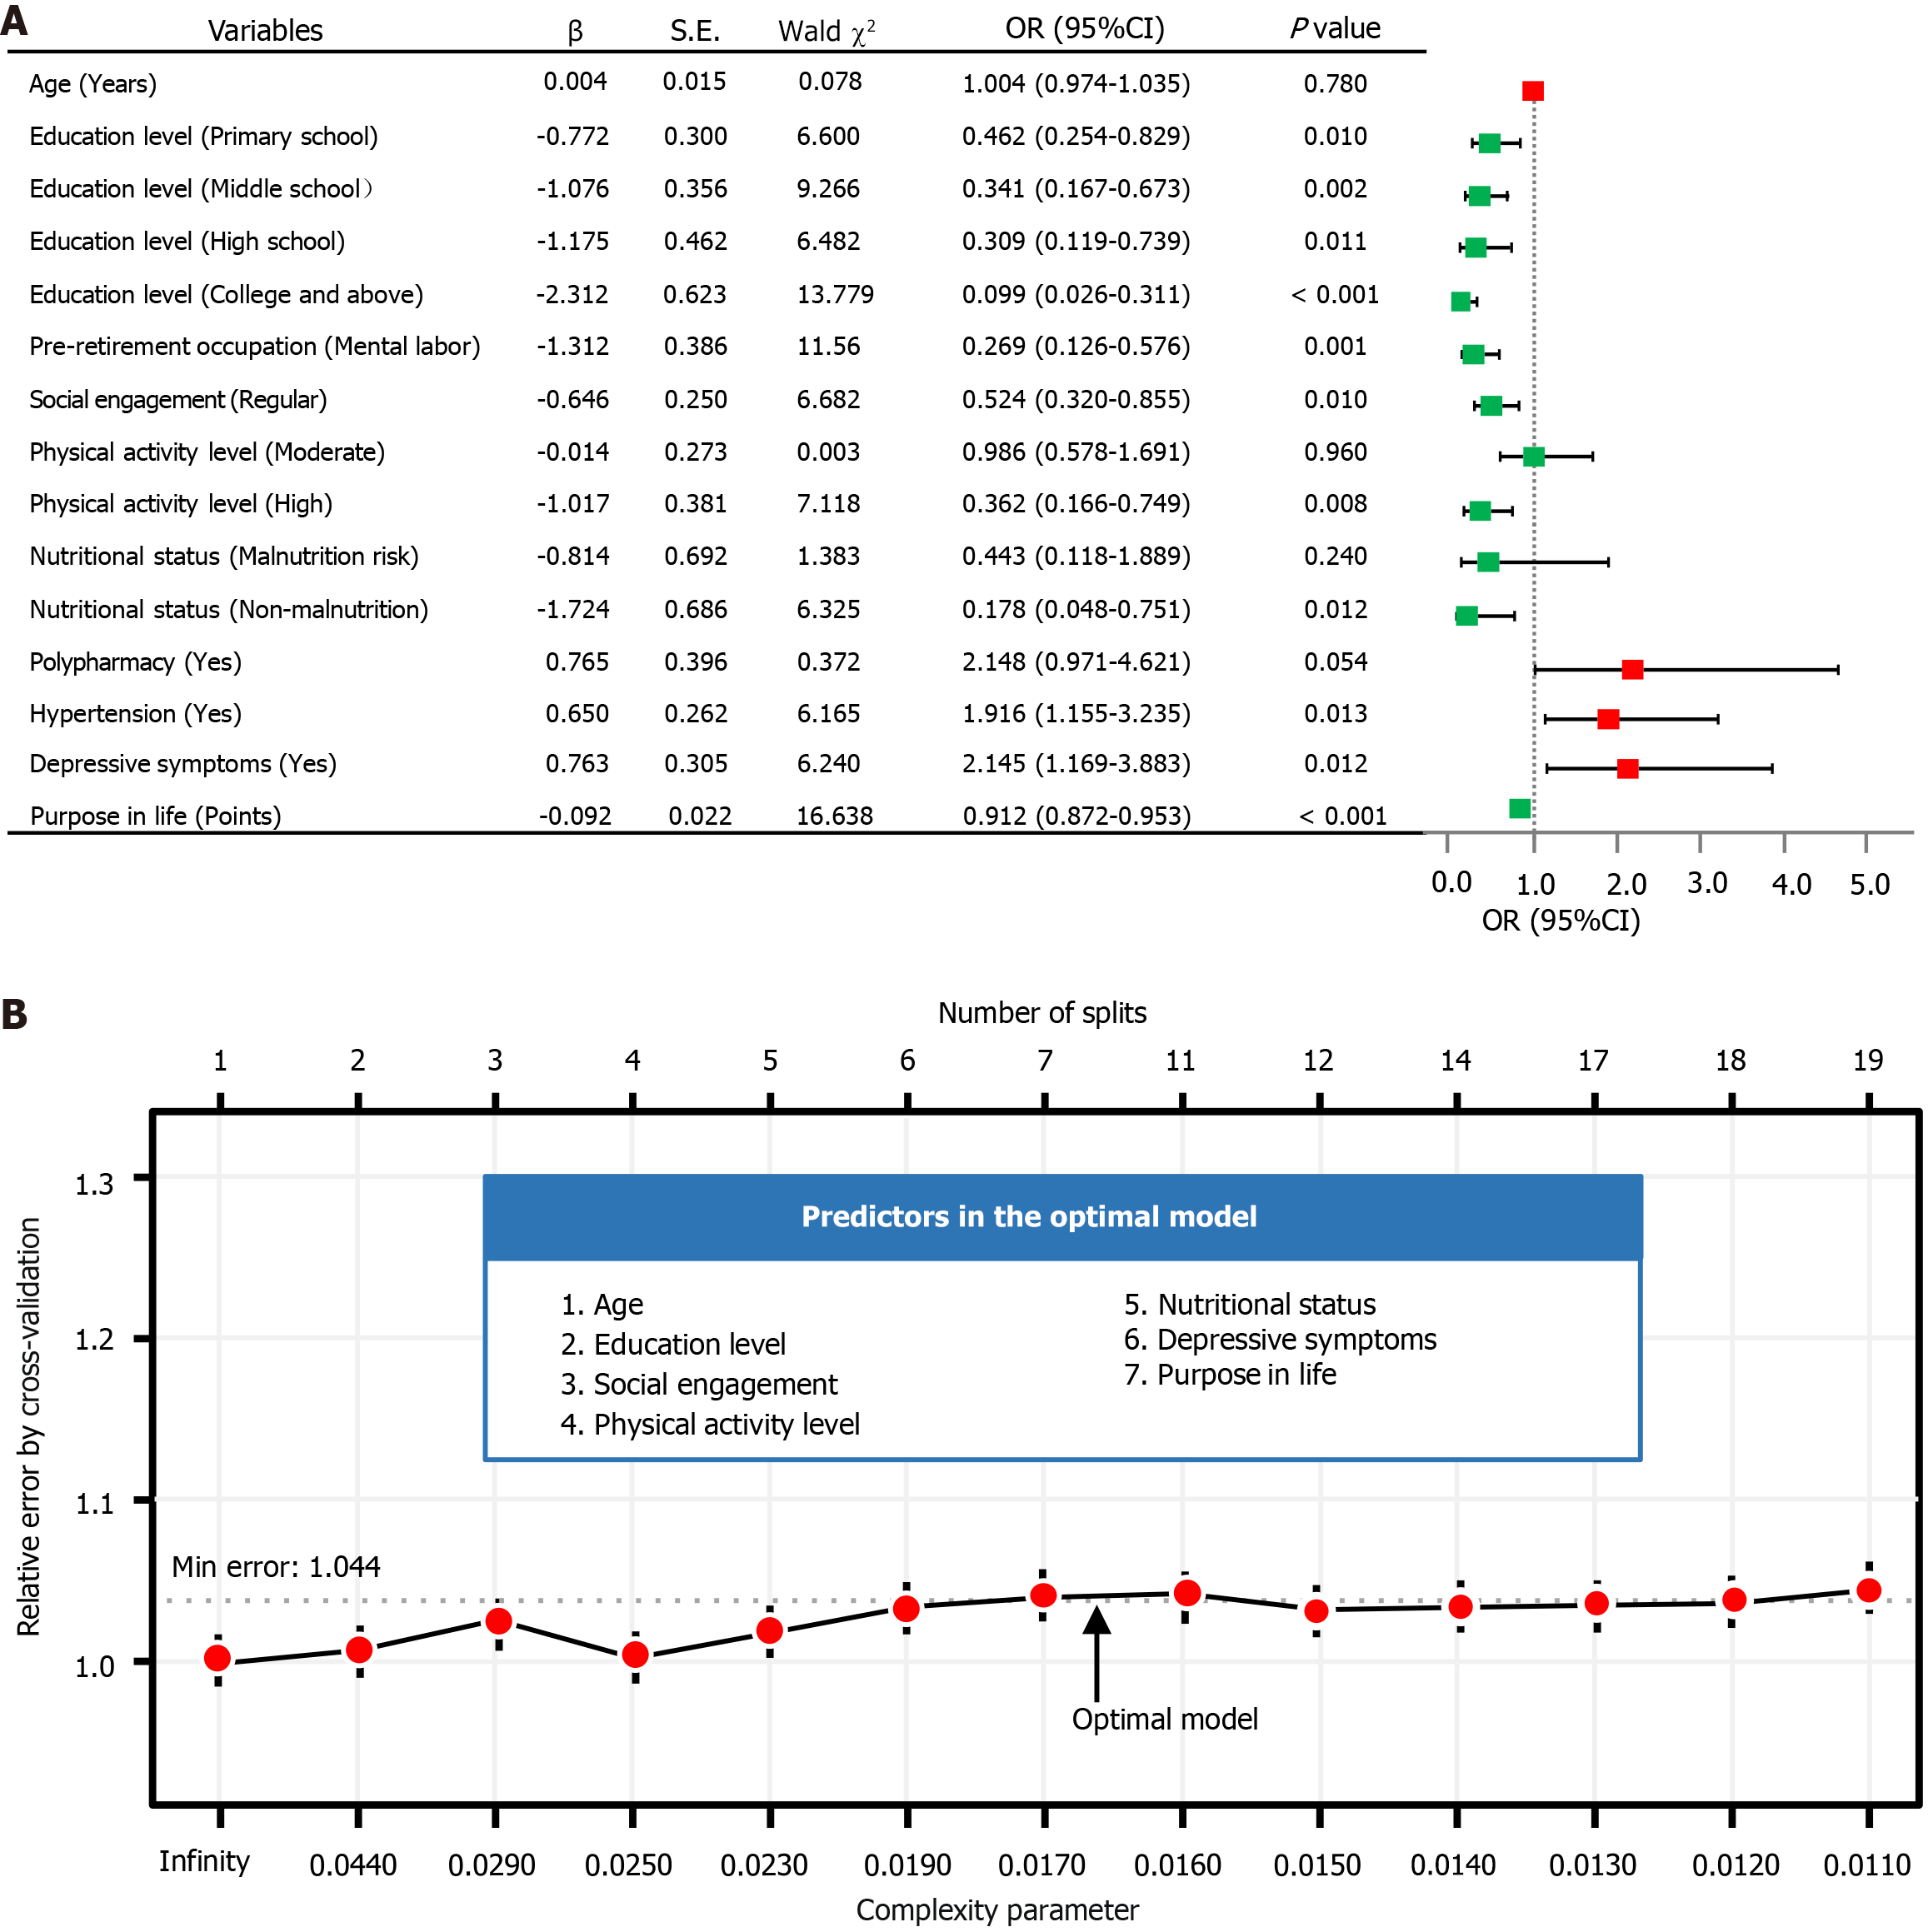
Figure 3 Inference of predictors by two models on training dataset.
A: Multivariable logistic regression (LR) forest plot of motoric cognitive risk; B: Optimization of the decision tree (DT) model using cross-validation. Through the forest plot of LR analysis to construction of the interactive nomogram (odds ratios are tested with Wald χ2 tests with 1 degree of freedom). The figure of DT model displays the dynamic relationship between the relative error (Y-axis), splits number (upper X-axis), and complexity parameter (lower X-axis). OR: Odds ratio; CI: Confidence interval; Min: Minimum.
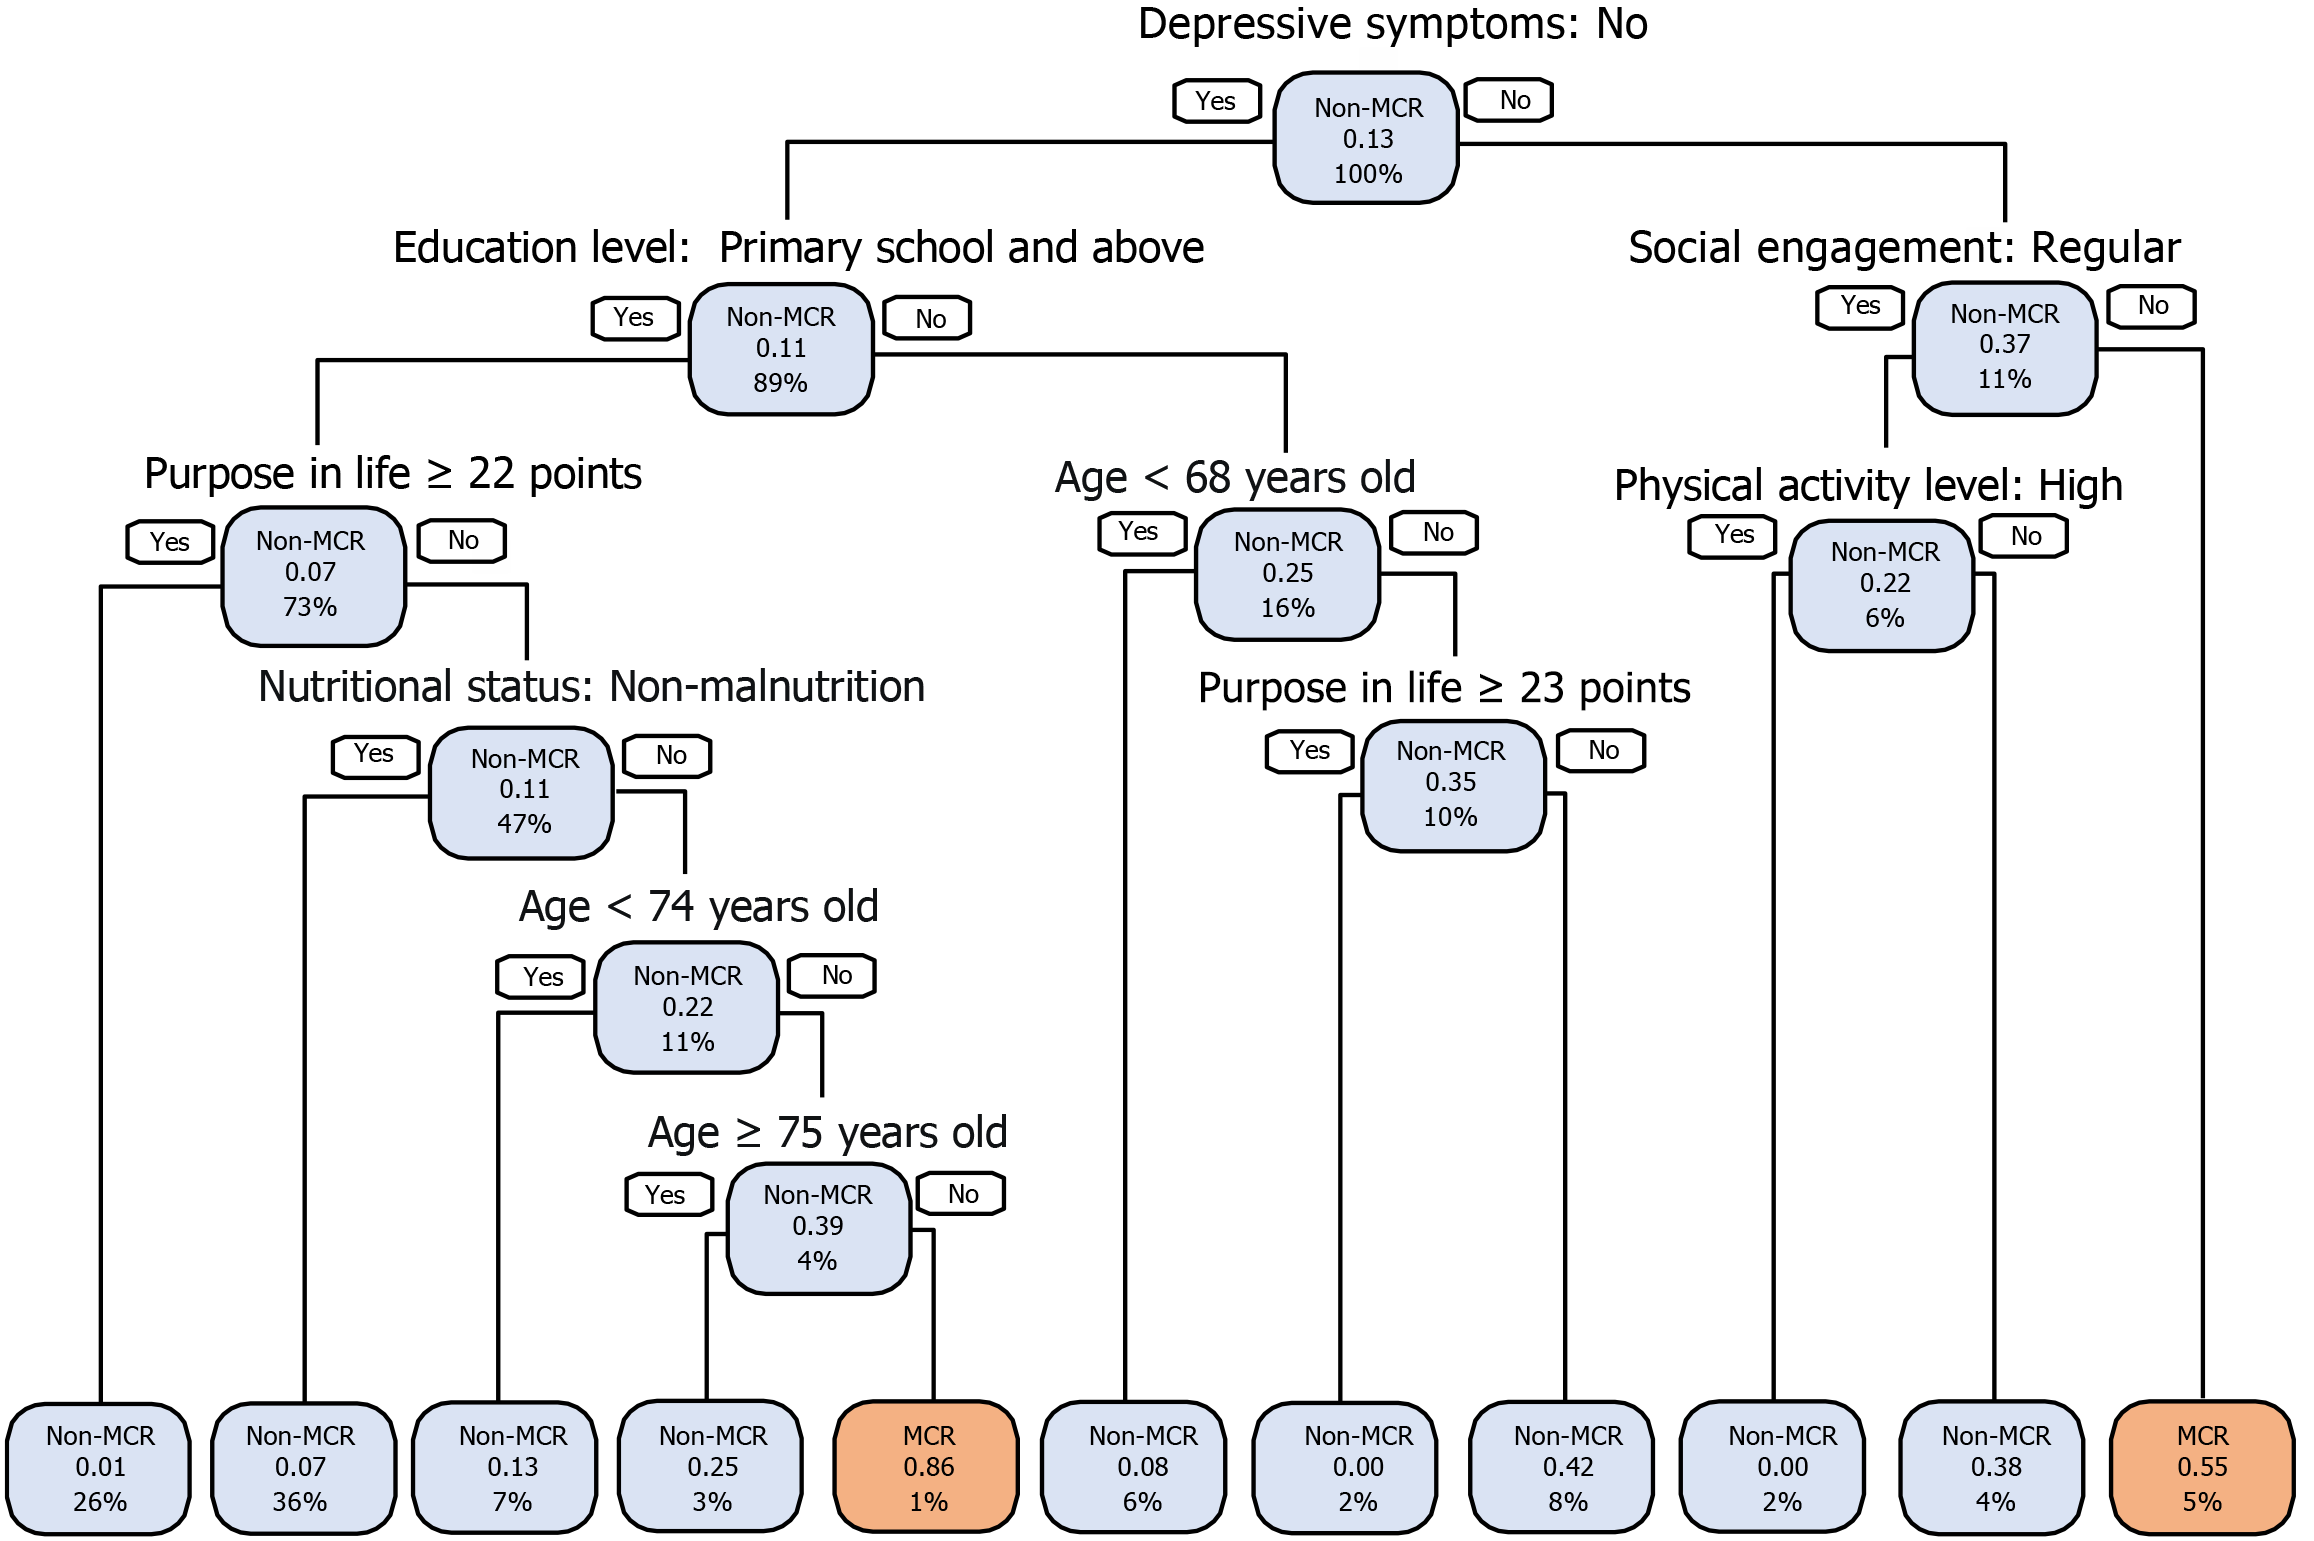
Figure 4 Visualization of the classification tree of decision tree model for identifying motoric cognitive risk.
Each node’s text shows the predicted event [non-motoric cognitive risk (MCR)/MCR], the estimated event probability, and the percentage of participants in the training dataset. Blue nodes indicate higher non-MCR prevalence, while pink nodes indicate higher MCR prevalence. The classification tree, constructed using the training dataset, incorporating age, purpose in life, nutritional status, education level, social engagement, depressive symptoms, and physical activity level. MCR: Motoric cognitive risk.
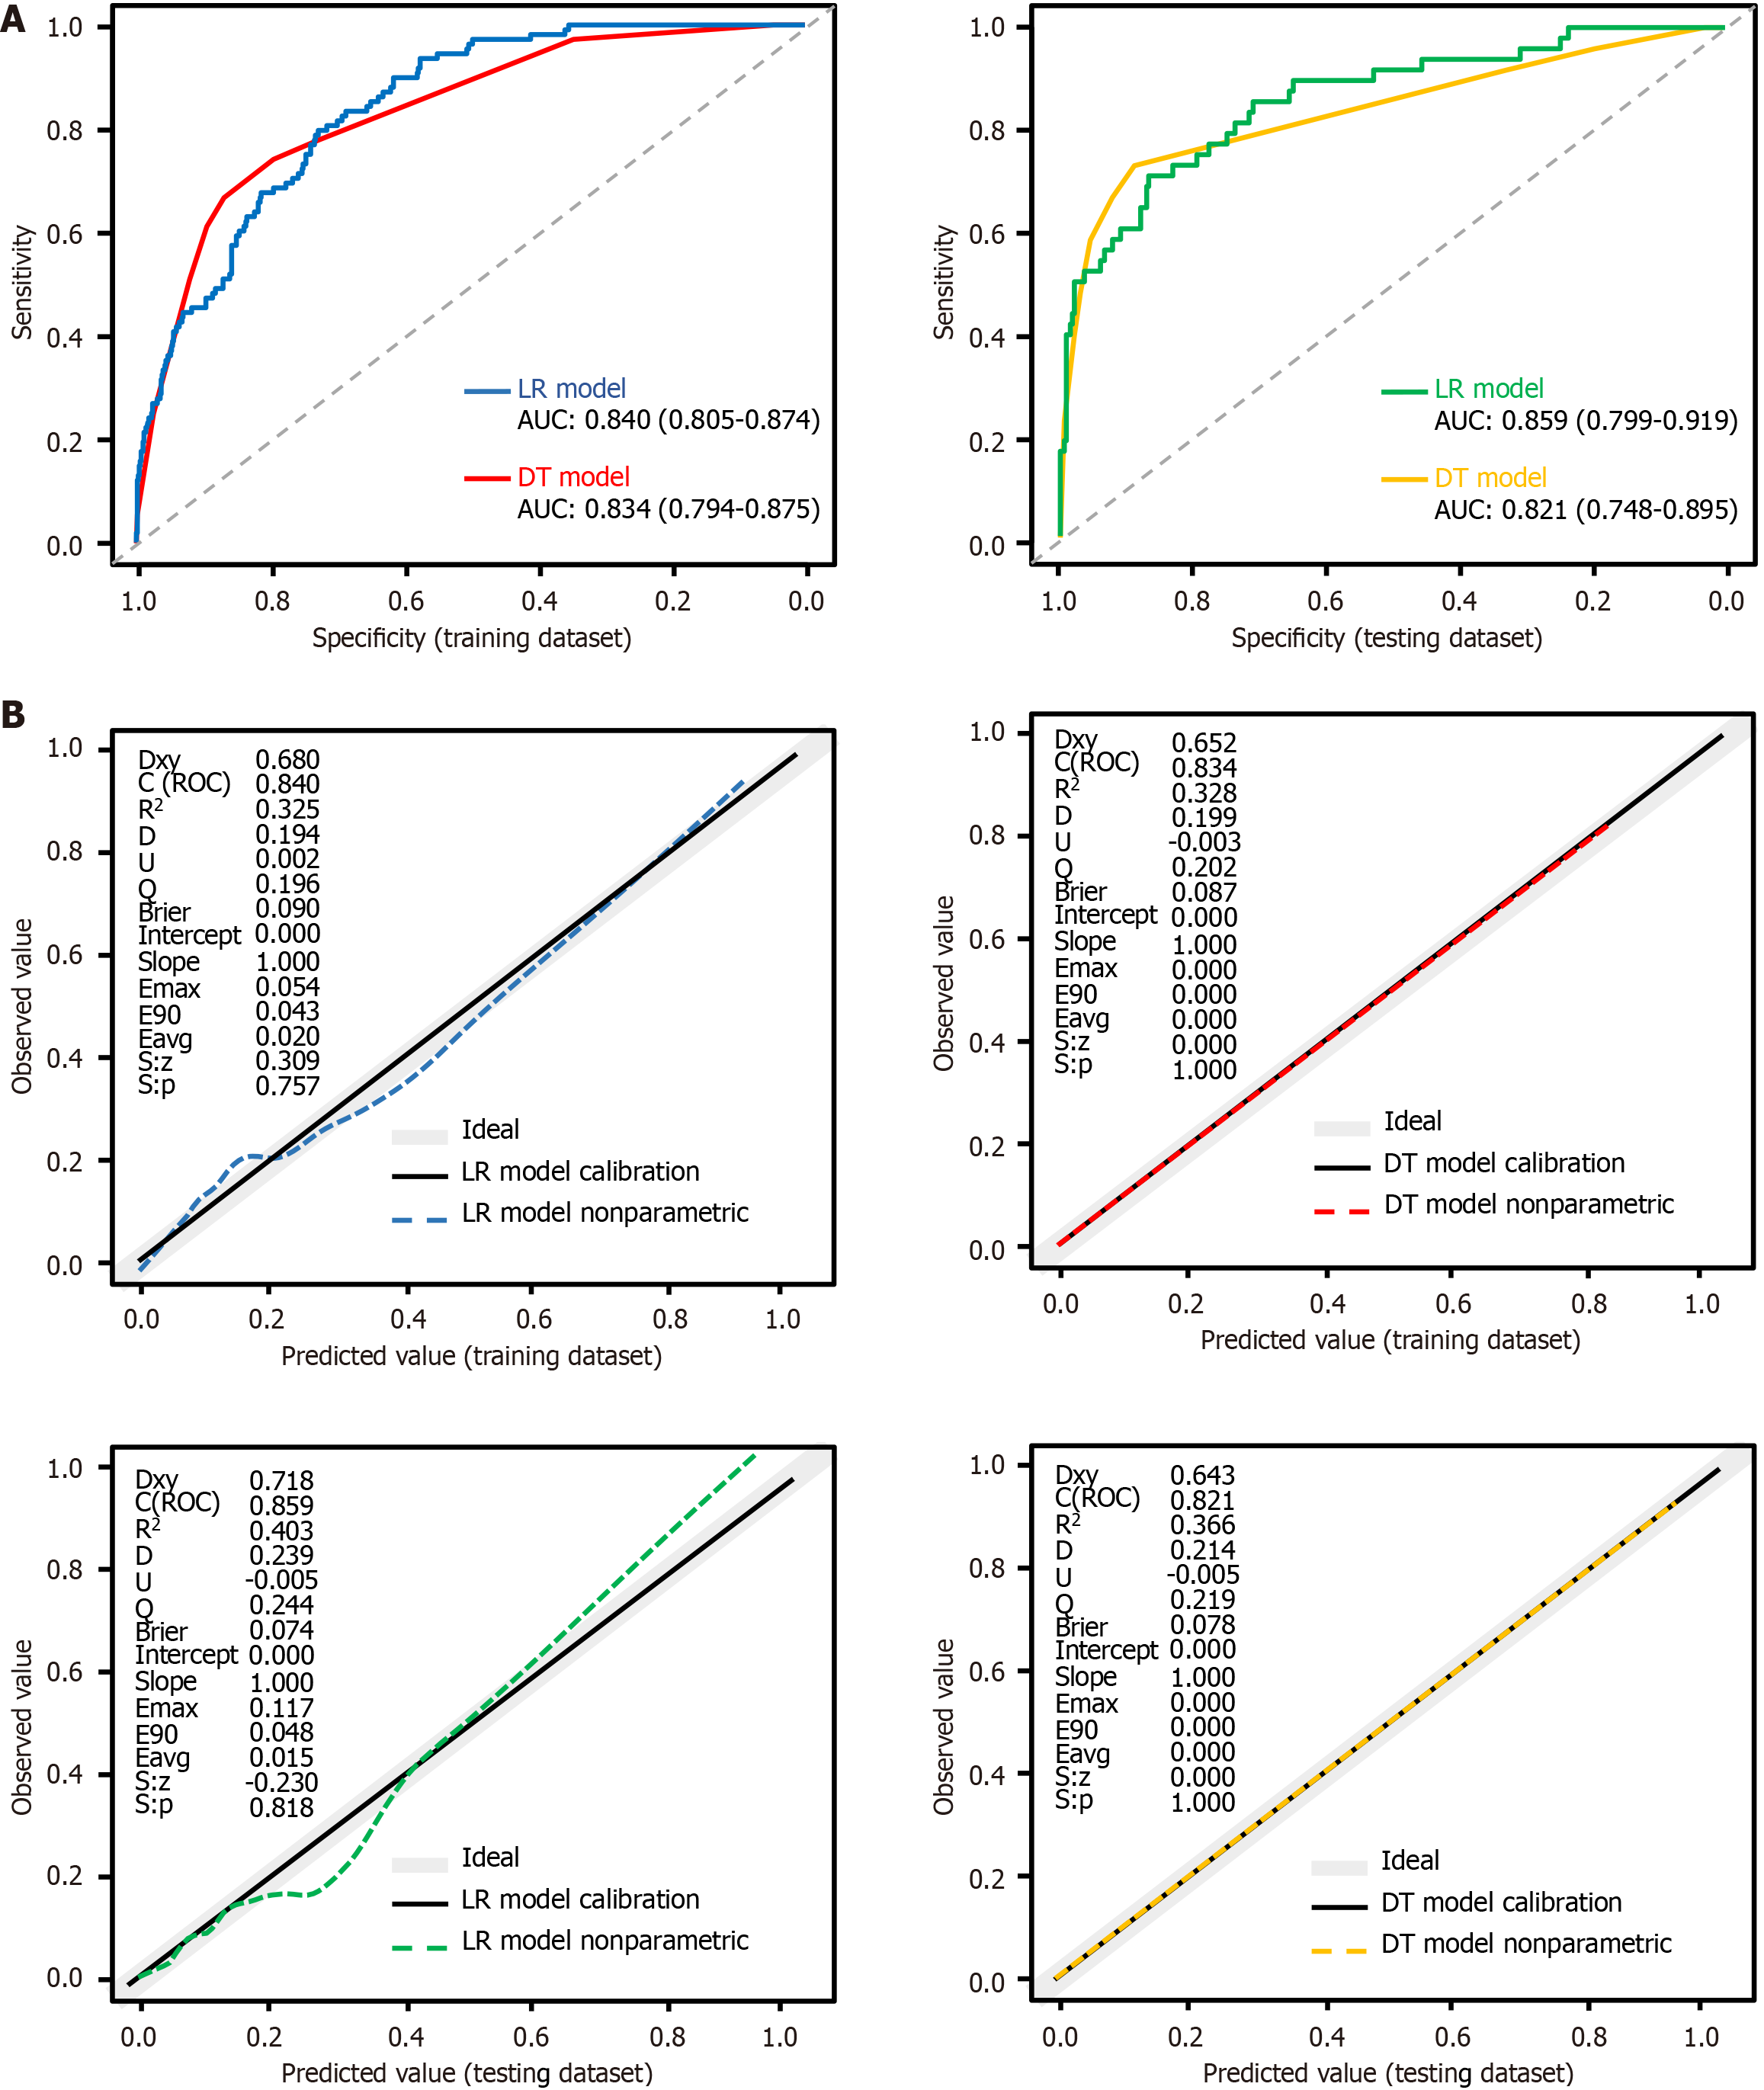
Figure 5 The receiver operating characteristic curves and calibration plots for both models on training dataset and testing dataset.
A: Receiver operating characteristic and area under the curve for both models in training dataset and testing dataset; B: Calibration plots for both models in both datasets. The dashed line represents the predicted value curve; the black solid line represents the actual value curve and the gray line represents the ideal reference curve at 45°. P values > 0.05 in all four graphs indicate no statistically significant difference between the predicted and actual incidence curves. LR: Logistic regression; DT: Decision tree; AUC: Area under the receiver operating characteristic curve; ROC: Receiver operating characteristic curve.
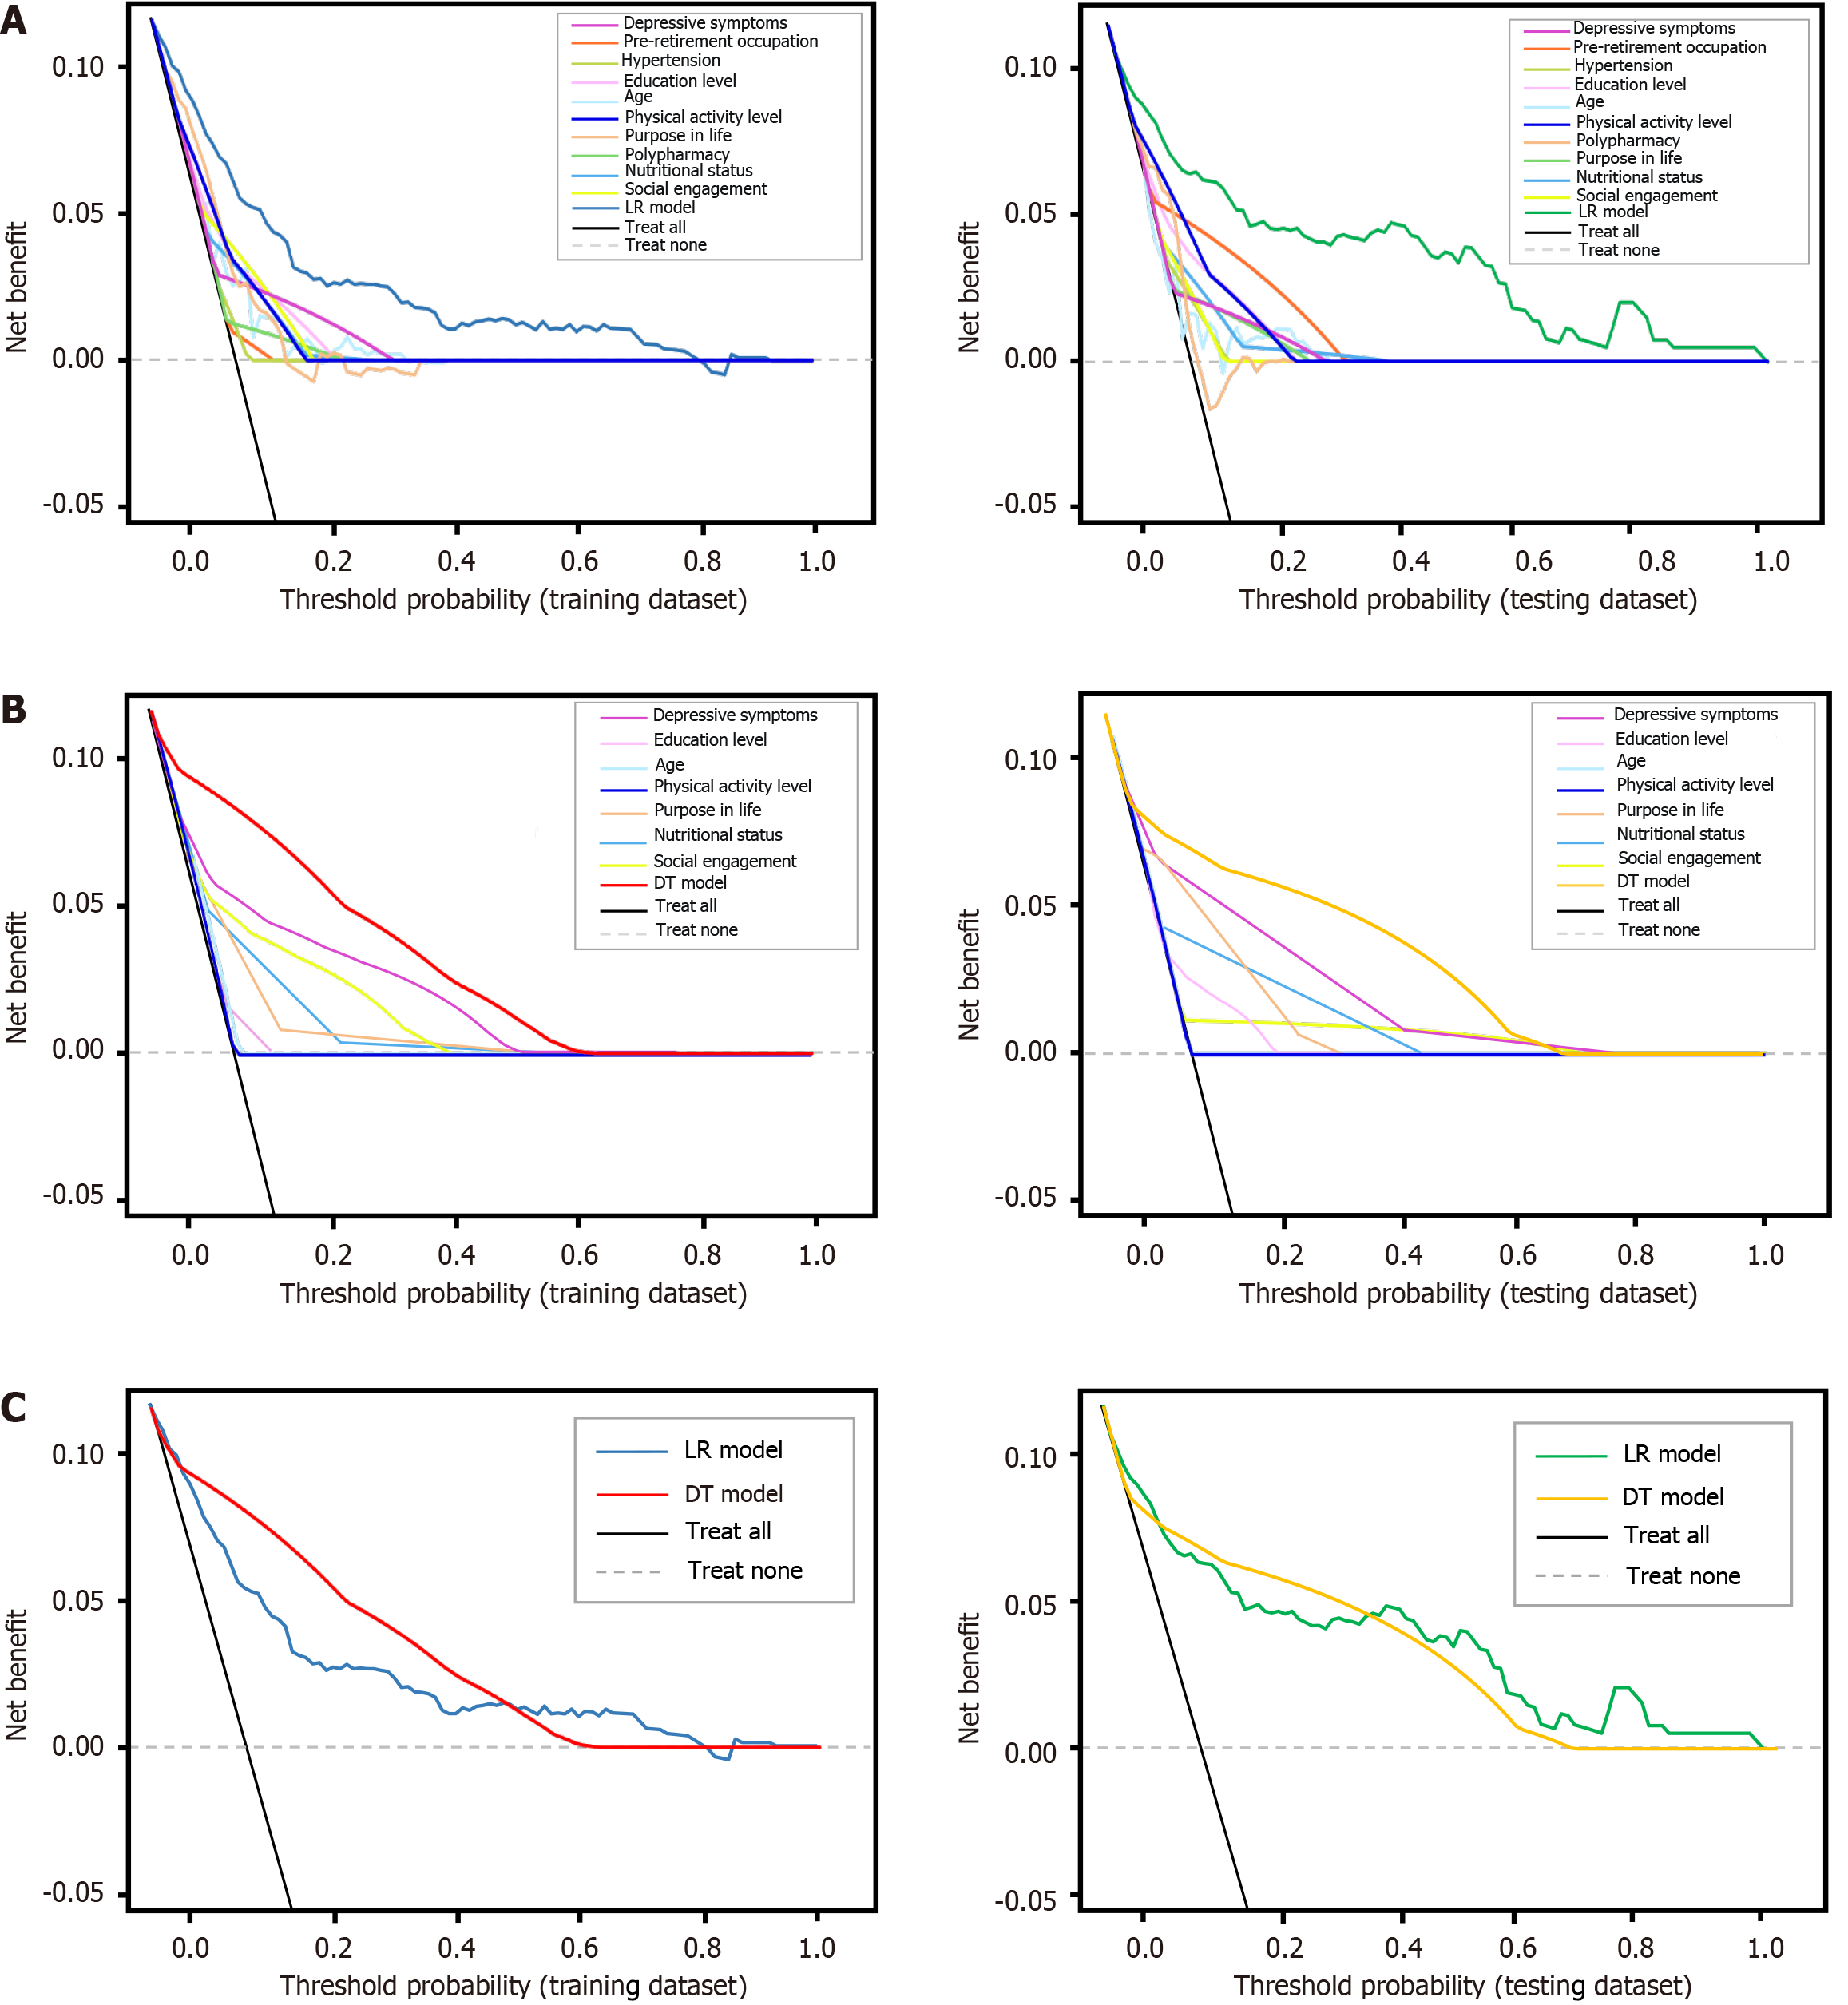
Figure 6 The decision curve analyses curves for both models on training dataset and testing dataset.
A: Decision curve analyses (DCA) curves for logistic regression (LR) models and its ten predictors in both datasets; B: DCA curves for decision tree (DT) models and its seven predictors in both datasets; C: DCA curves for both models in both datasets. The grey dashed line represents no motoric cognitive risk (MCR) in individuals, the black solid line represents MCR occurred in all individuals, and the lines between them indicates the net benefit of using the LR or DT models for MCR prediction. The X-axis represents threshold probabilities, and the Y-axis represents net benefit. LR: Logistic regression; DT: Decision tree.
- Citation: Su LM, Wu B, Chen Z, Wang XY, Shen XH, Wei ZQ, Cheng H, Wang LN. Development and validation of screening tools for motoric cognitive risk syndrome in community settings. World J Psychiatry 2025; 15(8): 105433
- URL: https://www.wjgnet.com/2220-3206/full/v15/i8/105433.htm
- DOI: https://dx.doi.org/10.5498/wjp.v15.i8.105433


