Copyright
©The Author(s) 2016.
World J Orthop. Oct 18, 2016; 7(10): 638-649
Published online Oct 18, 2016. doi: 10.5312/wjo.v7.i10.638
Published online Oct 18, 2016. doi: 10.5312/wjo.v7.i10.638
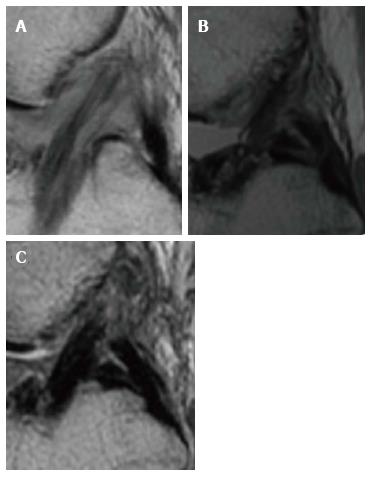
Figure 1 Various graft signal intensity.
The signal intensity is usually calculated through the SNQ (signal-digital noise ratio), which is obtained through the following formula: SNQ = (ACL graft signal - PCL graft signal)/background signal. According to these measurements, we could have a hyperintense graft (A), a graft with reduced intensity signal but not yet analogous to native ACL (B) and a graft iso-intense to PCL (C). PCL: Posterior cruciate ligament; SNQ: Symbol of national quality; ACL: Anterior cruciate ligament.
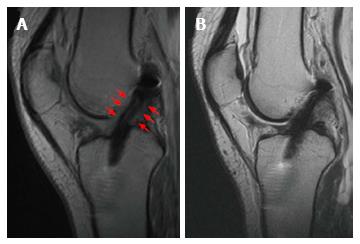
Figure 2 Successful anterior cruciate ligament reconstruction with Gracilis and Semitendinosus autograft with a normal healing process.
At the 6th month, it is possible to appreciate in the T2-Fast recovery sat-spin echo (FRFSE) MRI a hyperintense line within the graft body. The graft is surrounded by an intermediate signal intensity tissue (red arrows), representing vascularization and synovialization (A). At the 12th month, the periligamentous signal has disappeared and the graft signal decreased resembling that of PCL (B). PCL: Posterior cruciate ligament; ACL: Anterior cruciate ligament; MRI: Magnetic resonance imaging.
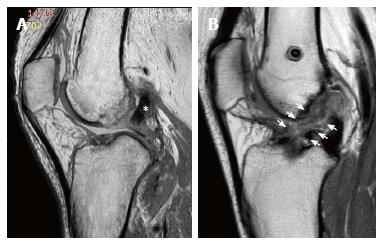
Figure 3 Three years after an anterior cruciate ligament reconstruction with Gracilis and Semitendinosus autograft in a 26-year-old-male.
The intercondylar space is occupied by mixoid tissue with slightly hyperintense signal in proton density turbo-shin echo weighted images (white arrows). It is not possible to distinguish the regular course of the graft.
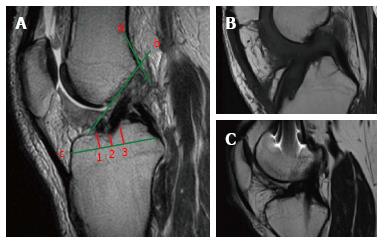
Figure 4 On the sagittal plane, the front border of the tibial tunnel.
It should be localized behind a line that is tangential to the Blumensaat line (line b); however, without going beyond the midpoint of the proximal tibia with the knee in full extension. The femoral tunnel should be located at the intersection of the posterior femoral cortex (line a) and the lateral wall of the intercondylar notch (line b). The position of the tibial tunnel entrance is measured as following: the total antero-posterior diameter of the tibial plateau (line c) is measured in the sagittal slice where the tibial entrance is better visualized. The location of the anterior margin of the tunnel is obtained dividing the distance from the anterior tibial plateau margin and the most anterior part of the tunnel entrance (point 1) for the total AP diameter (line c) and multiplying for 100. The location of the posterior margin (point 3) and the center of the tunnel (point 2) are obtained similarly (A). Sagittal view with a tibial tunnel positioned anterior to the midpoint of the tibial plateau diameter, resulting in an increased risk of impingement (B). Sagittal view with a tibial tunnel positioned too posterior, resulting in a vertical graft (C). The native ACL is located between the 31% and 63% of the tibial plateau diameter, with its center at 48%. ACL: Anterior cruciate ligament.
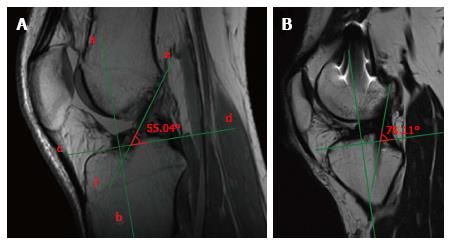
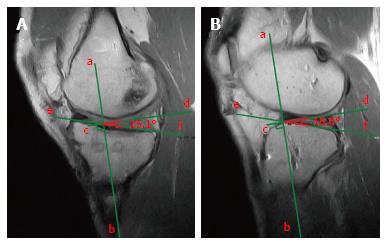
Figure 5 Measurement of the sagittal obliquity of the graft.
The inclination is calculated measuring the angle between the perpendicular line (line c and d) to the proximal tibial axis (line a and b), and the line which best defines the course of intra-articular part of the graft (line e and f). A high angle represents a vertical graft in the sagittal plane (A). Vertically positioned graft, with an angle of 78°, far higher than the normal range 50°-60° (B).
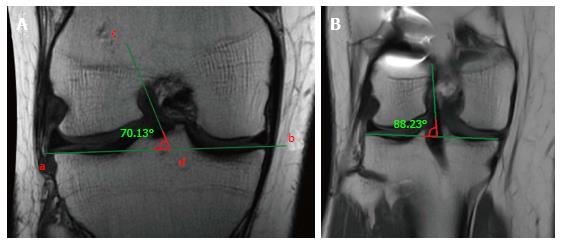
Figure 6 Measurement of the coronal obliquity of the graft.
The inclination is calculated measuring the angle between the tangent line to the tibial plateau (a and b) and the line which best defines the course of the intra-articular part of the graft (c and d). A high angle represents a vertical graft in the coronal plane (A). Vertically positioned graft, with an angle of 88°, far higher than the normal value < 75° (B).
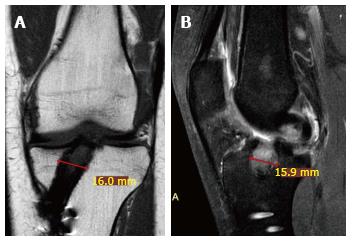
Figure 7 Coronal slice of a proton density spectral attenuated inversion recovery weighted mri 3.
5 years after anterior cruciate ligament reconstruction with gracilis and semitendinosus autograft in a 29-year-old female. It shows tibial tunnel macroscopic enlargement (A). In the sagittal T1 Turbo-Spin Echo weighted image, it is possible to note a cyst with hyperintense signal (B).
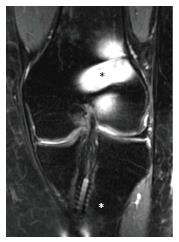
Figure 8 Proton density fat saturation coronal magnetic resonance imaging.
The metal interference screw on the femoral side (black asterisk) is responsible of marked artifact that could hinder the evaluation of tunnel placement, differently from the bioabsorbable interference screw on the tibial side (white asterisk).
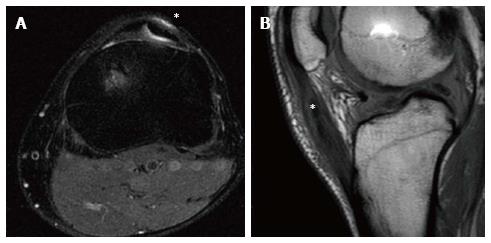
Figure 9 Anterior cruciate ligament reconstruction with bone-patellar tendon bone autograft in a 30-year-old male at 2 years of follow-up.
Donor site pathology is displayed as a hyperintense signal (asterisk) in the proton-density fat saturation axial images surrounding the split patellar tendon (A). In the sagittal proton density weighted slice, the post-operative patellar tendinopathy is displayed as an increase of signal intensity within the tendon itself (asterisk), that resulted in an enlarged and swollen tendon (B).
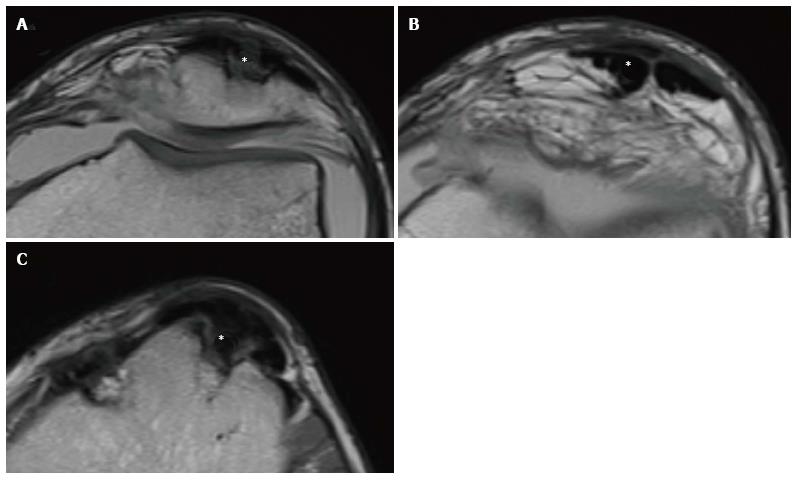
Figure 10 Natural history of bone-patellar tendon bone harvesting in a 21-year-old male.
It is possible to appreciate a bone defect (asterisk) on the anterior surface of the patella (A), the split hypointense patellar tendon (asterisk) (B), and another squared bone defect (asterisk) at the level of the central part of the anterior tibial tubercle (C).
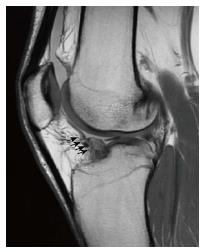
Figure 11 Sagittal proton density weighted images of anterior cruciate ligament reconstruction with Gracilis and Semitendinosus Autograft in a 26-year-old male at 1.
5 years follow-up. It is possible to appreciate a localized area of low to intermediate signal intensity extending anterior to the distal anterior cruciate ligament graft (black arrows) consistent with local arthrofibrosis.
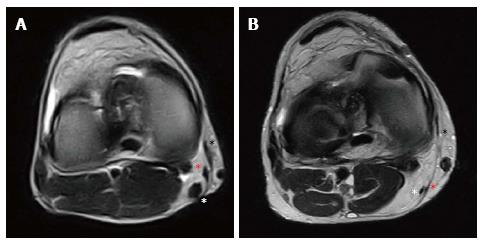
Figure 12 Natural history of Gracilis and Semitendinosus harvesting.
Two years after anterior cruciate ligament reconstruction in a 21-year-old male, in the axial view it is possible to appreciate a well represented “pes anserinus” with regenerated Sartorius fascia (black asterisk), Gracilis tendon (red asterisk) and hypertrophic Semitendinosus tendon (white asterisk) (A). Conversely, seven years after anterior cruciate ligament reconstruction in a 35-year-old male, it is possible to identify the Sartorius fascia (black asterisk) with a thin and hypotrophic Gracilis (red asterisk) and Semitendinosus (white asterisk) tendons (B).
Figure 13 The medial tibial plateau slope is calculated in a sagittal slice passing through the middle-portion of the tibial plateau.
As the angle between the perpendicular line (line c and d) to the proximal tibial axis (line a and b) and the line tangent to the tibial plateau (line e and f) (A); the lateral tibial plateau slope is calculated similarly (B). For a correct identification of the proximal tibial axis, it should pass mid-way on two antero-posterior tibial diameters drawn at a distance of 5 cm and 15 cm from the joint line.
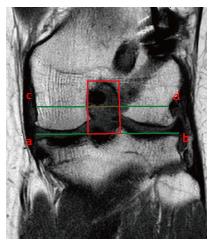
Figure 14 The femoral notch cross sectional area is measured as follows.
The coronal slice passing at the middle point of the Blumensaat Line is chosen. The width of the notch (red dotted line) is measured on a line passing through the popliteal groove (line c and d) parallel to the femoral joint surface (line a and b). The height of the notch is the distance between the joint surface and the top of the intercondylar notch. The cross sectional area (red box) is obtained multiplying the width (mm) by the height (mm).
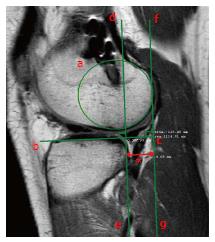
Figure 15 The tibial anterior subluxation with respect to the femur is measured as follow.
With the magnetic resonance imaging acquired in extension and external rotation, the sagittal slice passing through the insertion of the medial gastrocnemius (medial side) or through the most medial cut of the fibula at the tibiofibular joint (lateral side) is selected. Then, a circle over the subchondral line of the posterior condyle (circle a) and a line tangential to the tibial plateau (line b and c) are drawn. The distance (red asterisk) between a perpendicular line to the tibial plateau passing through its posterior margin (line d and e) and a parallel line tangent to the circle (line f and g) is measured.
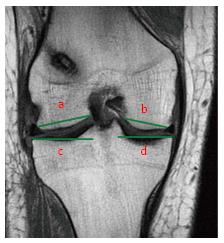
Figure 16 Tibial plateau anatomy is best evaluated by selecting the coronal slice where both tibial spines are visible.
Lateral Femoral Condyle (line a) and Medial Femoral Condyle (line b) diameters are measured from borders of corresponding articular cartilage. Lateral Tibial Plateau (line c) and Medial Tibial Plateau (line d) diameters are measured from the intercondylar spine to the border of the corresponding tibial plateau.
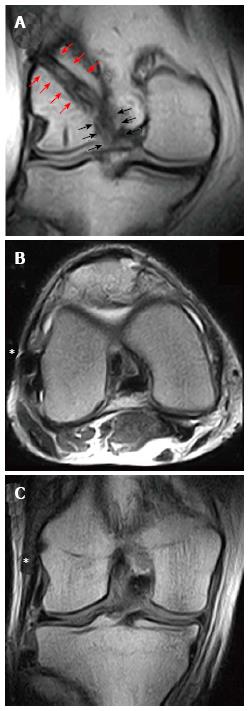
Figure 17 Magnetic resonance imaging evaluation of an anterior cruciate ligament reconstruction with a single-bundle plus lateral extra-articular plasty/augmentation using Gracilis and Semitendinosus Autograft.
In the coronal view, it is possible to identify the intra-articular part of the graft (black arrows) that continue proximally above the lateral femoral condyle (red arrows) in the “over-the-top” position (A). The lateral extra-articular plasty (asterisk) could be identified both in axial (B) and coronal view (C) beneath the iliotibial band, extending from the lateral femoral condyle to Gerdy’s tubercle.
- Citation: Grassi A, Bailey JR, Signorelli C, Carbone G, Wakam AT, Lucidi GA, Zaffagnini S. Magnetic resonance imaging after anterior cruciate ligament reconstruction: A practical guide. World J Orthop 2016; 7(10): 638-649
- URL: https://www.wjgnet.com/2218-5836/full/v7/i10/638.htm
- DOI: https://dx.doi.org/10.5312/wjo.v7.i10.638


