Copyright
©The Author(s) 2025.
World J Orthop. Jun 18, 2025; 16(6): 103832
Published online Jun 18, 2025. doi: 10.5312/wjo.v16.i6.103832
Published online Jun 18, 2025. doi: 10.5312/wjo.v16.i6.103832
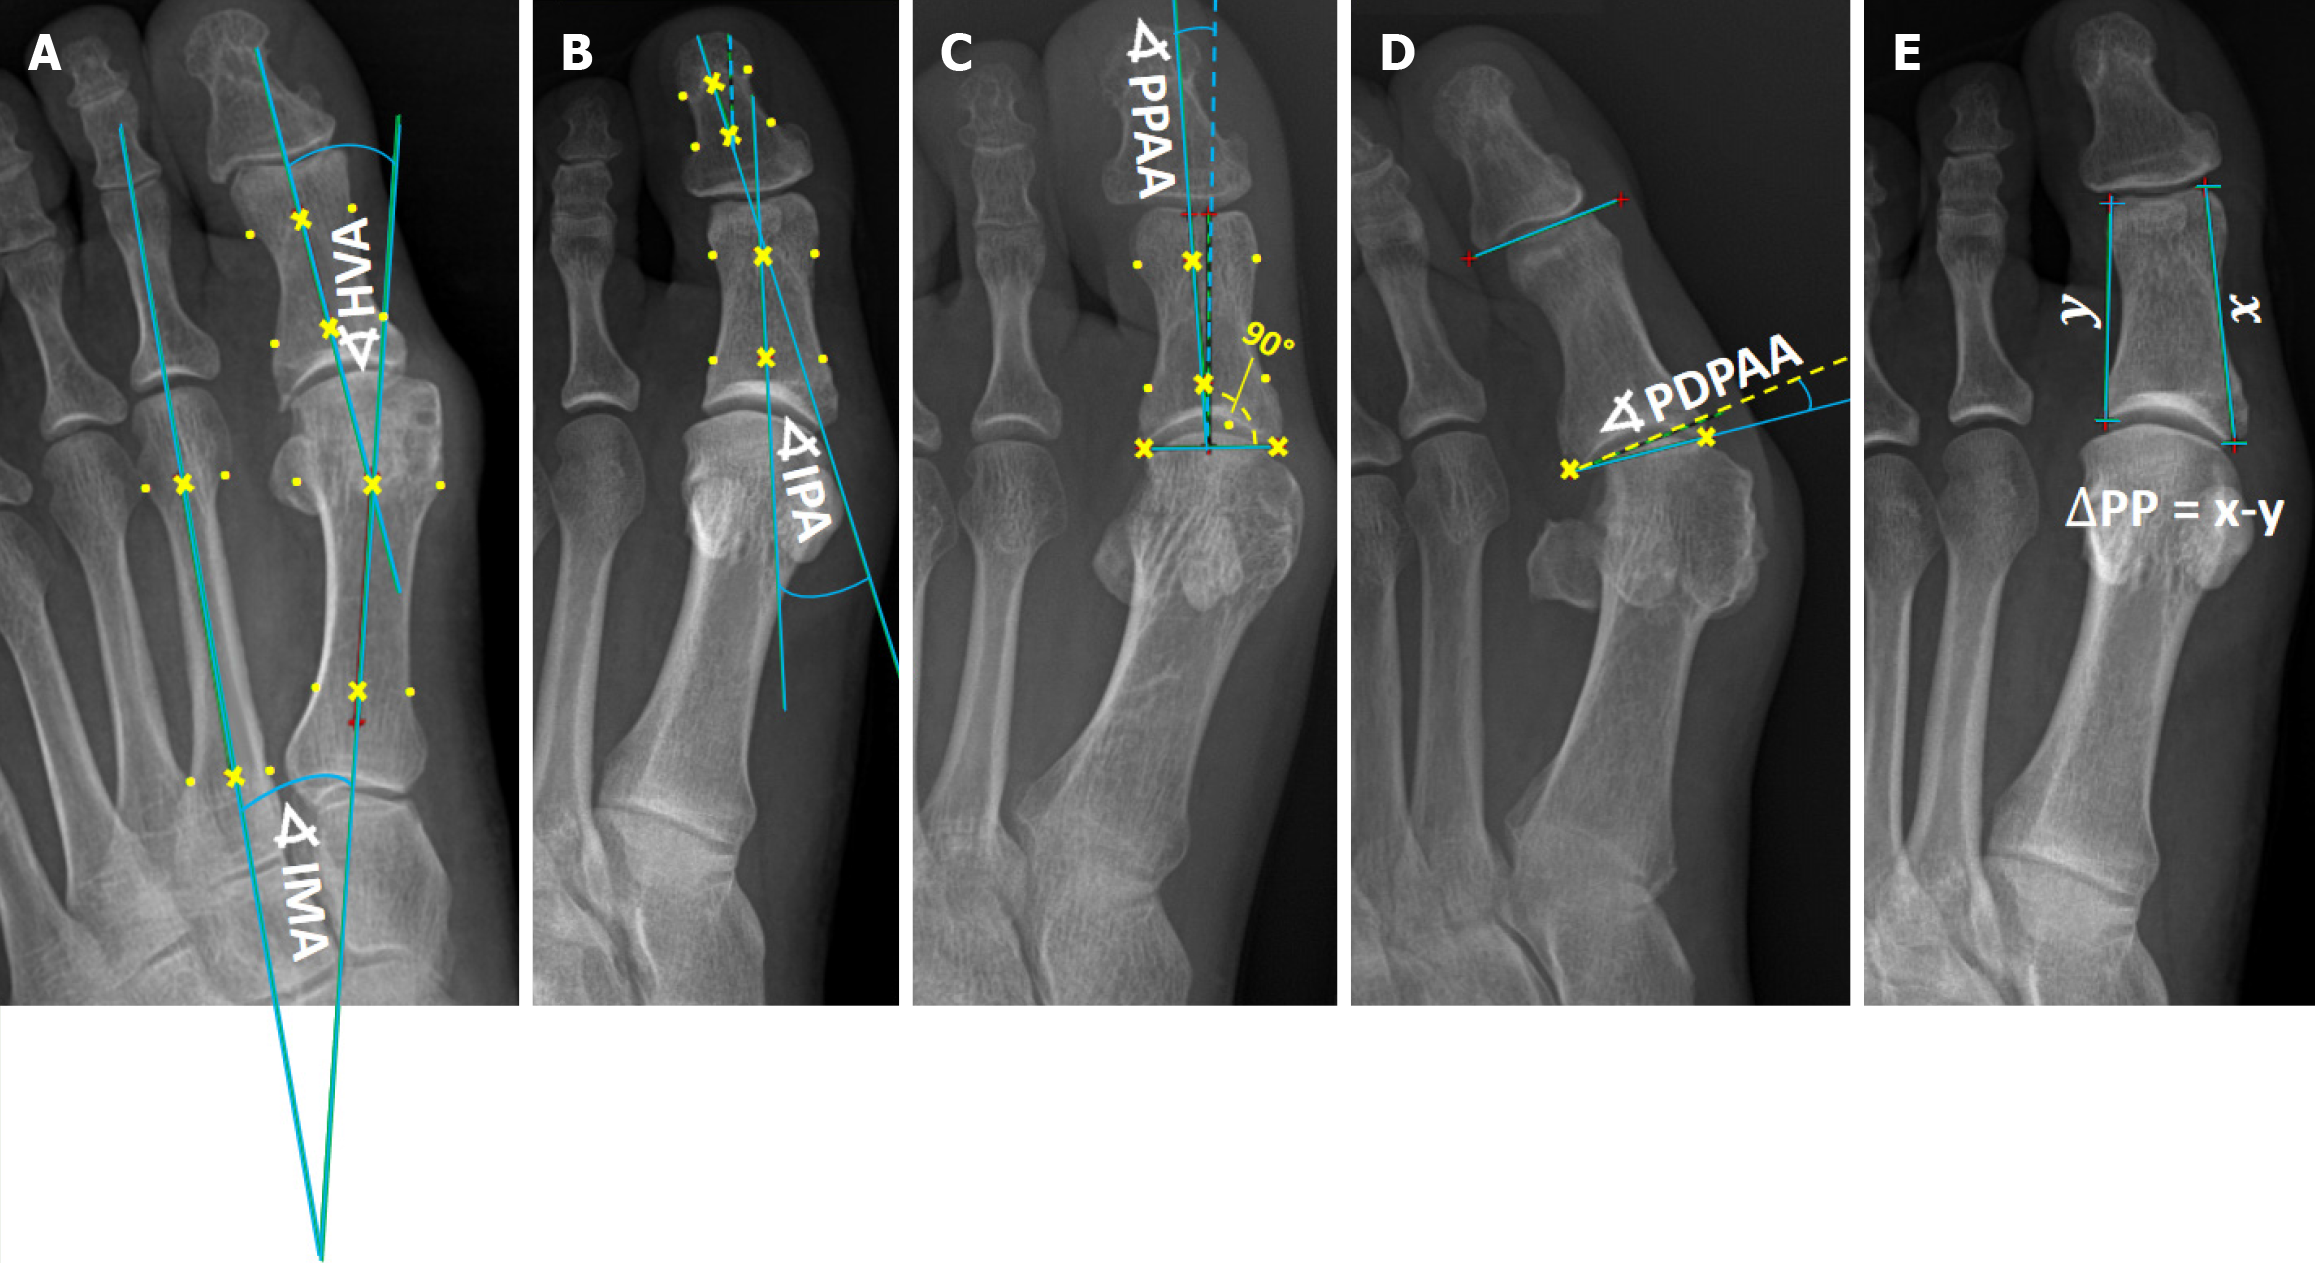
Figure 1 Illustration of the method of measurement.
A: Angles of hallux valgus (HV); B-D: Angles of HV interphalangeus; E: Delta proximal phalanx index. HVA: Hallux valgus angle; IMA: Intermetatarsal angle; IPA: Interphalangeal angle; PDPAA: Proximal to distal phalangeal articular angle; PPAA: Proximal phalangeal articular angle; ∆PP: Delta proximal phalanx.
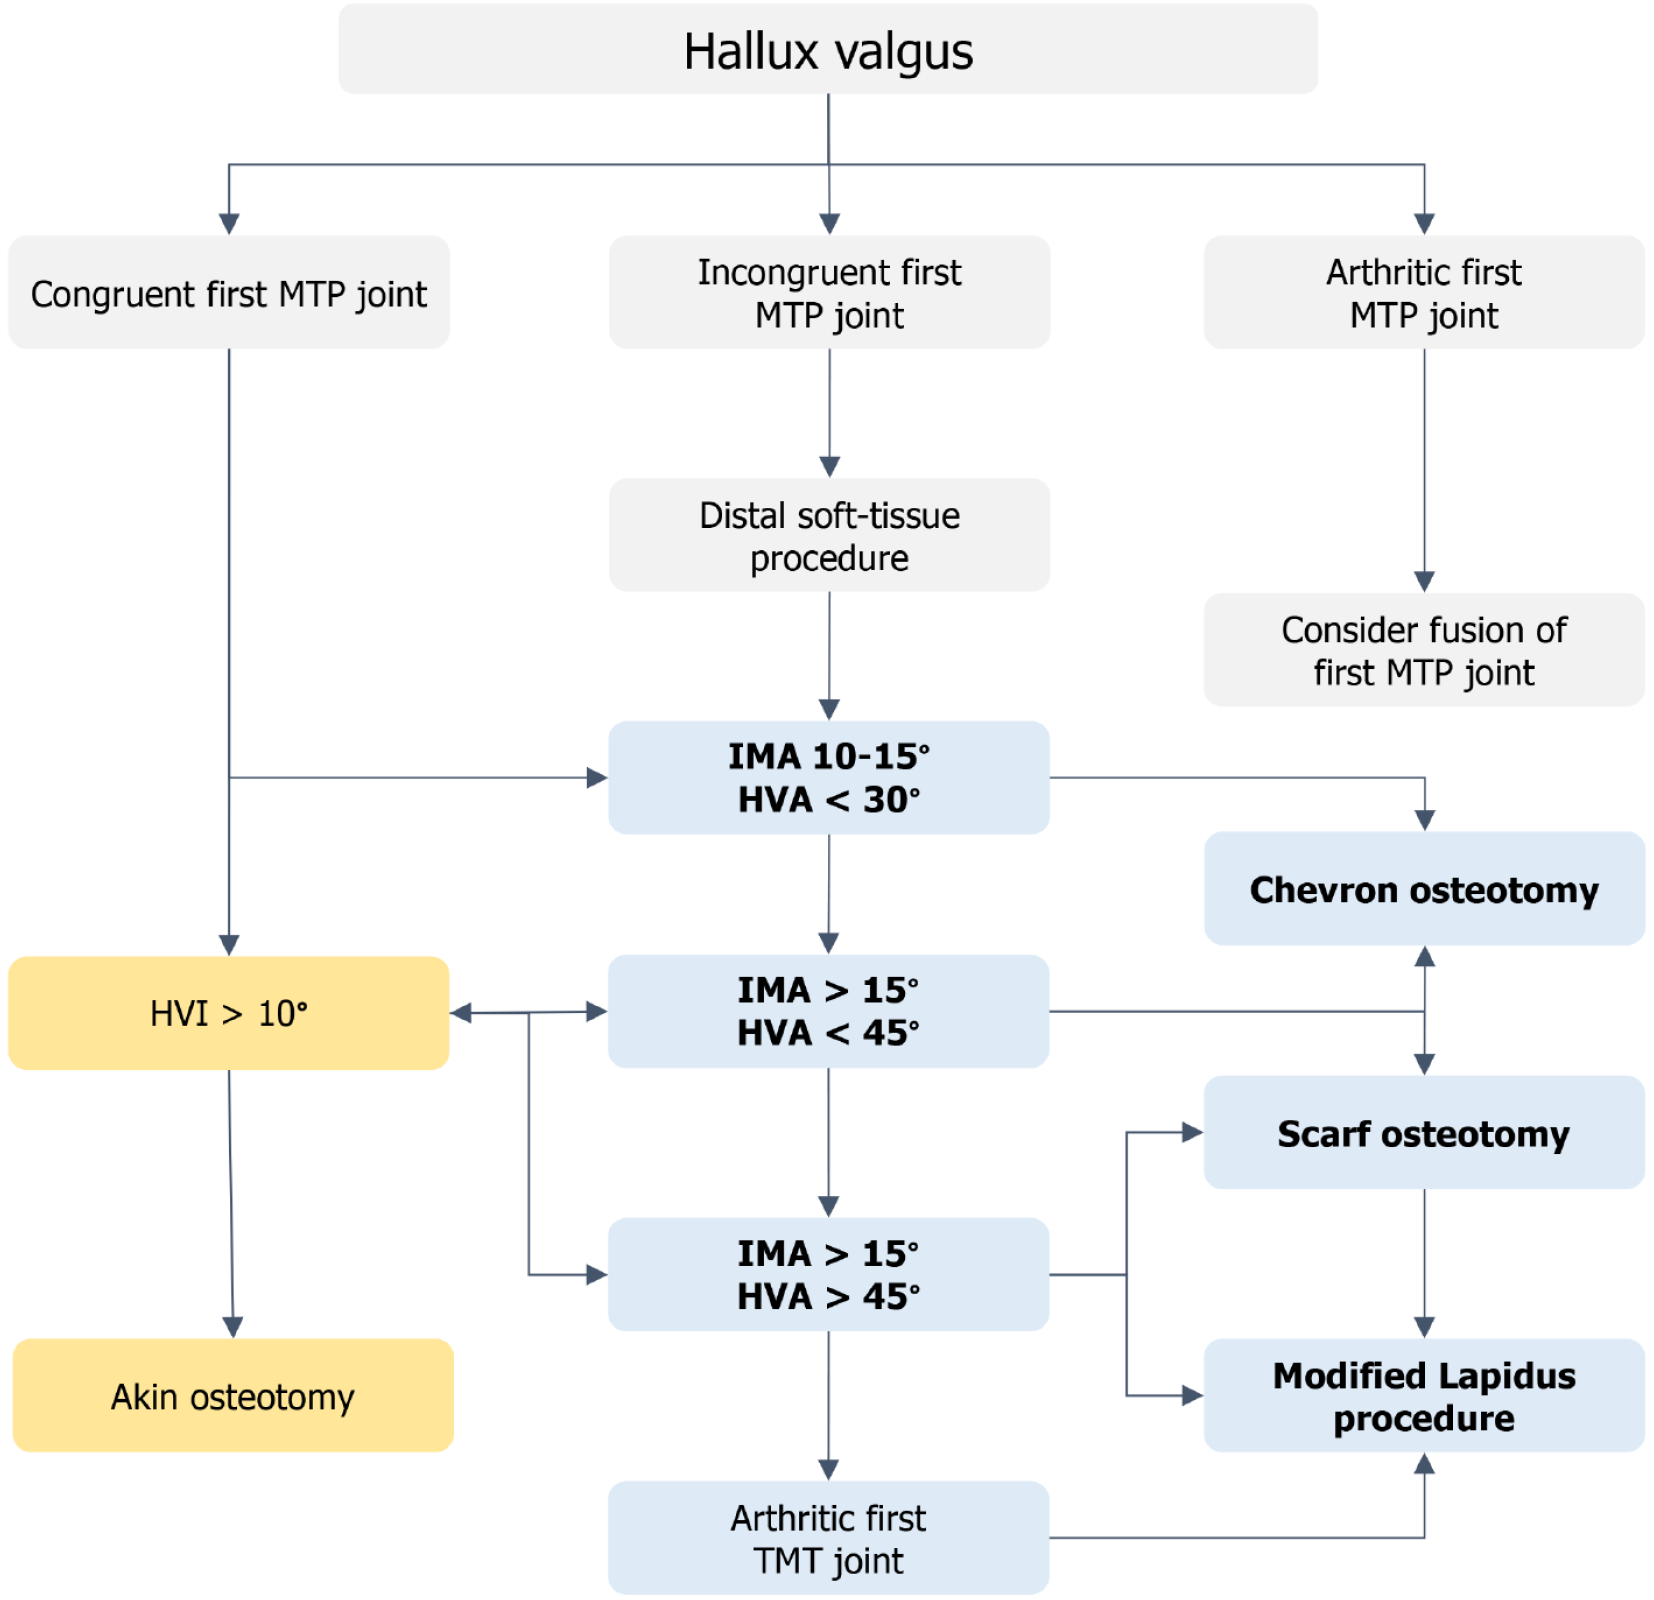
Figure 2 Operative treatment algorithm of hallux valgus proposed by the European Federation of National Associations of Orthopaedics and Traumatology.
HVA: Hallux valgus angle; HVI: Hallux valgus interphalangeus; IMA: Interphalangeal angle; MTP: Metatarsophalangeal; TMT: Tarsometatarsal.
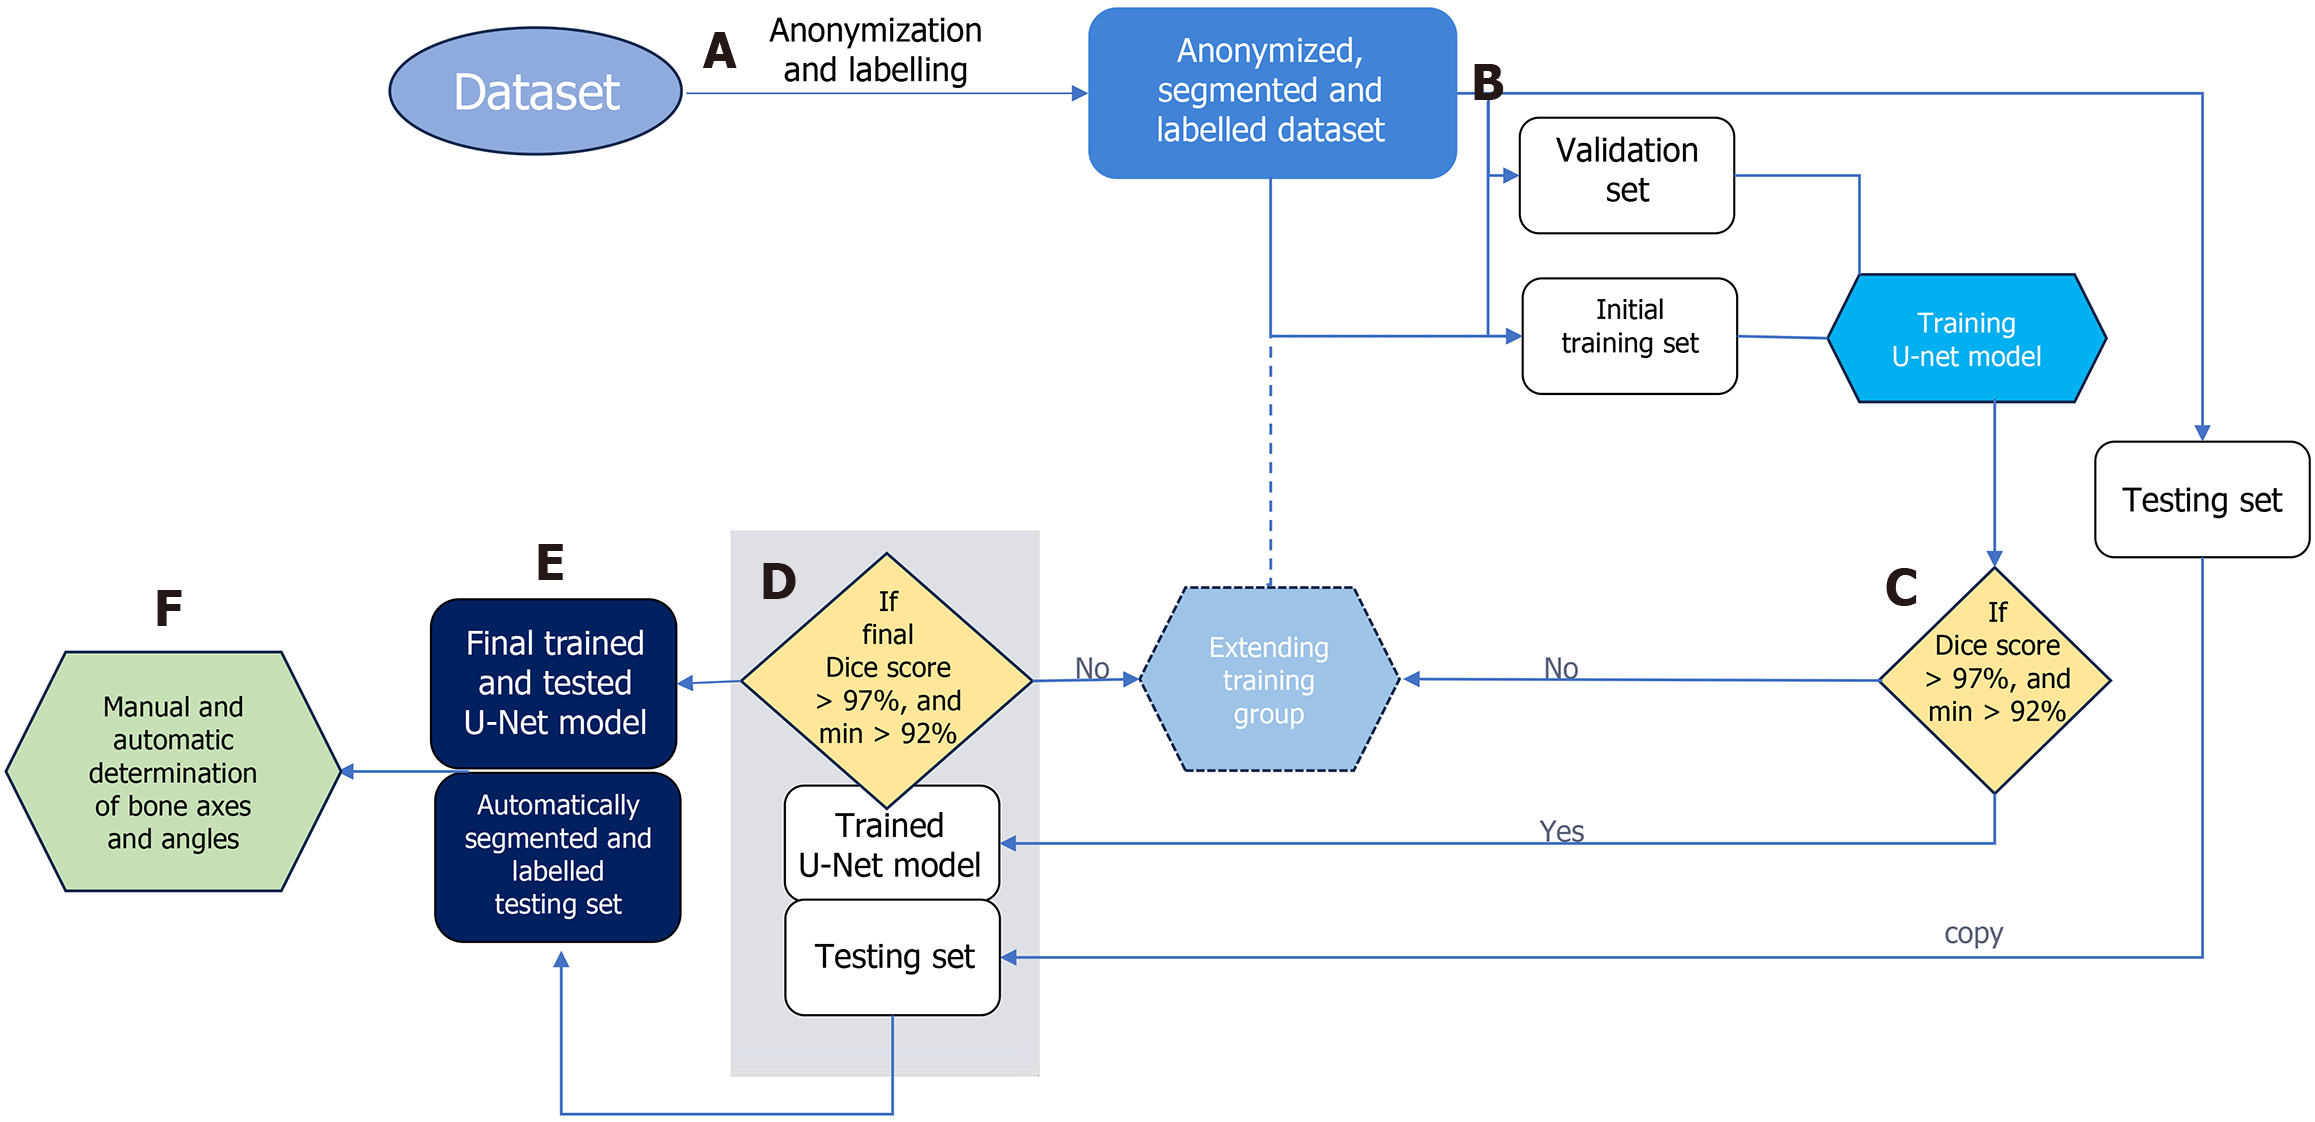
Figure 3 Data flow in the proposed approach.
Stage-A: Bones are manually segmented and labeled from anonymized input radiographs to prepare dataset for multi-class segmentation using a U-Net neural network; Stage-B: Radiographs are randomly divided into three subsets: (1) Training; (2) Validation; and (3) Testing; Stage-C: During each training cycle, the accuracy of bone segmentation by the U-Net is validated on a fixed validation subset of 20 radiographs. The U-Net is initially trained on a subset of 50 radiographs, which is incrementally increased by 10 per cycle until the average Sørensen–Dice index (SDI) exceeds 97% on the validation set; Stage-D: Once the U-Net achieves an SDI > 0.97 on the testing subset, the training process is considered complete. If the SDI does not exceed 0.97, the training subset is expanded, and the network is retrained; Stage-E: The final trained U-Net is used to segment and label bones on all testing radiographs; Stage-F: These segmented bones are then utilized to automatically determine reference points and calculate interphalangeal angle measurements.
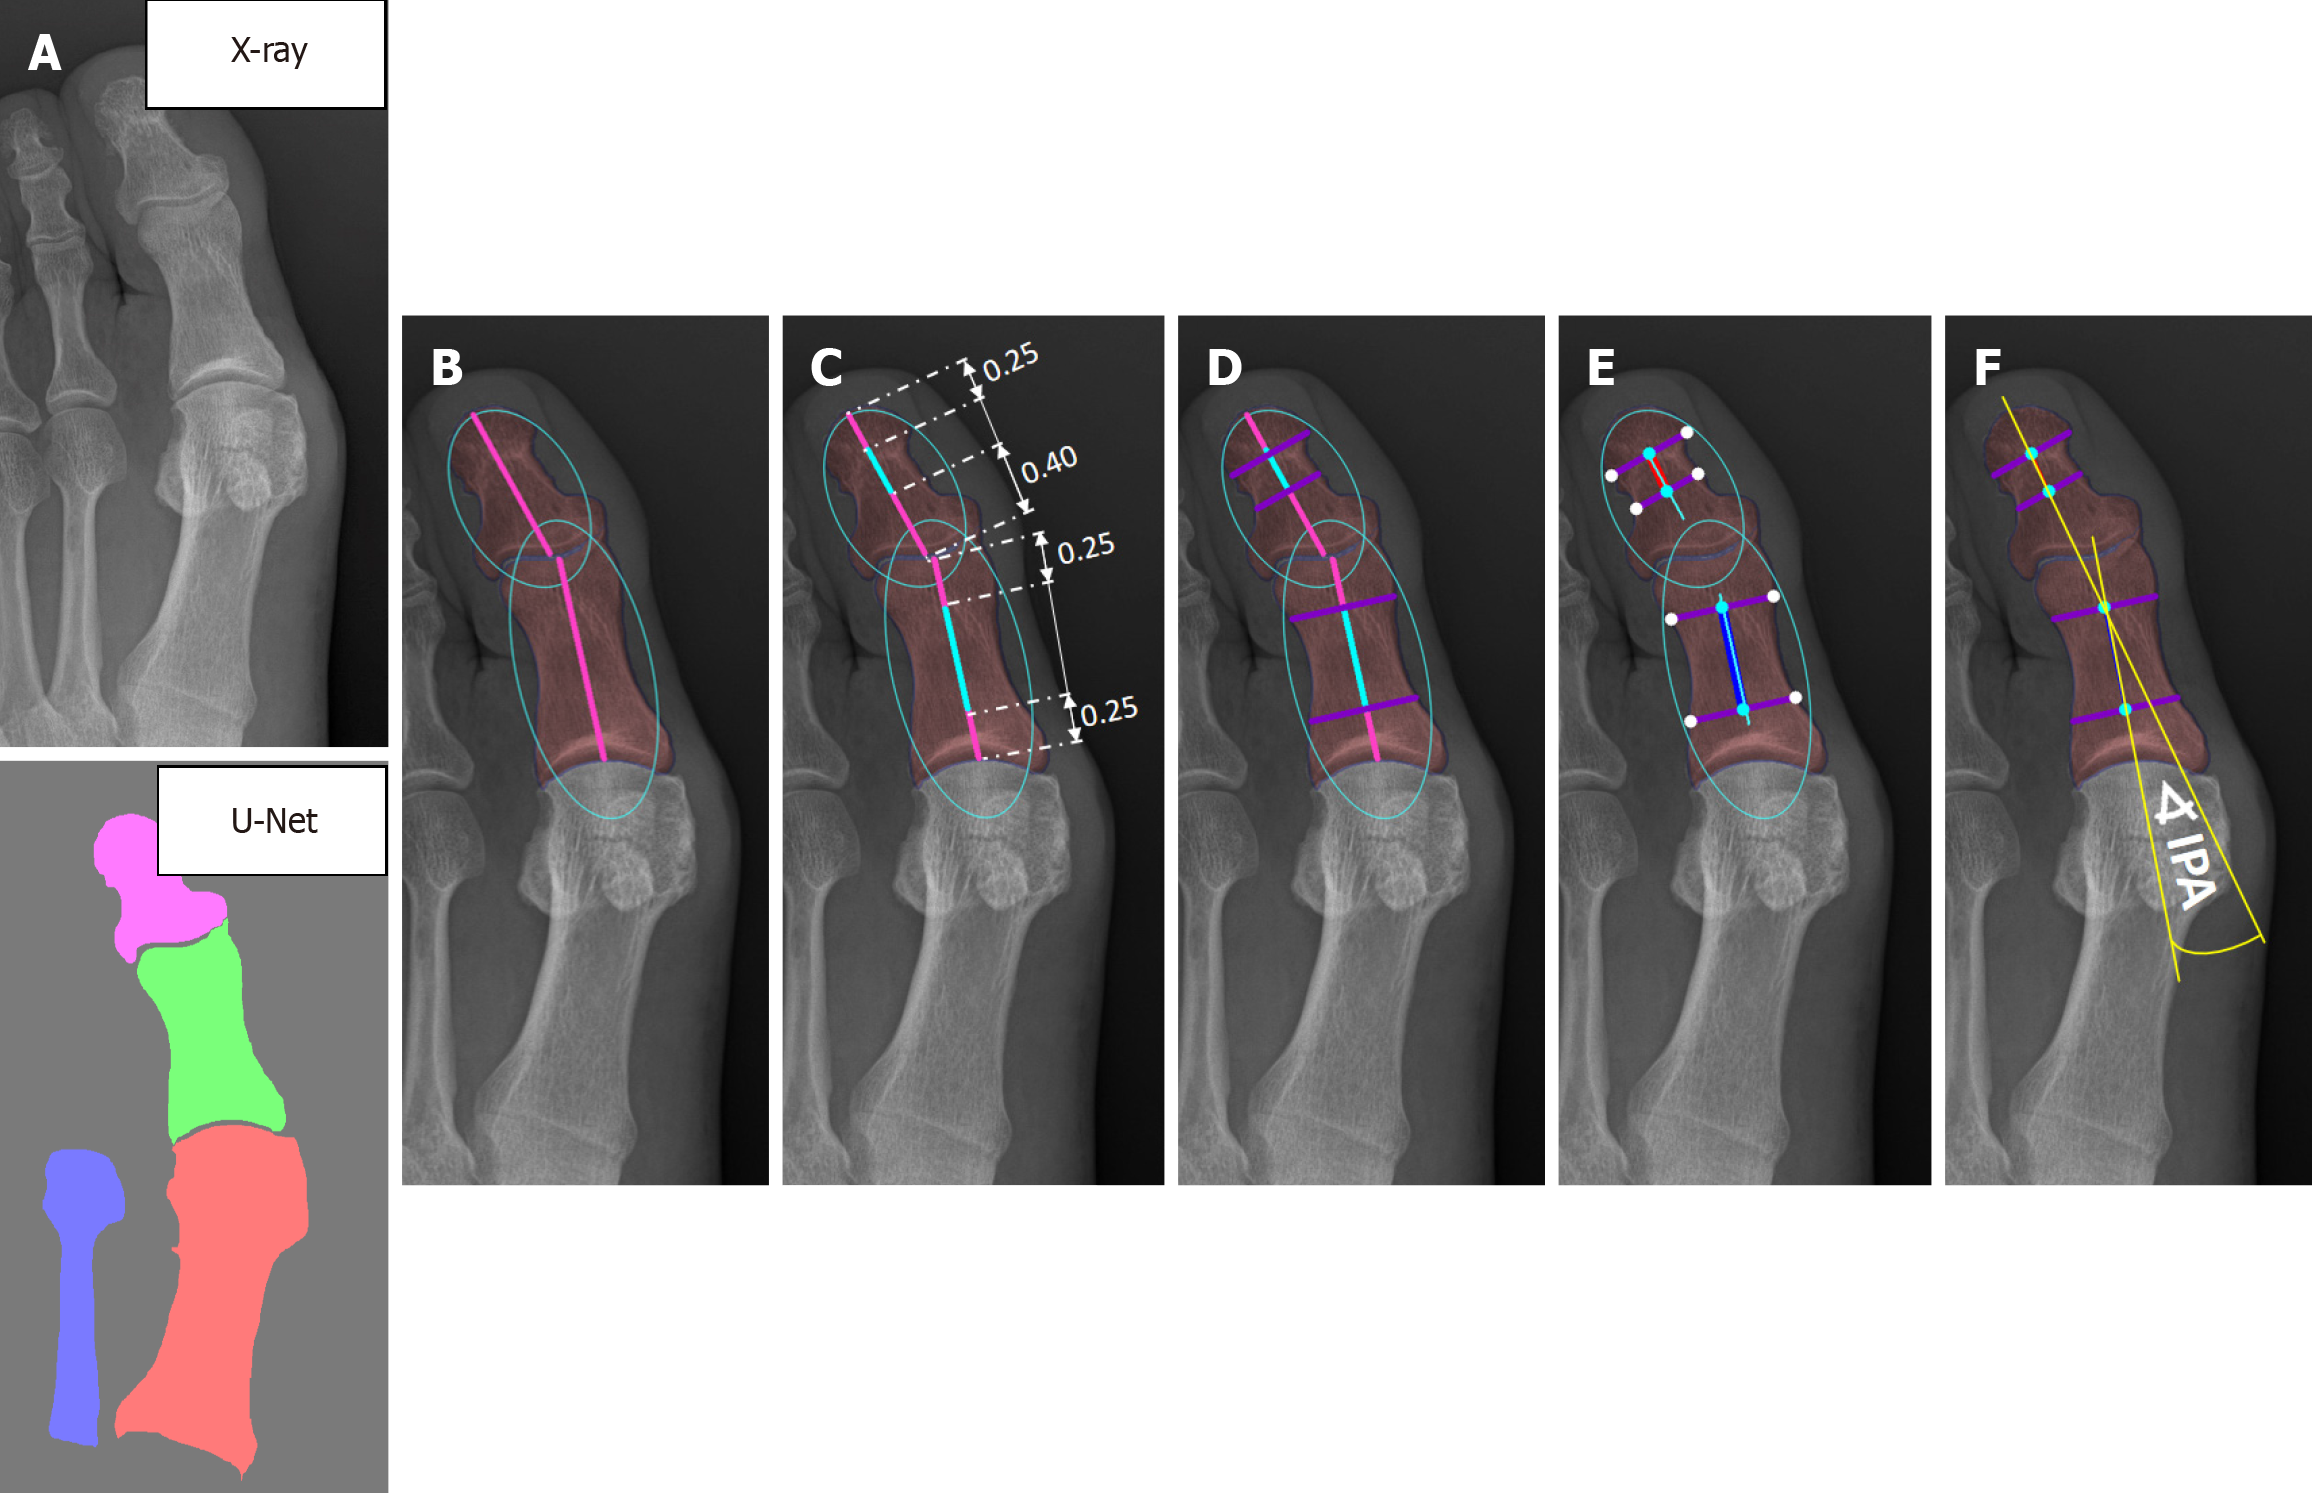
Figure 4 Automated determination of proximal and distal phalanx bone axes.
A: Input X-ray and post-processed bone segmentation results; B: The bones are approximated using ellipses, from which the ellipse axes are extracted. The axes within the bones are indicated by pink lines, with their proportions determined experimentally: (1) 0.25: 0.25 for the proximal phalanx; and (2) 0.40: 0.25 for the distal phalanx; C: The central points of the ellipse subaxes are represented by light blue lines; D: Lines perpendicular to the ellipse subaxes are drawn at their endpoints and illustrated in purple; E: The midpoints of these purple lines are marked with light blue dots, serving as key points for defining the bone axis, which is depicted as blue and red lines; F: The final axes, shown as yellow lines, for interphalangeal angle estimation are computed as a weighted average of the ellipse axis and the bone axis. IPA: Interphalangeal angle.
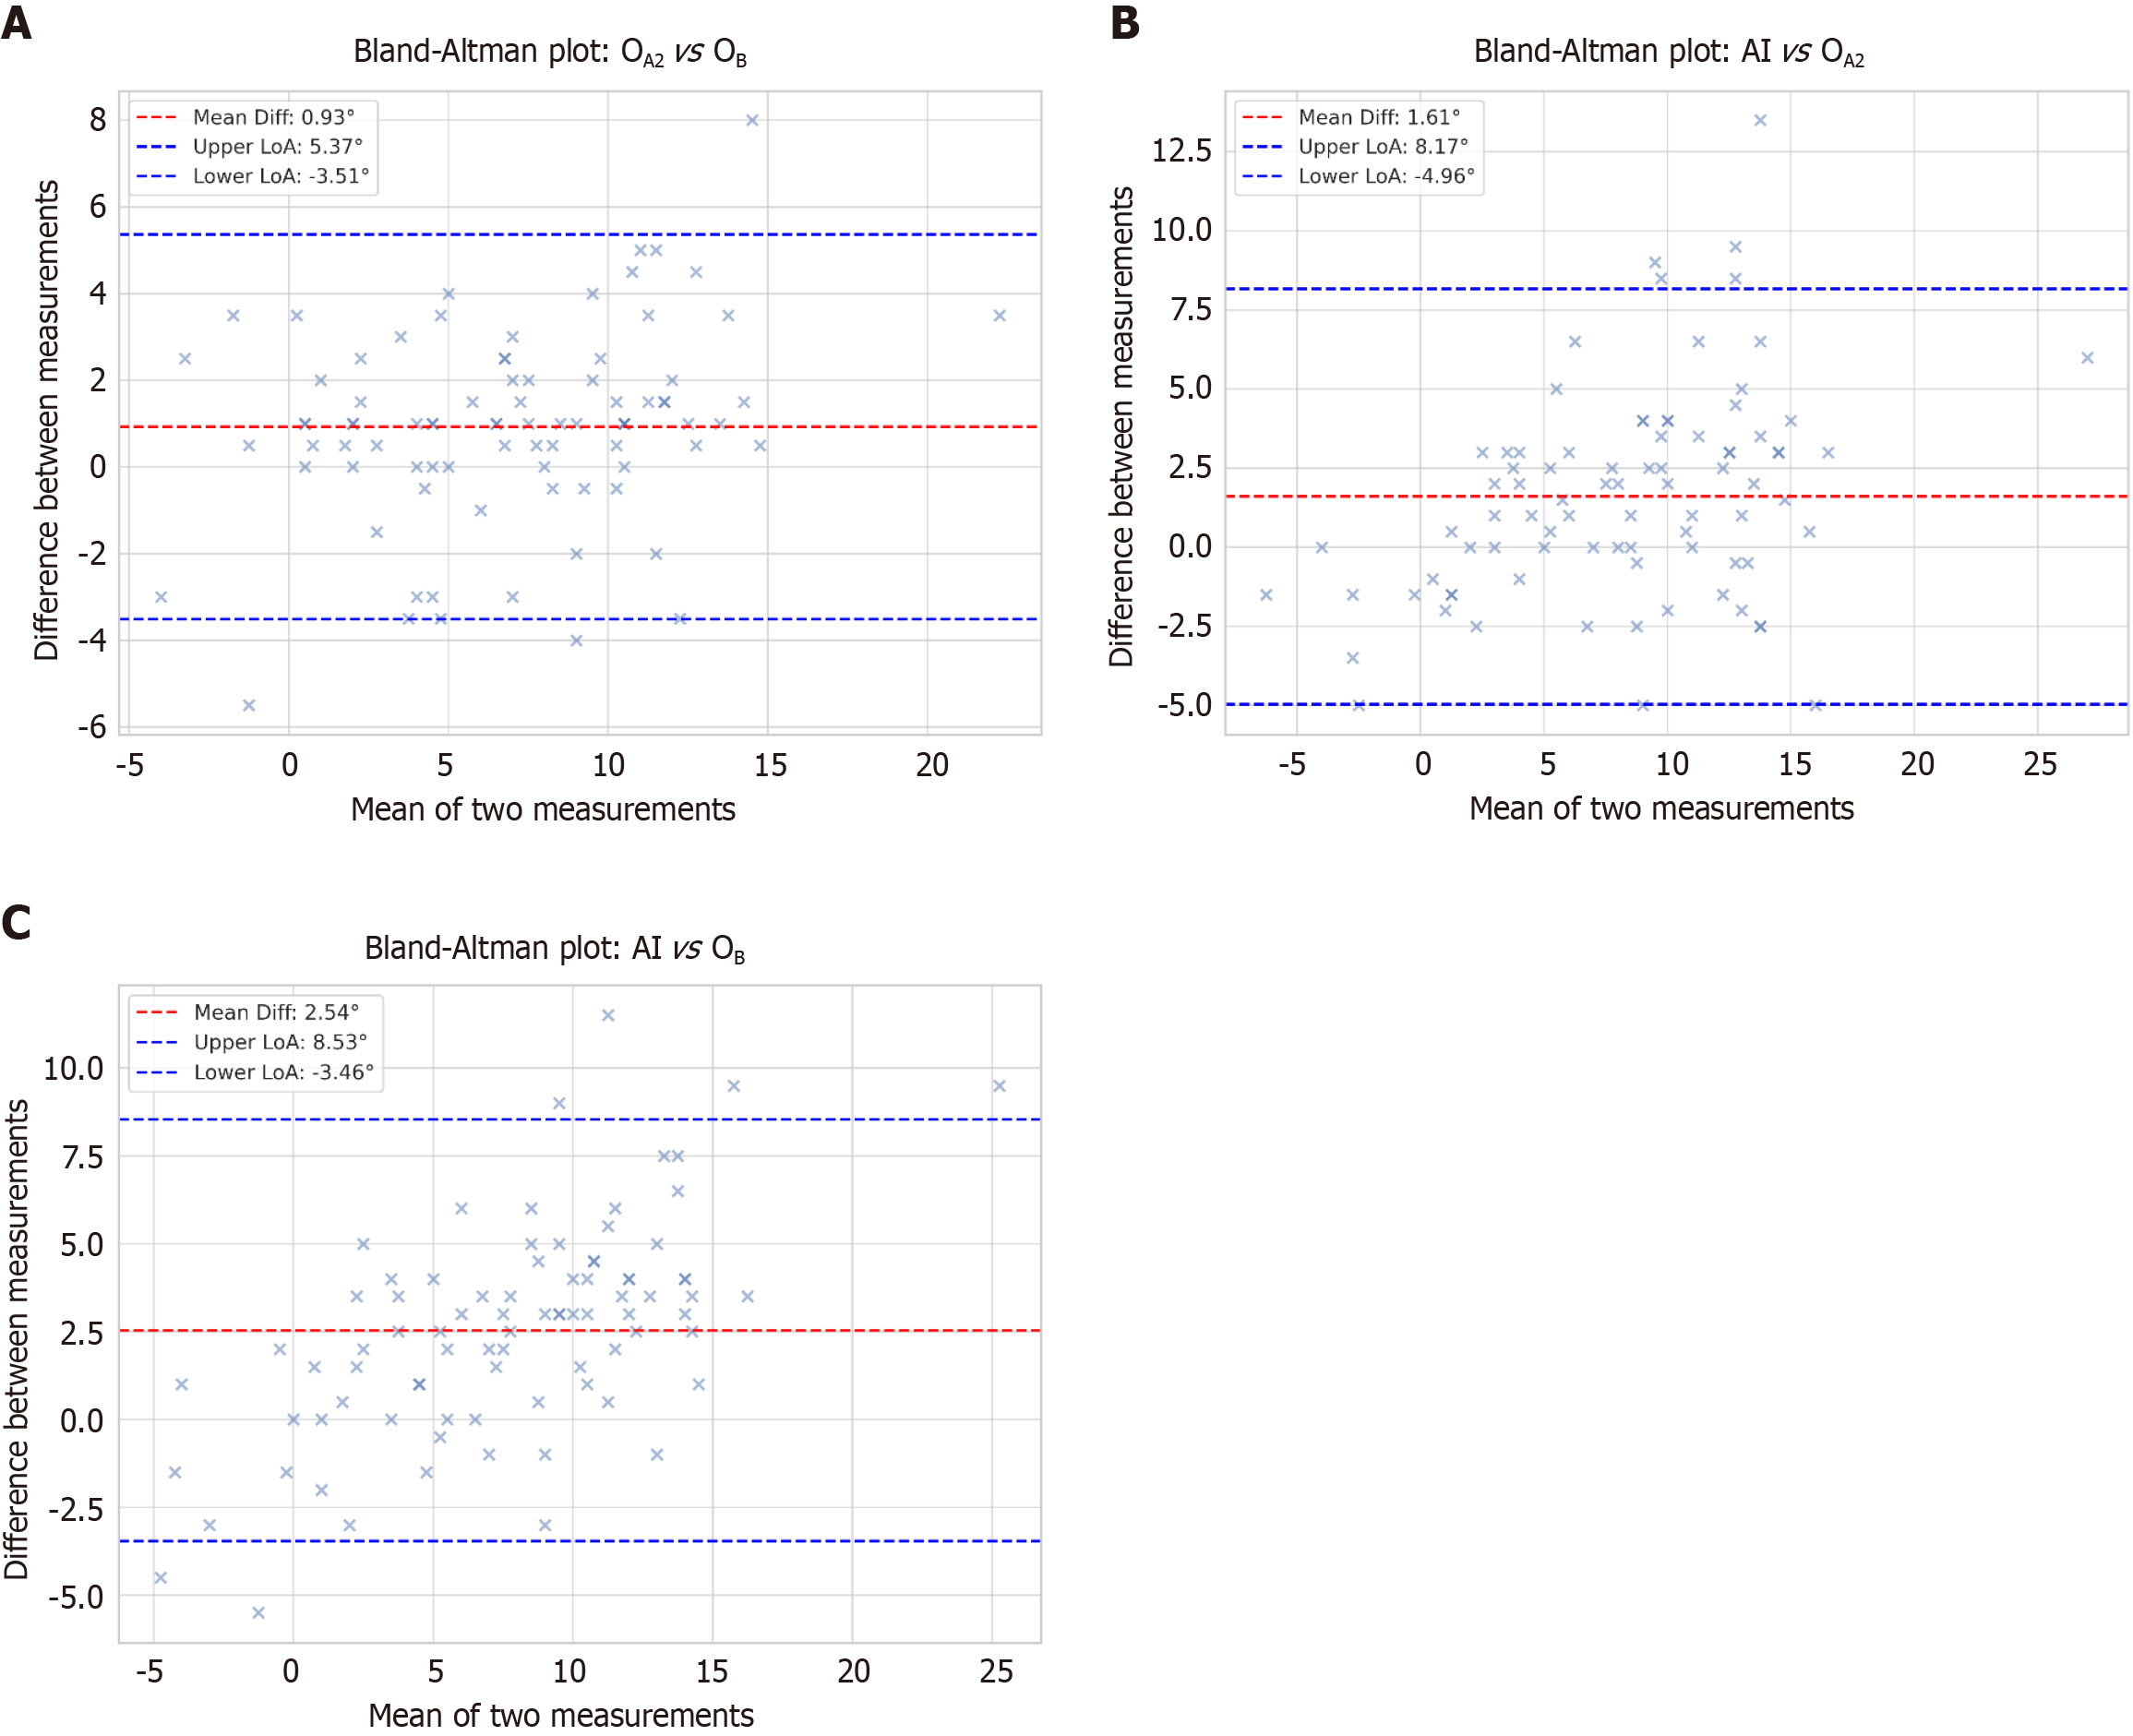
Figure 5 Bland-Altman plots.
A: Agreement between the first and second manual measurements (OA2vs OB); B: Comparison between the artificial intelligence (AI)-generated measurements and the manual measurement of the first orthopedist (AI vs OA2); C: Comparison between the AI-generated measurements and the manual measurement of the second orthopedist (AI vs OB). The plot indicates the mean difference (bias) and limits of agreement, helping to assess systematic differences and consistency between repeated manual measurements. AI: Artificial intelligence; LoA: Limits of agreement; O: Orthopedic surgeons.
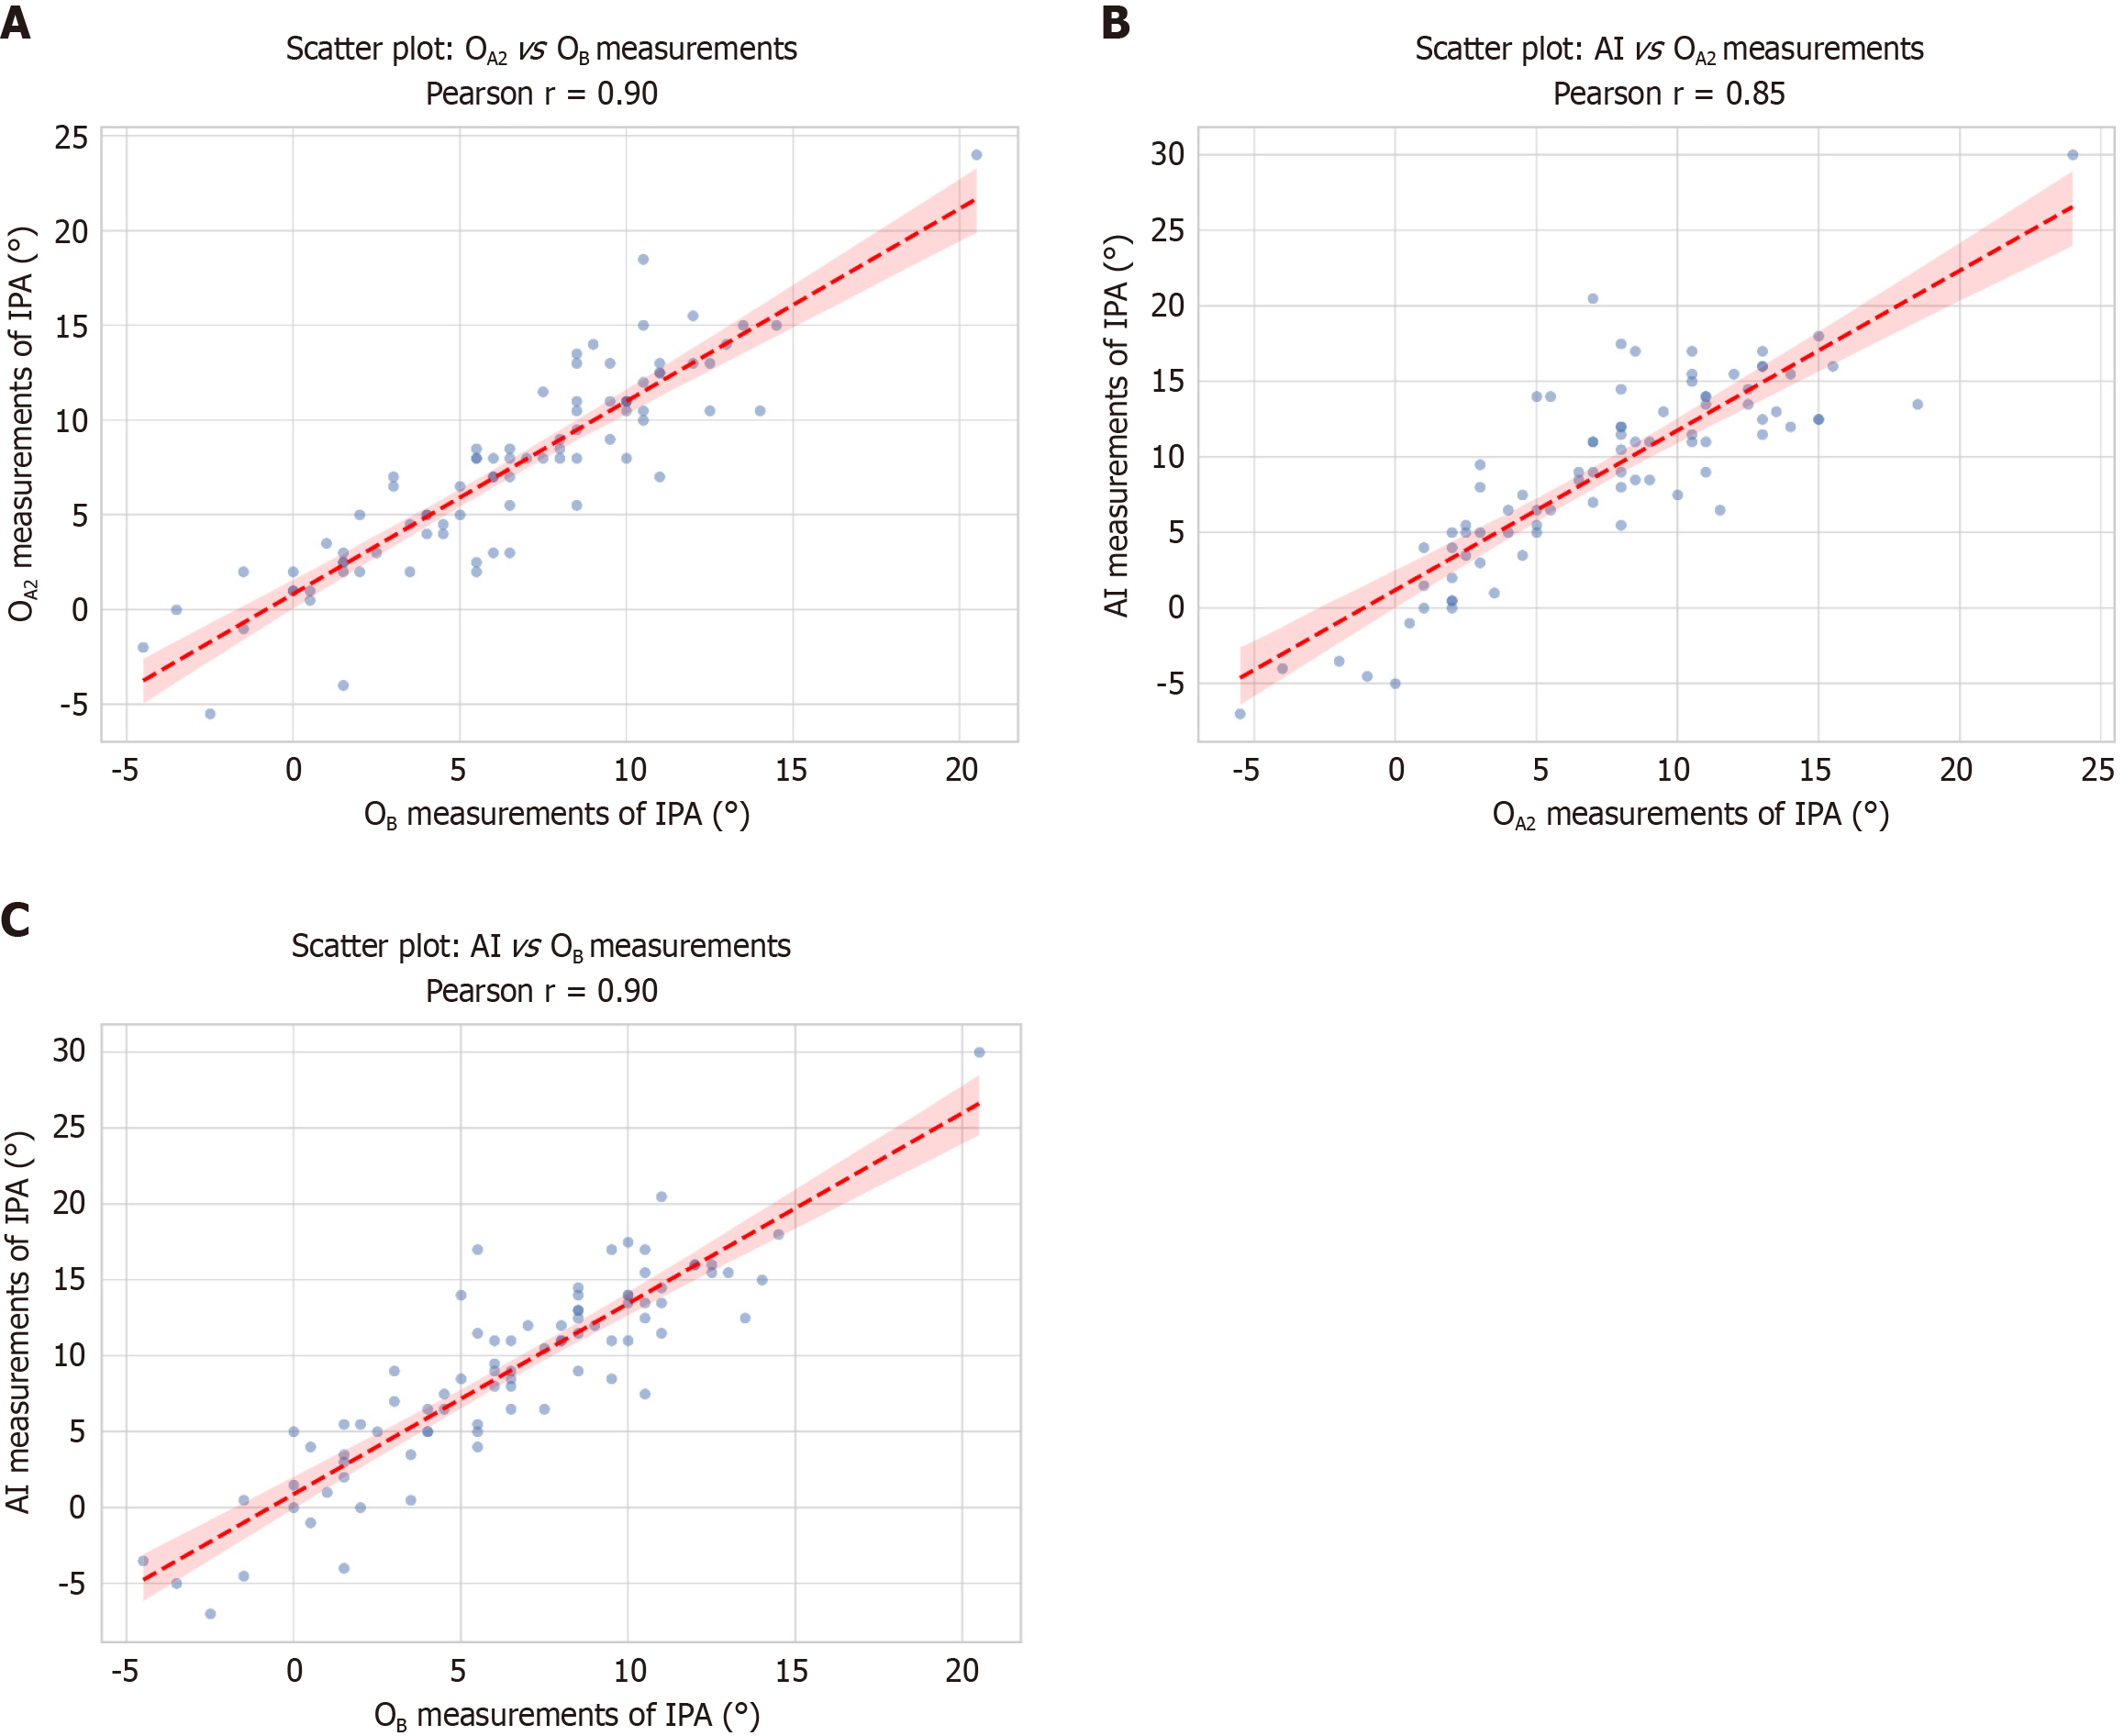
Figure 6 Scatter Plots with regression lines showing correlation.
A: Between the two manual measurements [Orthopedic surgeons (OA2vs OB)]; B: Between the artificial intelligence (AI)-generated measurements and the manual measurement of the first orthopedist (AI vs OA2); C: Between the AI-generated measurements and the manual measurement of the second orthopedist (AI vs OB). The linear regression line indicates the relationship strength, where points closer to the line reflect stronger alignment between AI and manual measurements. AI: Artificial intelligence.
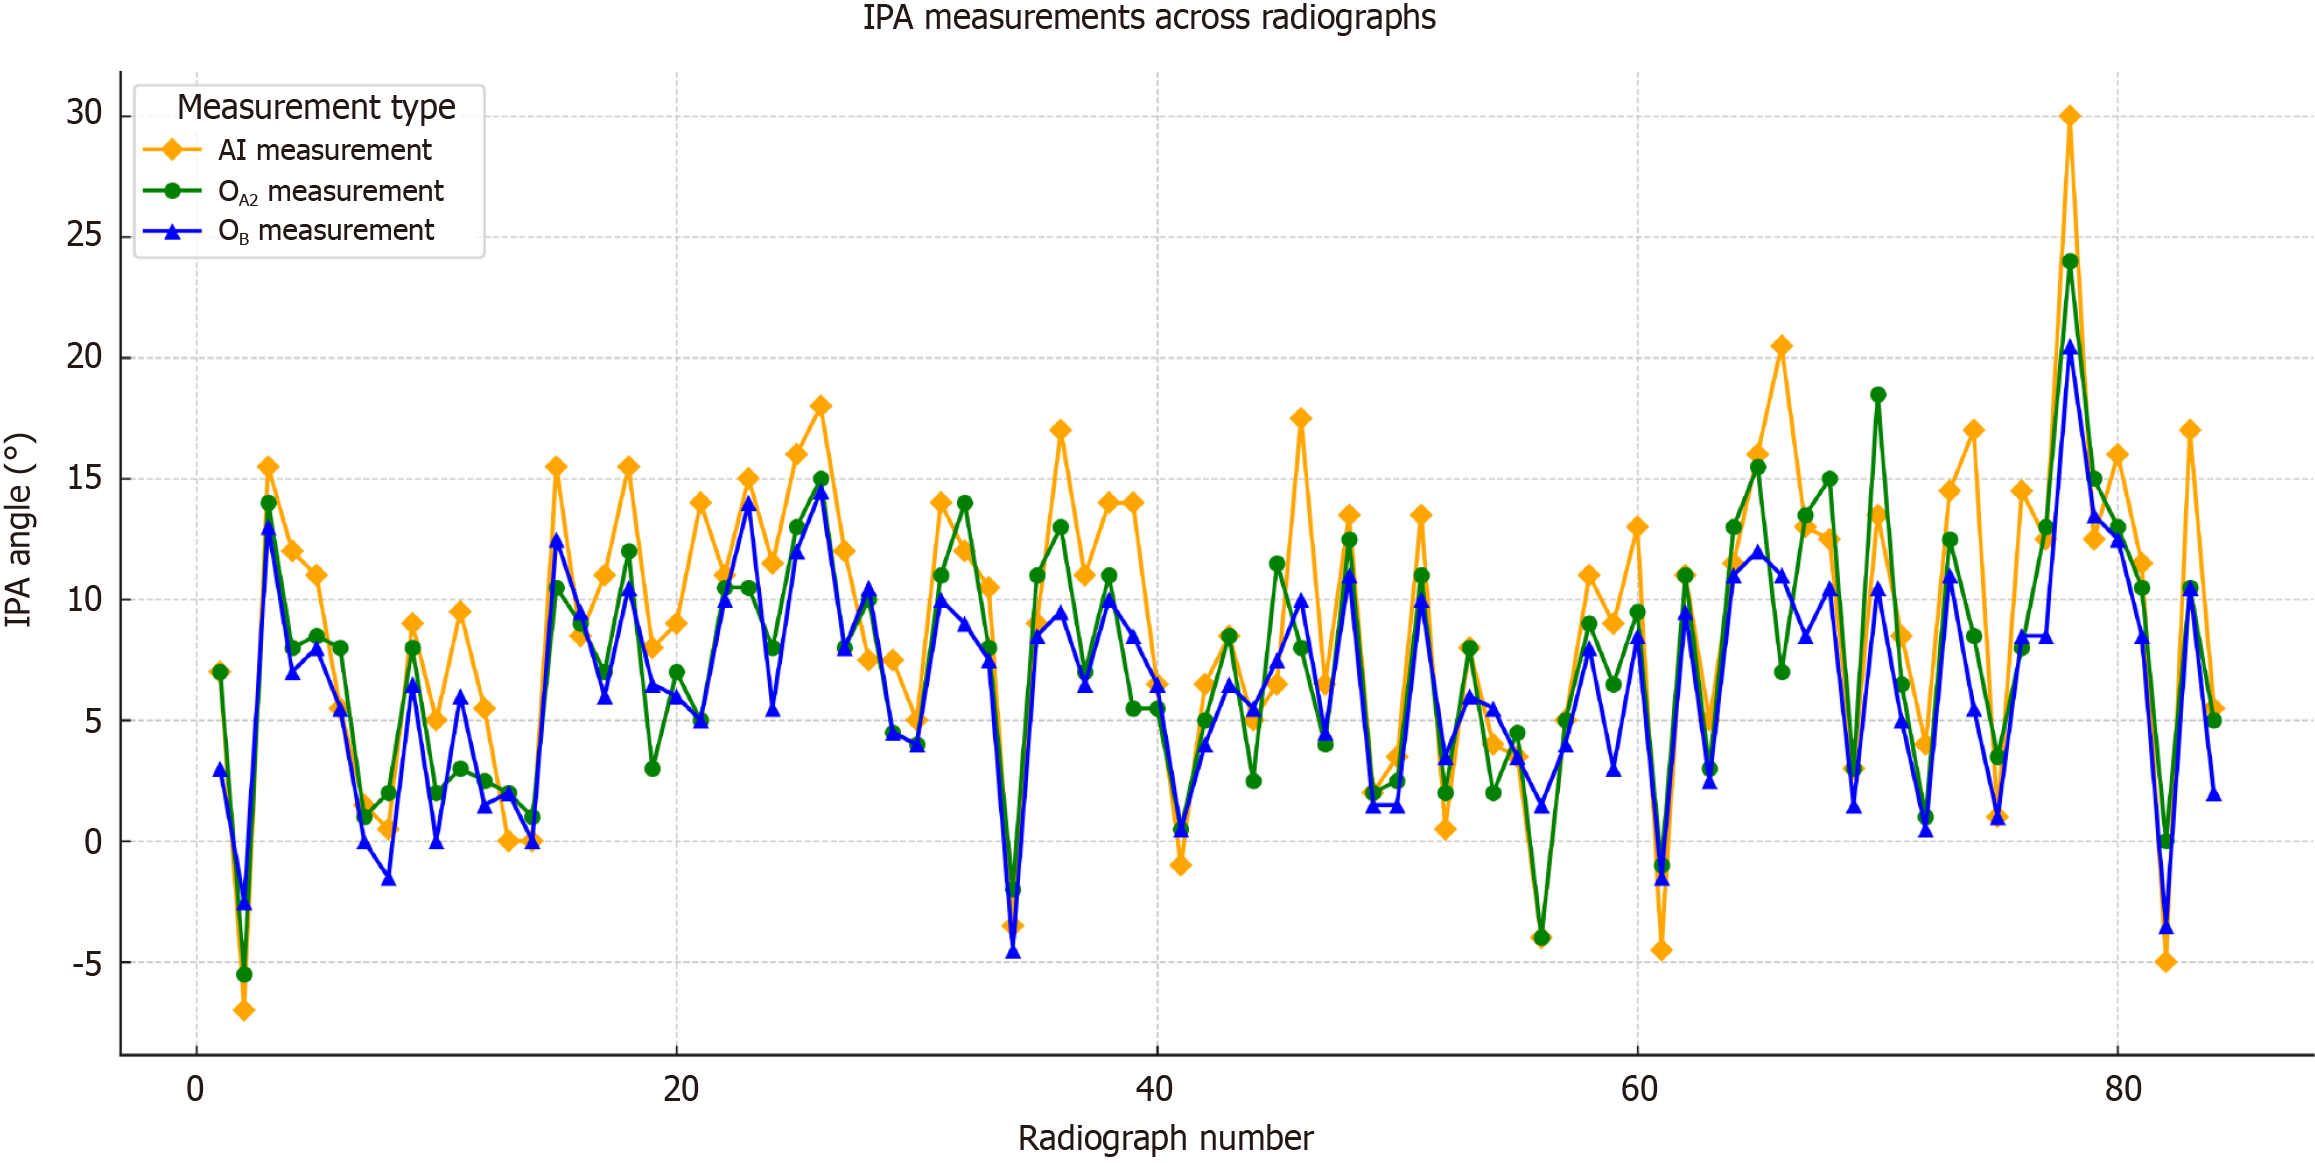
Figure 7 Line graph of interphalangeal angle measurements across subjects.
This graph illustrates the consistency of interphalangeal angle measurements across subjects, comparing values obtained using artificial intelligence (AI) and those measured by orthopedists (OA2 and OB), highlighting the alignment between manual and AI-based assessments. AI: Artificial intelligence; IPA: Interphalangeal angle. O: Orthopedic surgeons.
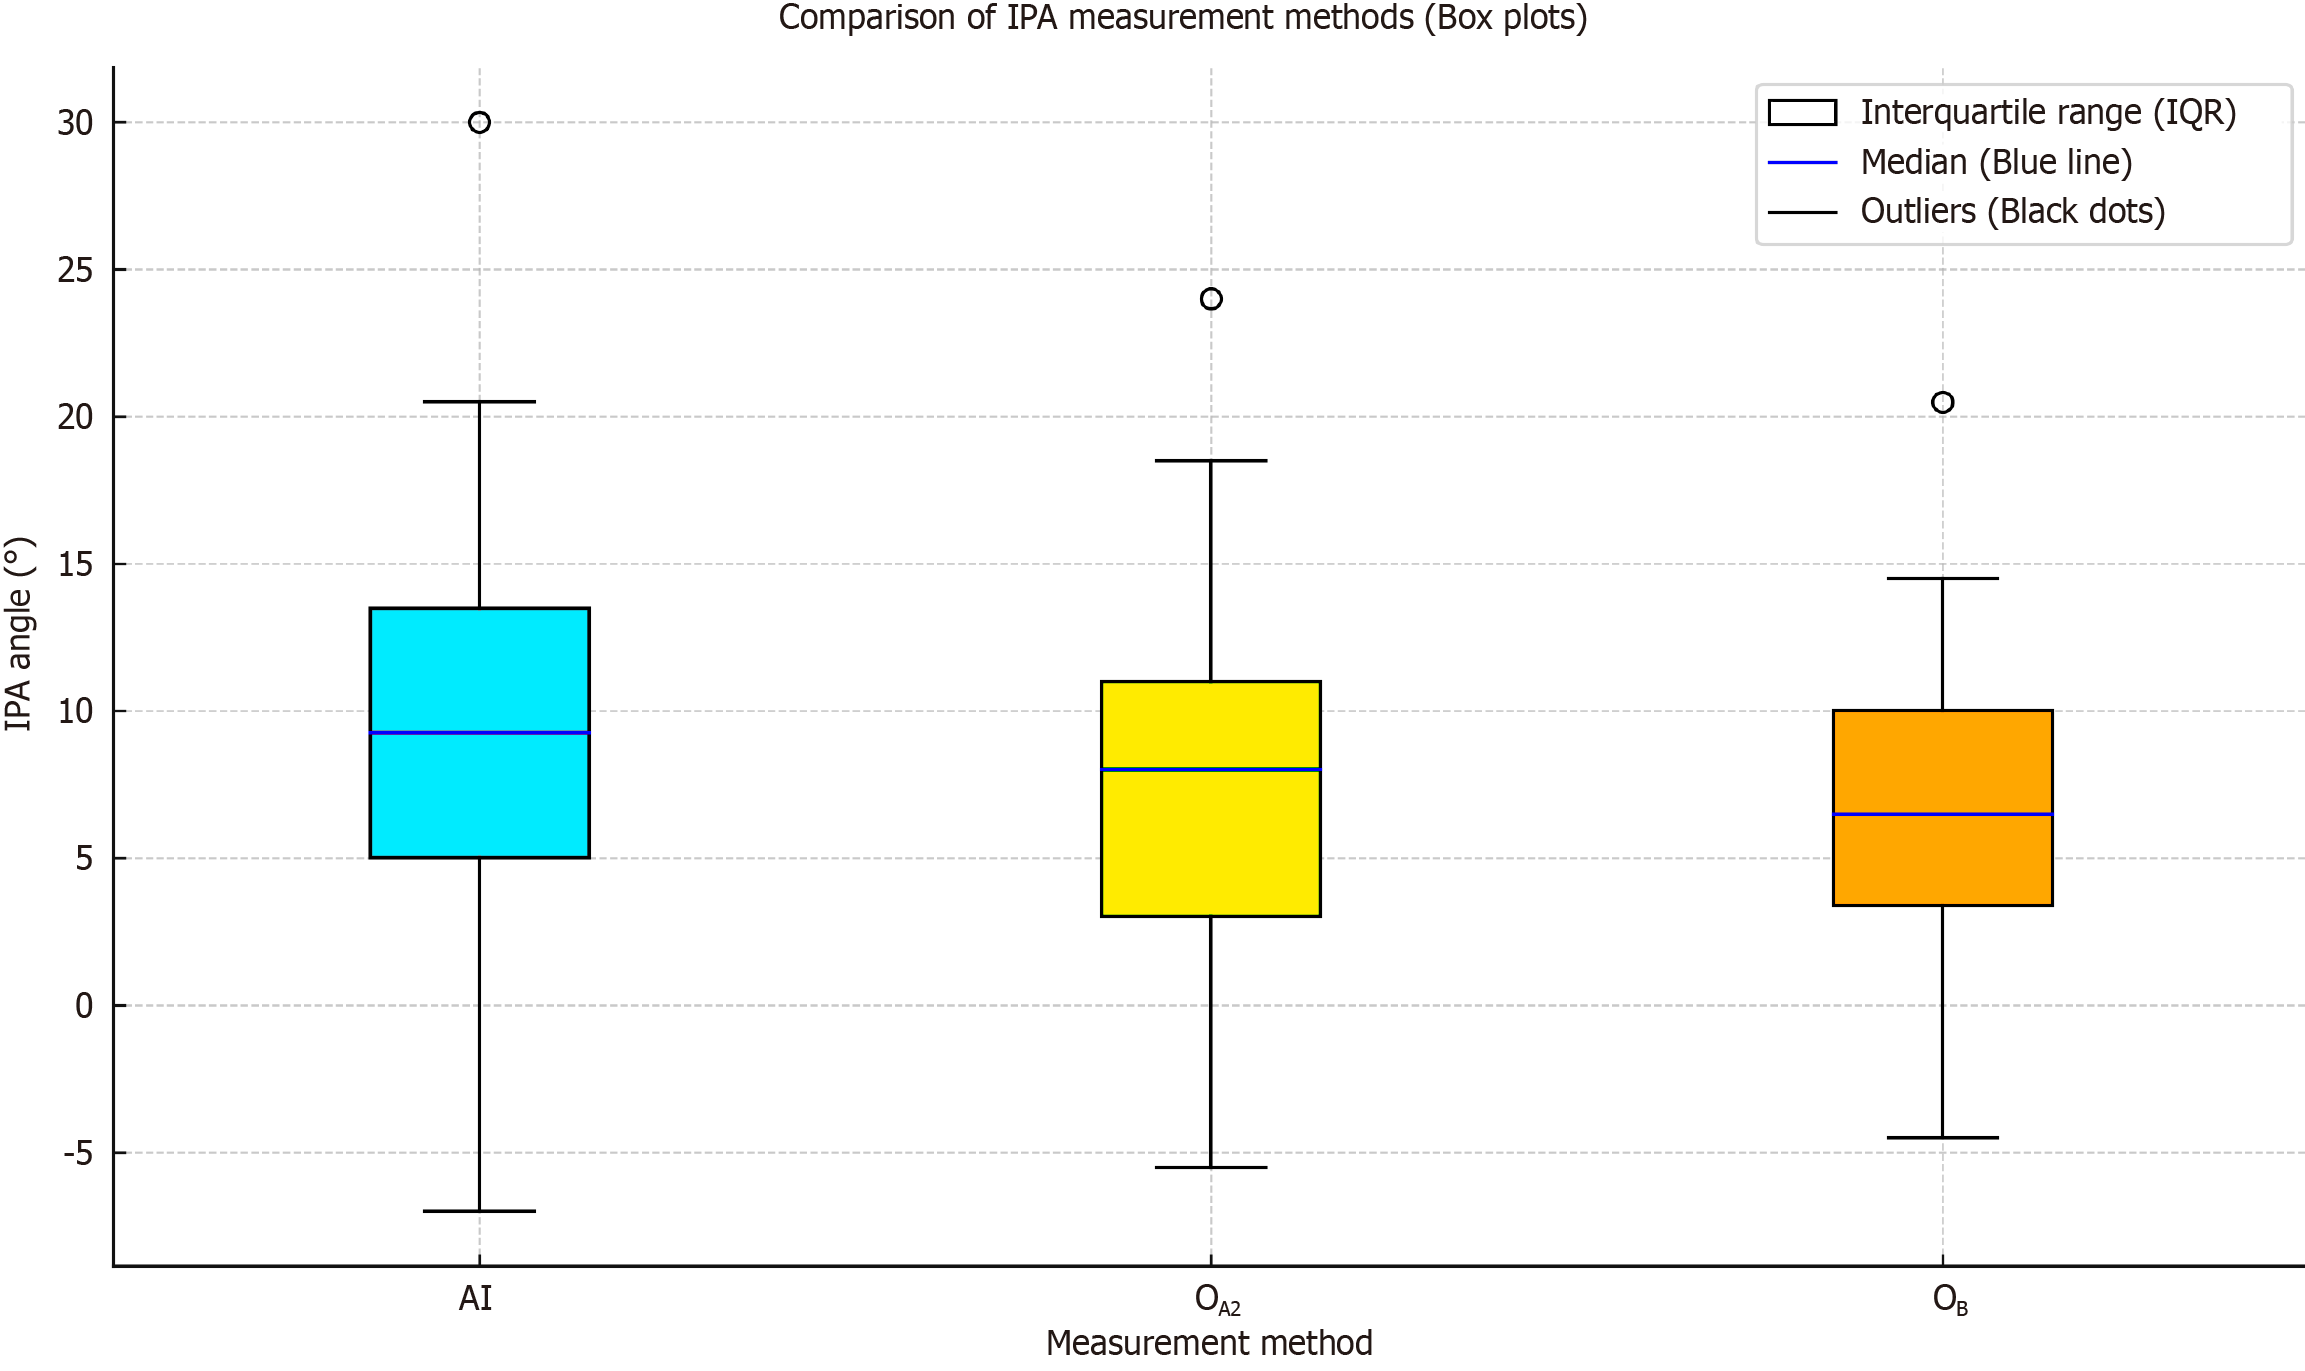
Figure 8 Box plot comparison of artificial intelligence and orthopedist-performed measurements.
This plot visualizes the distribution of interphalangeal angle measurements across different methods. The blue line represents the median, while the boxes indicate the interquartile range. AI: Artificial intelligence; IPA: Interphalangeal angle; IQR: Interquartile range; O: Orthopedic surgeons.
- Citation: Kwolek K, Gądek A, Kwolek K, Lechowska-Liszka A, Malczak M, Liszka H. Artificial intelligence-based diagnosis of hallux valgus interphalangeus using anteroposterior foot radiographs. World J Orthop 2025; 16(6): 103832
- URL: https://www.wjgnet.com/2218-5836/full/v16/i6/103832.htm
- DOI: https://dx.doi.org/10.5312/wjo.v16.i6.103832


