Copyright
©The Author(s) 2025.
World J Orthop. Jun 18, 2025; 16(6): 103832
Published online Jun 18, 2025. doi: 10.5312/wjo.v16.i6.103832
Published online Jun 18, 2025. doi: 10.5312/wjo.v16.i6.103832
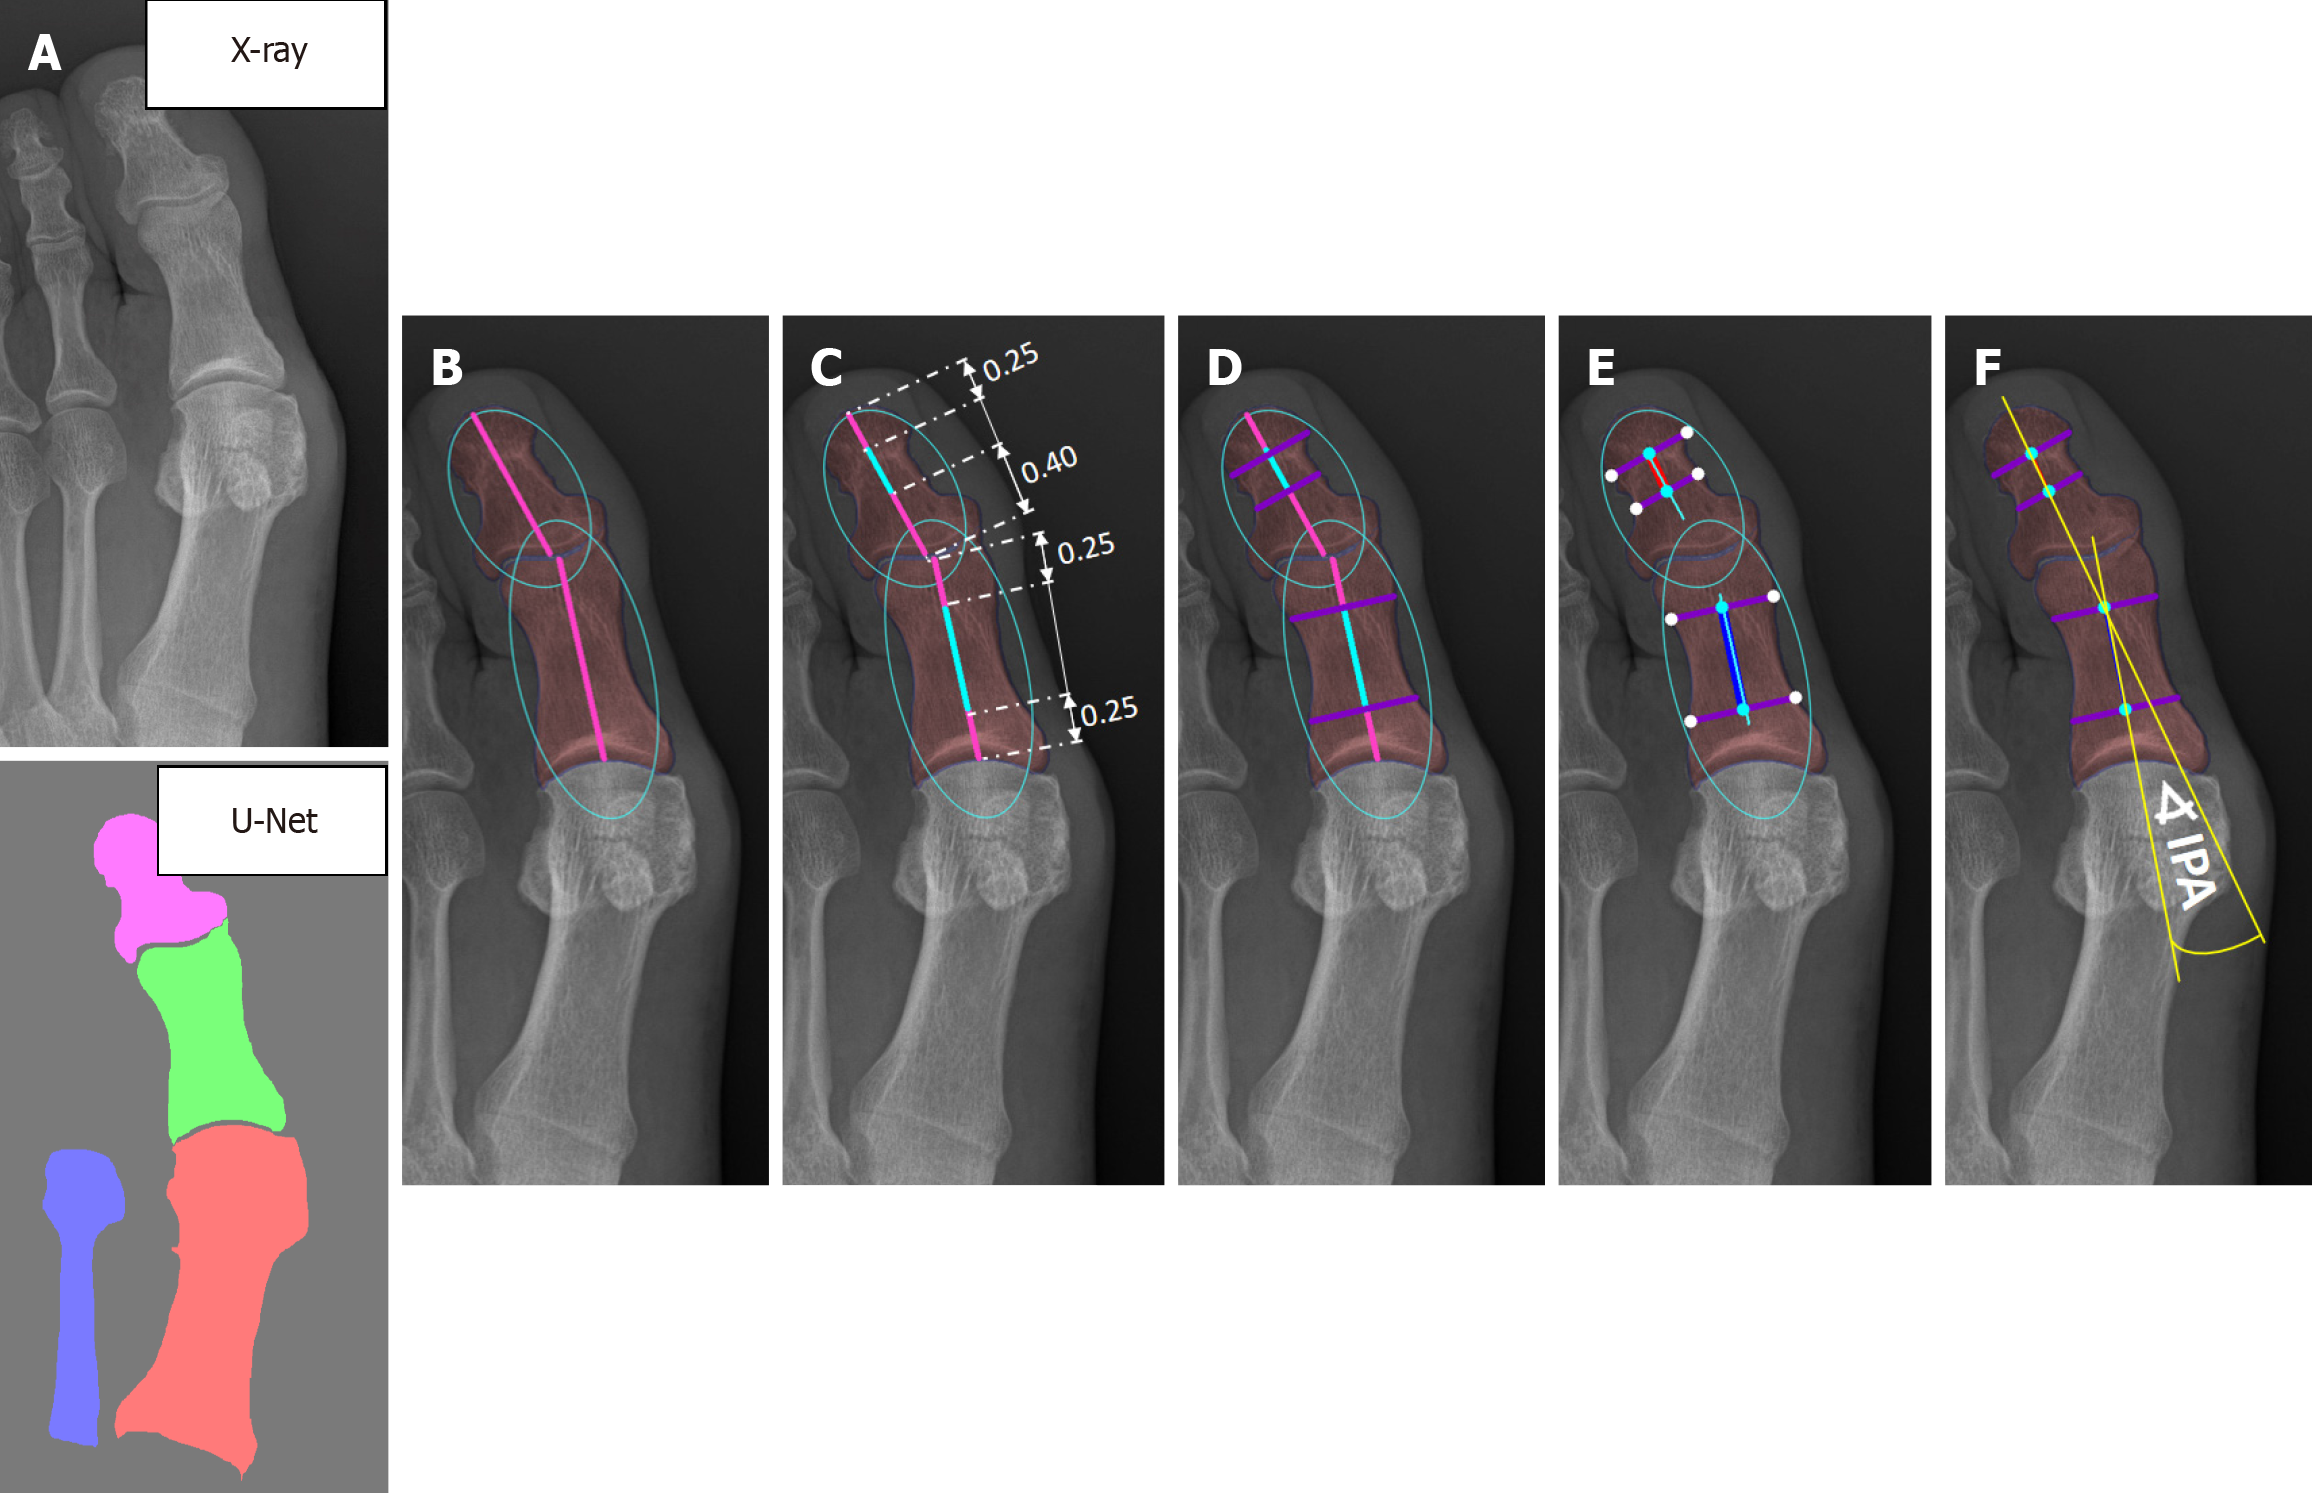
Figure 4 Automated determination of proximal and distal phalanx bone axes.
A: Input X-ray and post-processed bone segmentation results; B: The bones are approximated using ellipses, from which the ellipse axes are extracted. The axes within the bones are indicated by pink lines, with their proportions determined experimentally: (1) 0.25: 0.25 for the proximal phalanx; and (2) 0.40: 0.25 for the distal phalanx; C: The central points of the ellipse subaxes are represented by light blue lines; D: Lines perpendicular to the ellipse subaxes are drawn at their endpoints and illustrated in purple; E: The midpoints of these purple lines are marked with light blue dots, serving as key points for defining the bone axis, which is depicted as blue and red lines; F: The final axes, shown as yellow lines, for interphalangeal angle estimation are computed as a weighted average of the ellipse axis and the bone axis. IPA: Interphalangeal angle.
- Citation: Kwolek K, Gądek A, Kwolek K, Lechowska-Liszka A, Malczak M, Liszka H. Artificial intelligence-based diagnosis of hallux valgus interphalangeus using anteroposterior foot radiographs. World J Orthop 2025; 16(6): 103832
- URL: https://www.wjgnet.com/2218-5836/full/v16/i6/103832.htm
- DOI: https://dx.doi.org/10.5312/wjo.v16.i6.103832


