Copyright
©The Author(s) 2025.
World J Orthop. Jun 18, 2025; 16(6): 103832
Published online Jun 18, 2025. doi: 10.5312/wjo.v16.i6.103832
Published online Jun 18, 2025. doi: 10.5312/wjo.v16.i6.103832
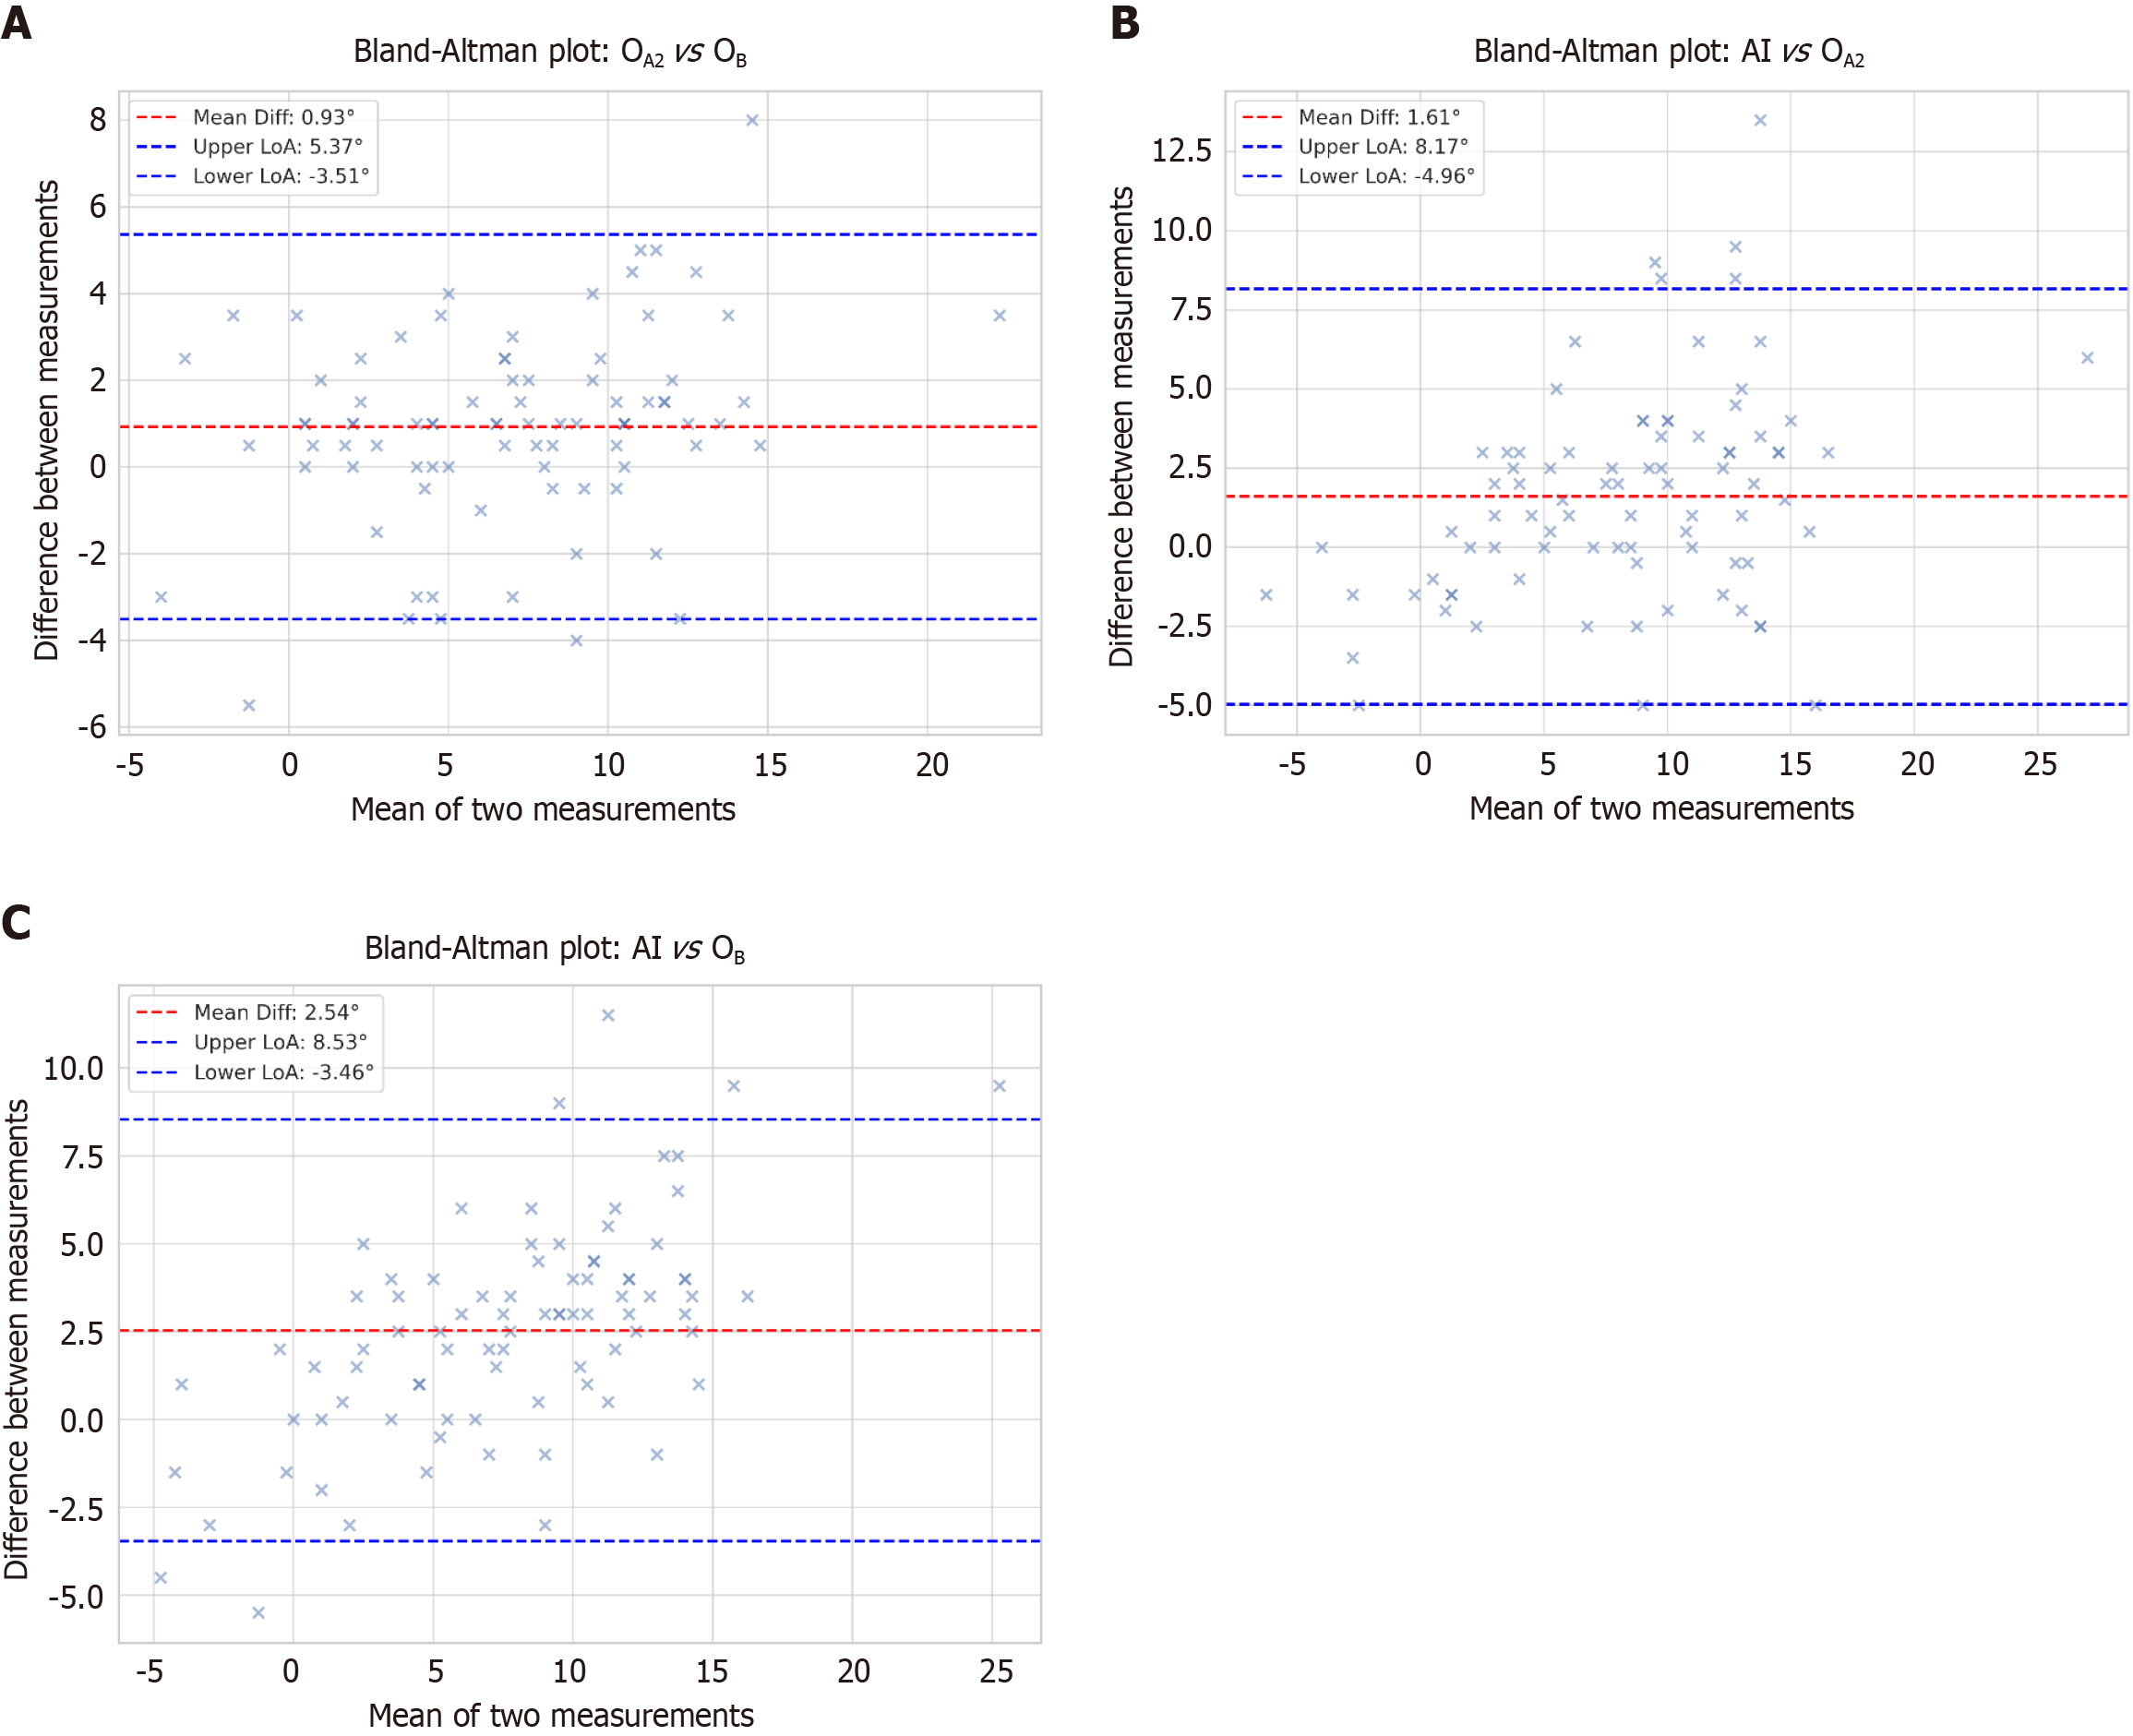
Figure 5 Bland-Altman plots.
A: Agreement between the first and second manual measurements (OA2vs OB); B: Comparison between the artificial intelligence (AI)-generated measurements and the manual measurement of the first orthopedist (AI vs OA2); C: Comparison between the AI-generated measurements and the manual measurement of the second orthopedist (AI vs OB). The plot indicates the mean difference (bias) and limits of agreement, helping to assess systematic differences and consistency between repeated manual measurements. AI: Artificial intelligence; LoA: Limits of agreement; O: Orthopedic surgeons.
- Citation: Kwolek K, Gądek A, Kwolek K, Lechowska-Liszka A, Malczak M, Liszka H. Artificial intelligence-based diagnosis of hallux valgus interphalangeus using anteroposterior foot radiographs. World J Orthop 2025; 16(6): 103832
- URL: https://www.wjgnet.com/2218-5836/full/v16/i6/103832.htm
- DOI: https://dx.doi.org/10.5312/wjo.v16.i6.103832


