Copyright
©The Author(s) 2025.
World J Orthop. Jun 18, 2025; 16(6): 103832
Published online Jun 18, 2025. doi: 10.5312/wjo.v16.i6.103832
Published online Jun 18, 2025. doi: 10.5312/wjo.v16.i6.103832
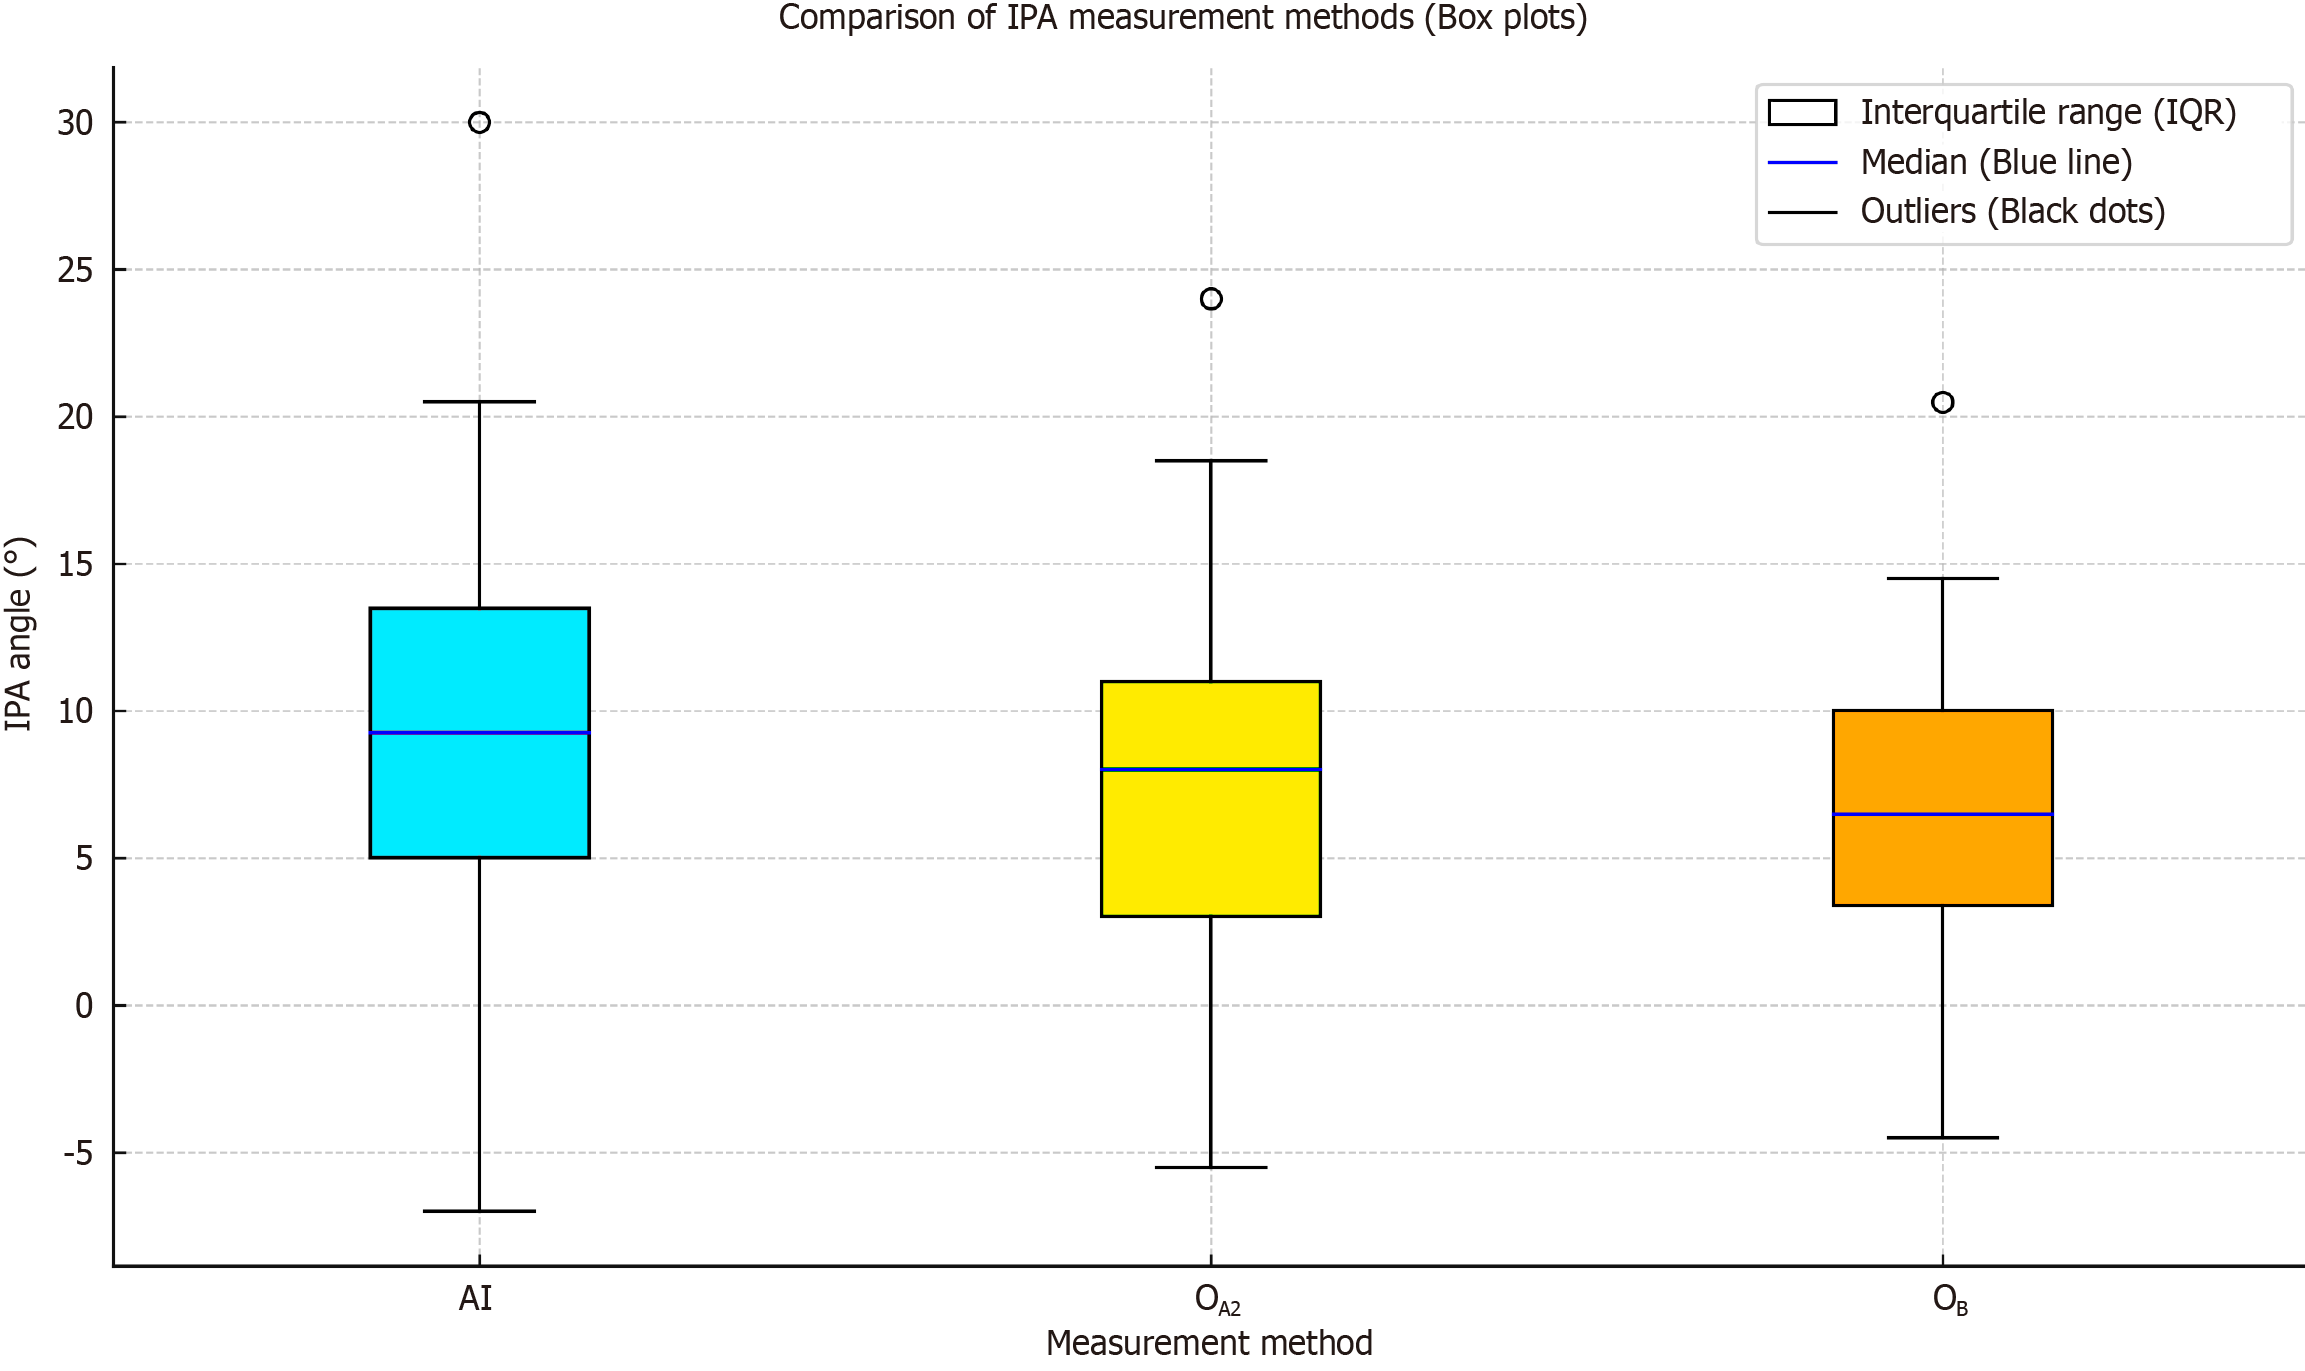
Figure 8 Box plot comparison of artificial intelligence and orthopedist-performed measurements.
This plot visualizes the distribution of interphalangeal angle measurements across different methods. The blue line represents the median, while the boxes indicate the interquartile range. AI: Artificial intelligence; IPA: Interphalangeal angle; IQR: Interquartile range; O: Orthopedic surgeons.
- Citation: Kwolek K, Gądek A, Kwolek K, Lechowska-Liszka A, Malczak M, Liszka H. Artificial intelligence-based diagnosis of hallux valgus interphalangeus using anteroposterior foot radiographs. World J Orthop 2025; 16(6): 103832
- URL: https://www.wjgnet.com/2218-5836/full/v16/i6/103832.htm
- DOI: https://dx.doi.org/10.5312/wjo.v16.i6.103832


