Copyright
©The Author(s) 2015.
World J Radiol. Nov 28, 2015; 7(11): 394-404
Published online Nov 28, 2015. doi: 10.4329/wjr.v7.i11.394
Published online Nov 28, 2015. doi: 10.4329/wjr.v7.i11.394
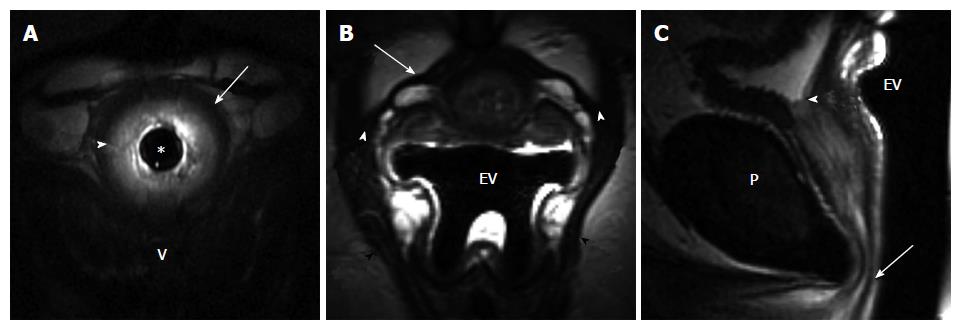
Figure 1 41-year-old woman post one vaginal delivery with episiotomy, body mass index: 46.
7, with occasional stress urinary incontinence. A: Axial T2-weighted image of the mid urethra obtained with 14F endourethral MR coil (TR/TE 4816/68 ms) shows detailed depiction of the urethral sphincter with a hypointense outer layer of striated muscle (arrow) and inner hyperintense smooth muscle layer (arrowhead); B: Axial T2-weighted image at the mid urethra level obtained with endovaginal placement of MRInnervu coil (EV) (TR/TE 3000/92 ms) shows well-defined intact periurethral ligament (arrow) extending between the right and left puborectalis muscle (black arrowheads). Note symmetric, intact ligament attachment (white arrowheads); C: Sagittal T2-weighted image obtained with endovaginal placement of MRInnervu coil (EV) (TR/TE 4000/92 ms) shows normal resting position of the urethra, with distal end of urethral sphincter (arrow) at inferior pubis level (P). Note excellent coaptation of the mucosa at internal meatus/bladder neck level (arrowhead). V: Vagina.
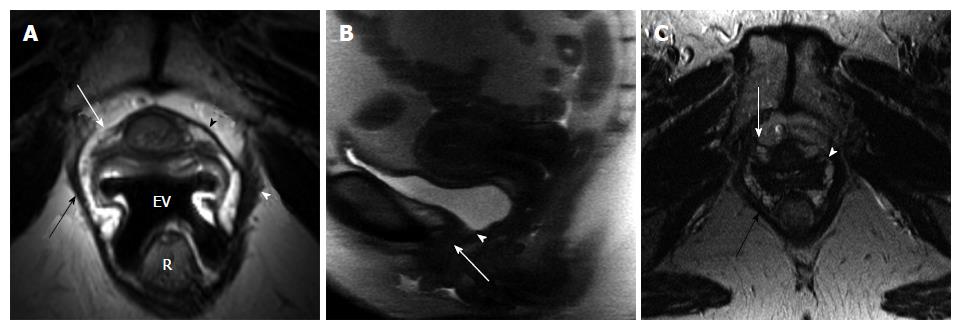
Figure 2 51-year-old woman post two uneventful vaginal deliveries, body mass index: 24.
3. A: Axial oblique T2-weighted image at the mid urethra level (at 50% length from the internal meatus, about 1.2 cm), perpendicular to the axis of urethra, obtained with endovaginal placement of MRInnervu coil (EV) (TR/TE 3200/93 ms) shows disrupted attenuated right periurethral ligament (white arrow). Note intact left side of the periurethral ligament (black arrowhead) and its attachment to the puborectalis muscle (white arrowhead). Minimal asymmetric thinning of the right puborectalis muscle (black arrow); B: Sagittal SSFSE image (TR/TE 15000/78 ms) during strain shows hypermobility of the urethra (arrow). Note closure of bladder neck (arrowhead) during the urethral descent; C: Axial T2-weighted image of the pelvis at the level of mid urethra (at 50% from the internal meatus) obtained with pelvic coil (TR/TE 4666/85 ms) shows much less detail of the periurethral ligament compared to endovaginal MRI in A. It is difficult to appreciate the status of the ligament itself (white arrow) or its attachment (white arrowhead). Puborectalis muscle (black arrow) is well visualized. R: Rectum.
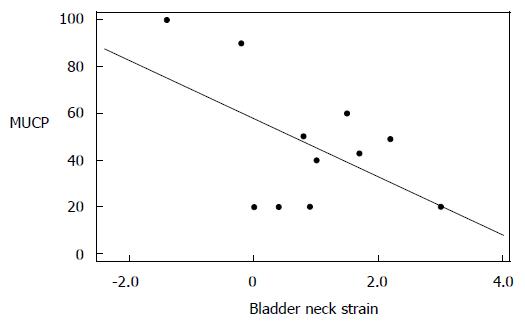
Figure 3 Scatter plot of maximum urethral closure pressure (cm H20) and bladder neck strain (distance in cm, traveled between position at rest and maximal strain) with fitted regression line (Pearson’s correlation coefficient -0.
537, P = 0.089). MUCP: Maximum urethral closure pressure.
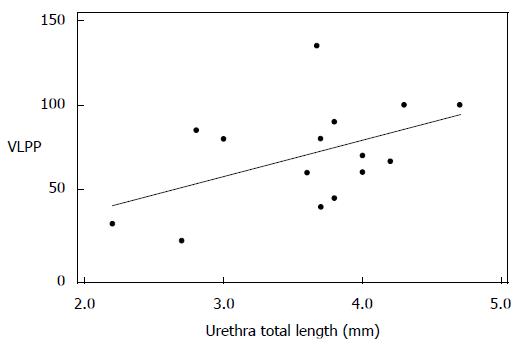
Figure 4 Scatter plot of valsalva leak point pressure (cm H2O) and total urethra sphincter length (mm) with fitted regression line (Person’s correlation coefficient 0.
478, P = 0.072).
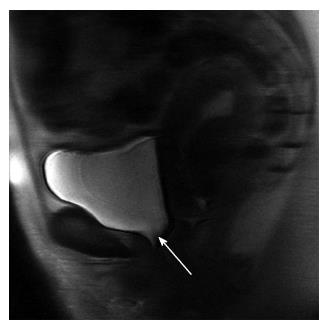
Figure 5 48-year-old woman post four vaginal deliveries, body mass index: 24.
4. Sagittal SSFSE image (TR/TE 15000/78 ms) during strain shows funneling at the bladder neck level (arrow).
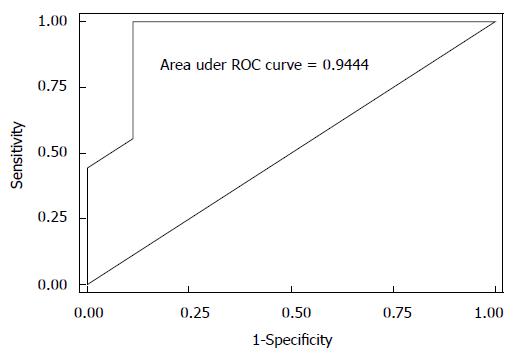
Figure 6 Receiver operating characteristic curve for the logistic model of urodynamics diagnosis regressed on bladder neck funneling and suprapubic urethral sphincter length.
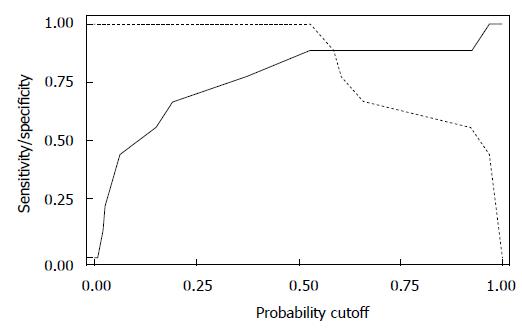
Figure 7 Plot of sensitivity (solid line) and specificity (dashed line) as a function of the probability cut points obtained from the logistic model of urodynamics diagnosis regressed on bladder neck funneling and suprapubic urethral sphincter length.
The optimal probability cutoff point was determined to be 0.52.
- Citation: Macura KJ, Thompson RE, Bluemke DA, Genadry R. Magnetic resonance imaging in assessment of stress urinary incontinence in women: Parameters differentiating urethral hypermobility and intrinsic sphincter deficiency. World J Radiol 2015; 7(11): 394-404
- URL: https://www.wjgnet.com/1949-8470/full/v7/i11/394.htm
- DOI: https://dx.doi.org/10.4329/wjr.v7.i11.394


