Copyright
©The Author(s) 2015.
World J Radiol. Nov 28, 2015; 7(11): 394-404
Published online Nov 28, 2015. doi: 10.4329/wjr.v7.i11.394
Published online Nov 28, 2015. doi: 10.4329/wjr.v7.i11.394
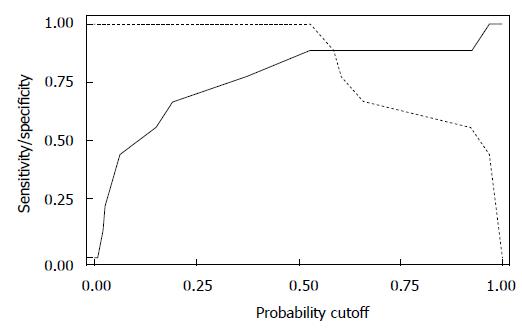
Figure 7 Plot of sensitivity (solid line) and specificity (dashed line) as a function of the probability cut points obtained from the logistic model of urodynamics diagnosis regressed on bladder neck funneling and suprapubic urethral sphincter length.
The optimal probability cutoff point was determined to be 0.52.
- Citation: Macura KJ, Thompson RE, Bluemke DA, Genadry R. Magnetic resonance imaging in assessment of stress urinary incontinence in women: Parameters differentiating urethral hypermobility and intrinsic sphincter deficiency. World J Radiol 2015; 7(11): 394-404
- URL: https://www.wjgnet.com/1949-8470/full/v7/i11/394.htm
- DOI: https://dx.doi.org/10.4329/wjr.v7.i11.394


