Copyright
©The Author(s) 2015.
World J Radiol. Nov 28, 2015; 7(11): 394-404
Published online Nov 28, 2015. doi: 10.4329/wjr.v7.i11.394
Published online Nov 28, 2015. doi: 10.4329/wjr.v7.i11.394
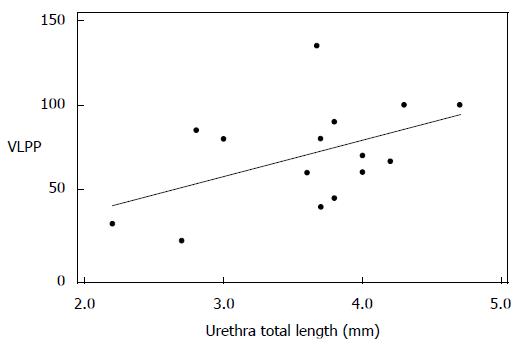
Figure 4 Scatter plot of valsalva leak point pressure (cm H2O) and total urethra sphincter length (mm) with fitted regression line (Person’s correlation coefficient 0.
478, P = 0.072).
- Citation: Macura KJ, Thompson RE, Bluemke DA, Genadry R. Magnetic resonance imaging in assessment of stress urinary incontinence in women: Parameters differentiating urethral hypermobility and intrinsic sphincter deficiency. World J Radiol 2015; 7(11): 394-404
- URL: https://www.wjgnet.com/1949-8470/full/v7/i11/394.htm
- DOI: https://dx.doi.org/10.4329/wjr.v7.i11.394


