
















Copyright: ©Author(s) 2026.
World J Gastrointest Surg. Nov 27, 2026; 18(11): 123786
Published online Nov 27, 2026. doi: 10.4240/wjgs.123786
Published online Nov 27, 2026. doi: 10.4240/wjgs.123786
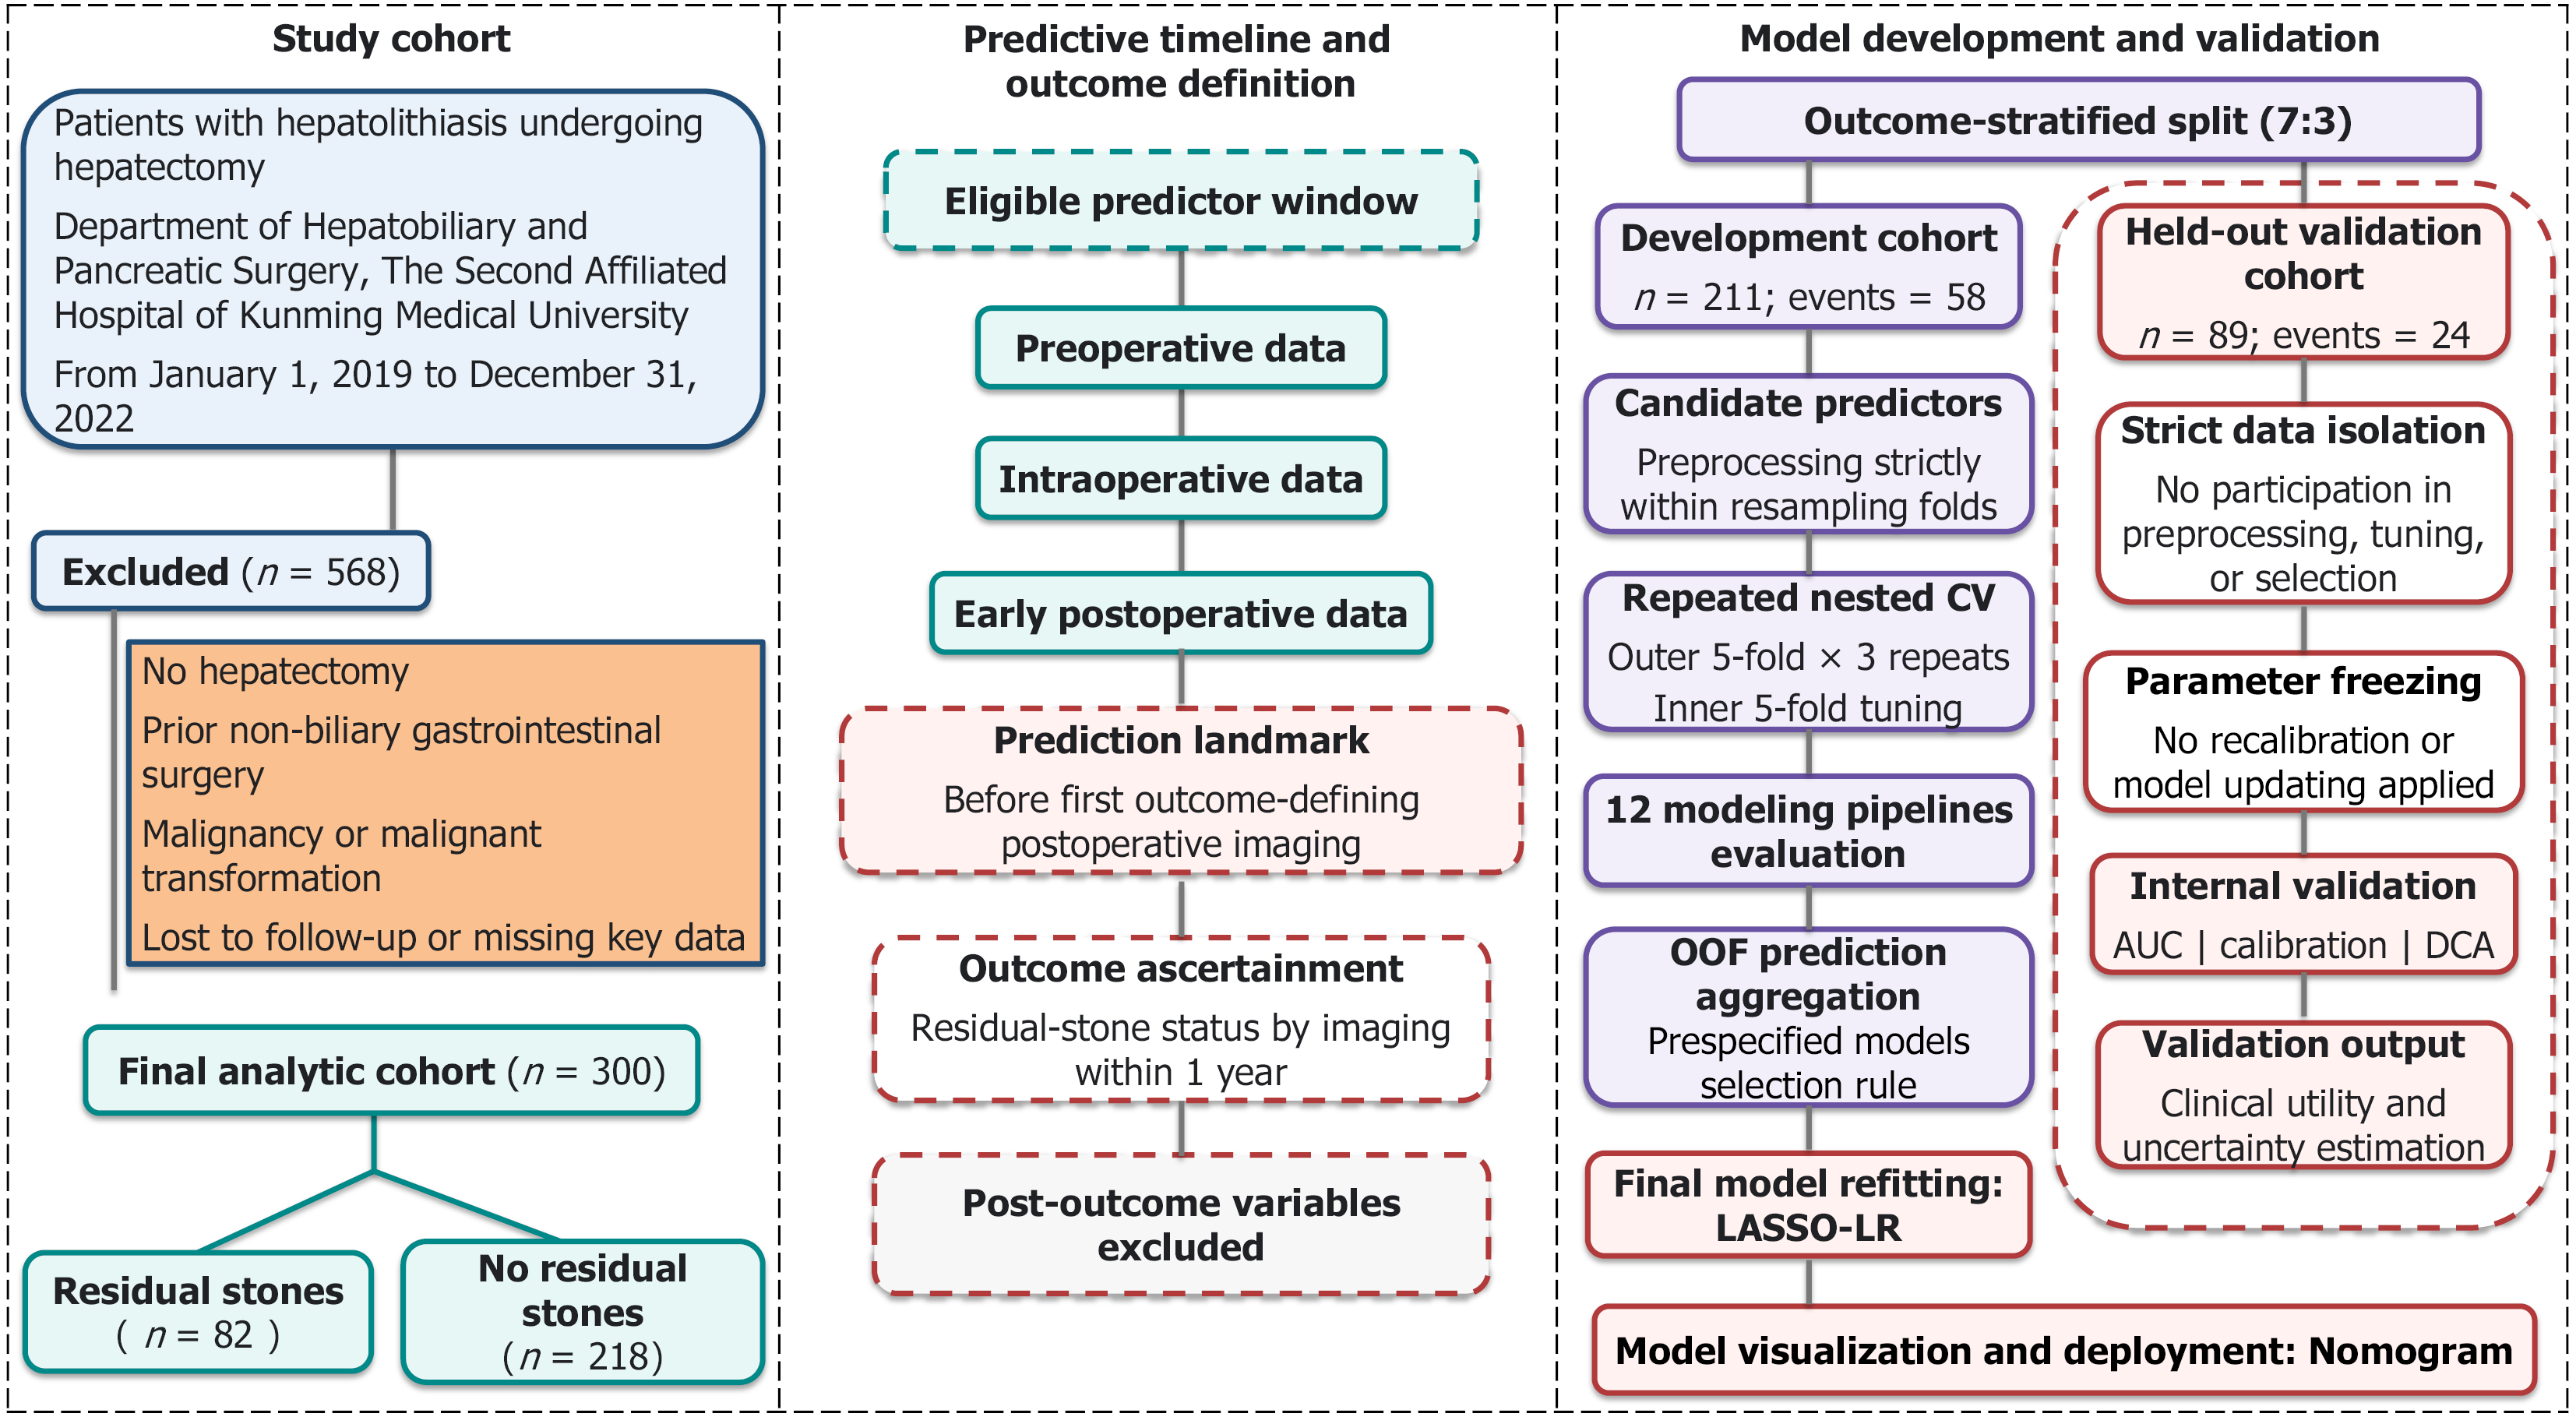
Figure 1 Study population, predictive timeline, and zero-leakage model development workflow.
The flow chart illustrates the selection process for the final analytic cohort (n = 300) from hepatolithiasis patients undergoing hepatectomy. The predictive timeline defines the eligible predictor window prior to the prediction landmark (first postoperative imaging) to prevent look-ahead bias. The methodological framework summarizes the steps for model development and internal validation. An outcome-stratified split (7:3) yielded a development cohort (n = 211; 58 events) and a held-out validation cohort (n = 89; 24 events). Candidate predictors were evaluated across 12 candidate modeling pipelines using repeated nested cross-validation (5-fold × 3 repeats) within the development cohort. The locked least absolute shrinkage and selection operator-logistic regression model was refit on the full development cohort and subsequently evaluated once in the strictly isolated validation cohort. AUC: Area under the receiver operating characteristic curve; CV: Cross-validation; DCA: Decision curve analysis; LASSO-LR: Least absolute shrinkage and selection operator-logistic regression.
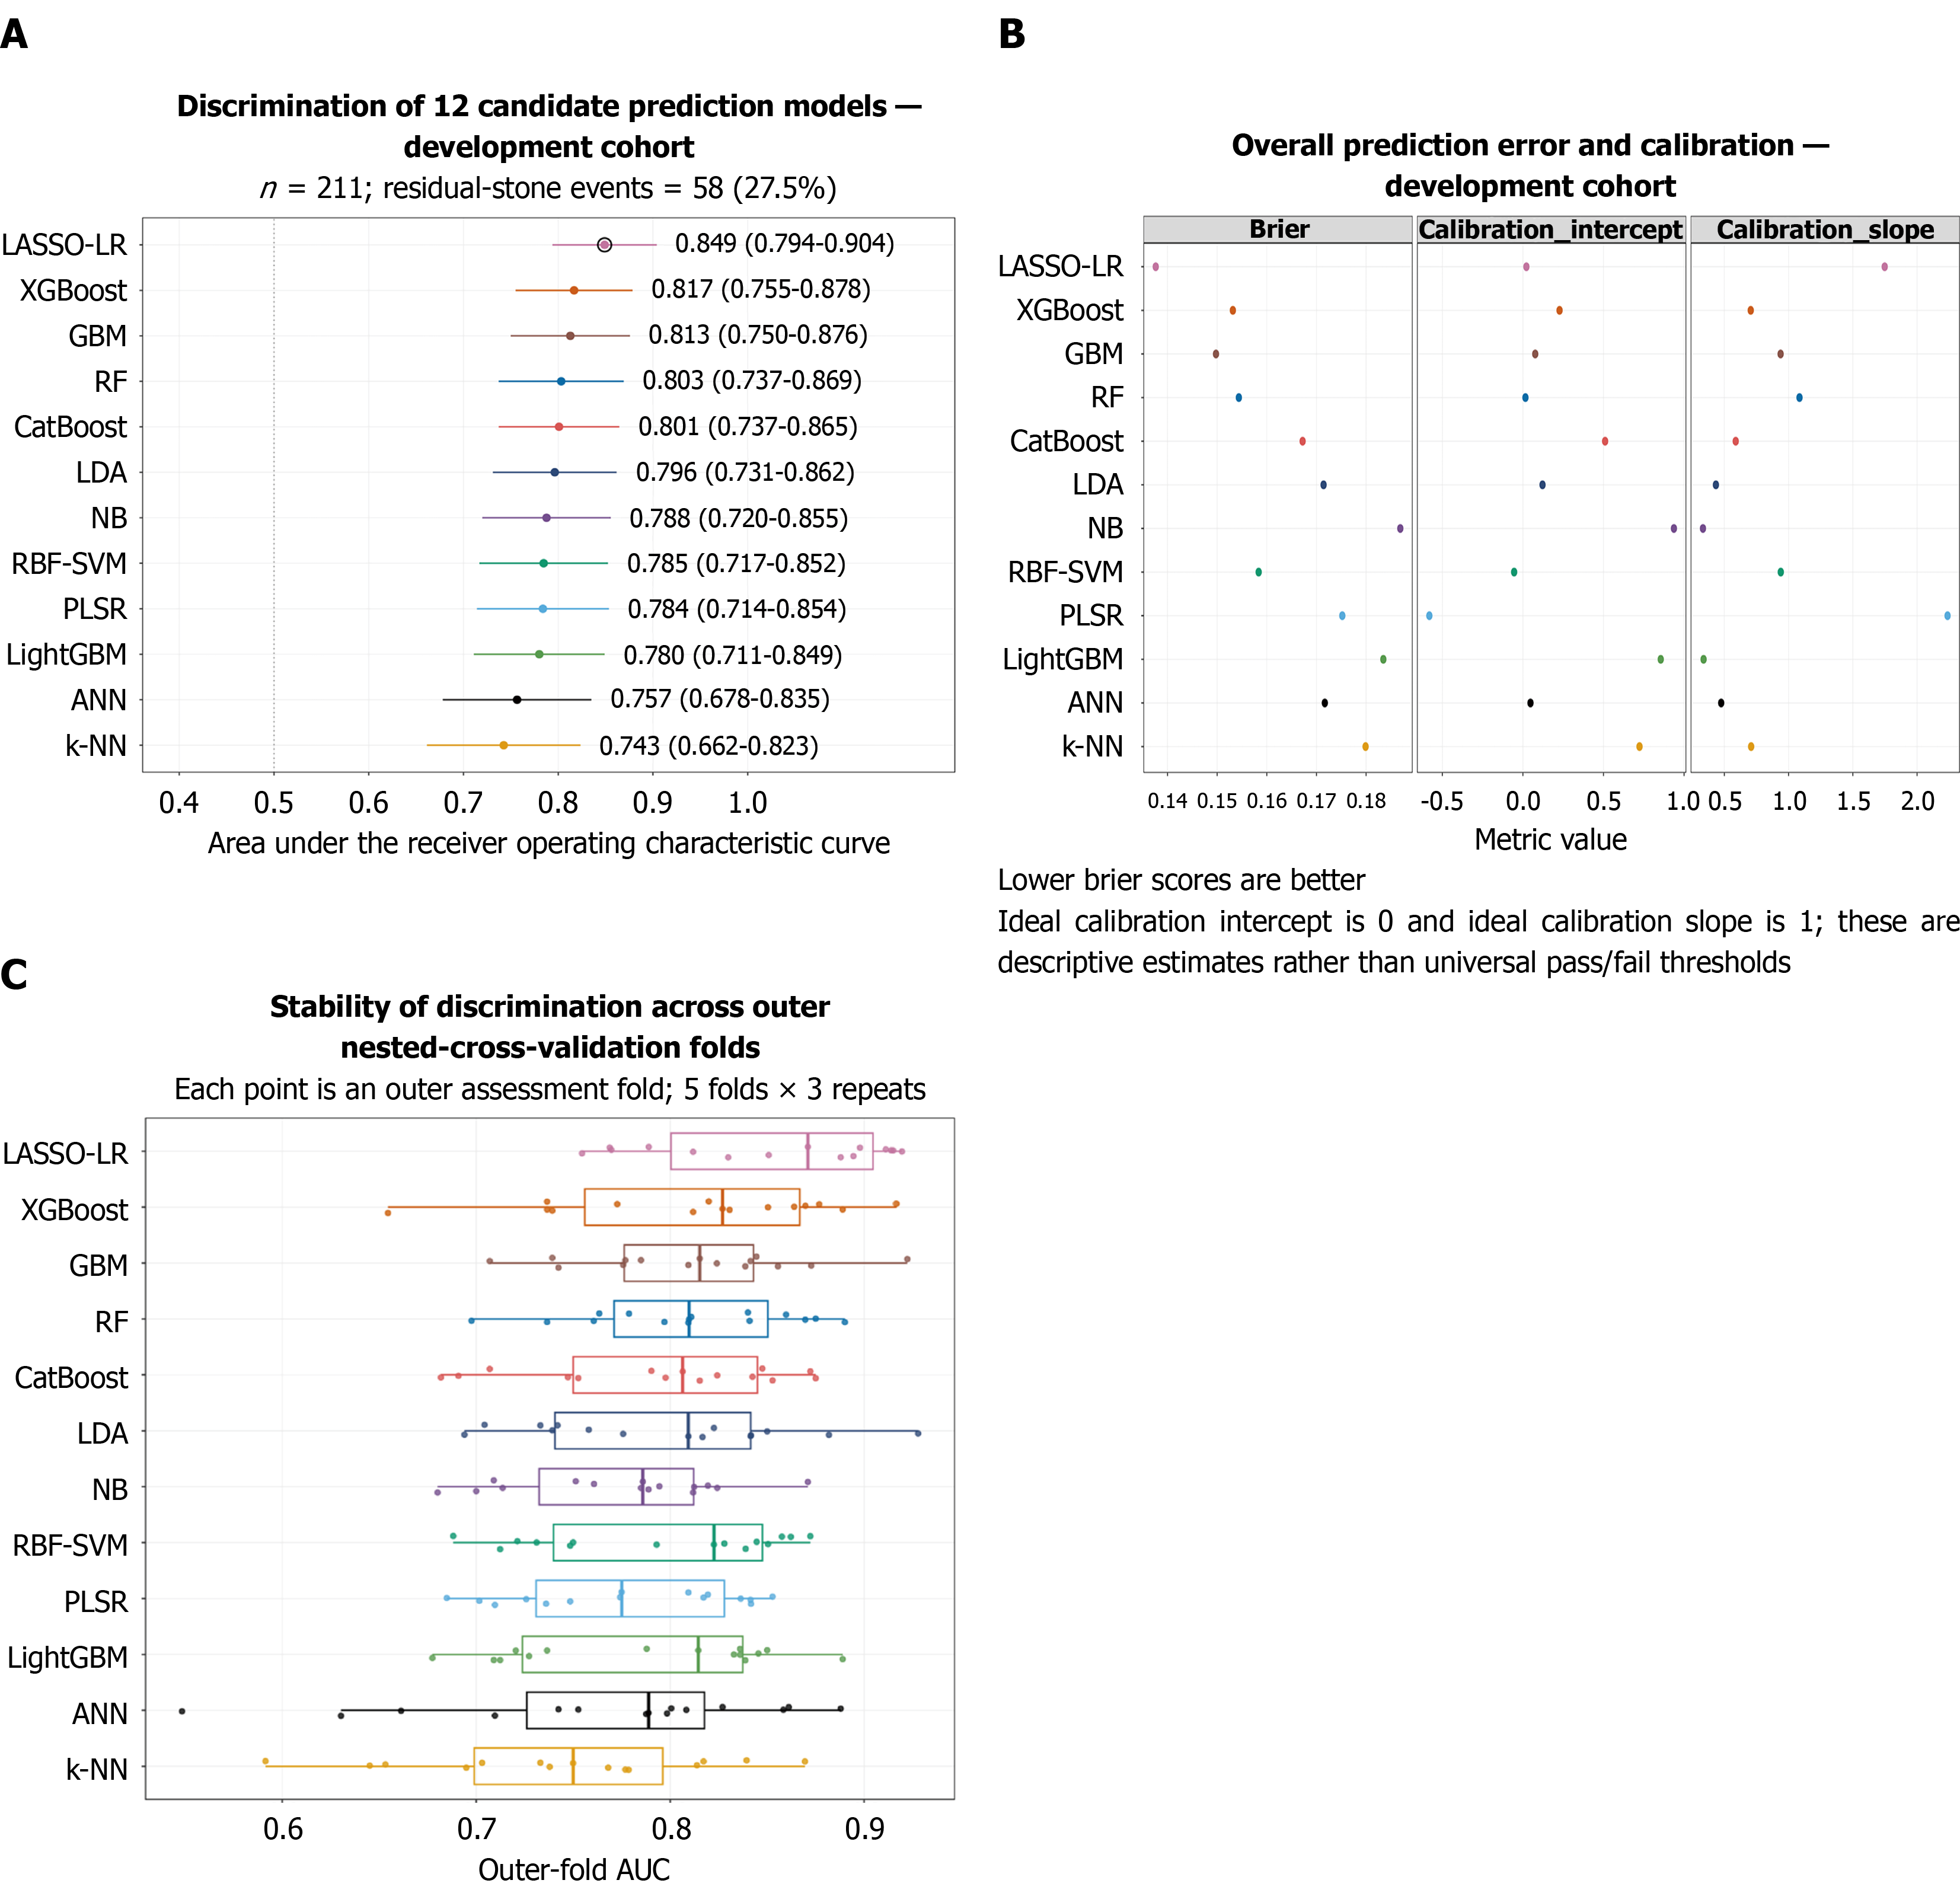
Figure 2 Candidate-model selection within the development cohort.
A: Out-of-fold area under the receiver operating characteristic curve (AUC) distributions for 12 candidate algorithms within the development cohort; B: Prediction error (Brier score and log loss) and calibration metrics across candidate pipelines; C: Outer-fold AUC rank variability during nested cross-validation. The held-out validation cohort remained strictly isolated during model evaluation and pipeline locking. LASSO-LR: Least absolute shrinkage and selection operator-logistic regression; XGBoost: EXtreme Gradient Boosting; GBM: Gradient boosting machine; RF: Random forest; CatBoost: Categorical boosting; LDA: Linear discriminant analysis; NB: Naive Bayes; RBF-SVM: Support vector machine with radial basis function kernel; PLSR: Partial least squares regression; LightGBM: Light gradient boosting machine; ANN: Artificial neural network; k-NN: K-nearest neighbors; AUC: Area under the receiver operating characteristic curve.
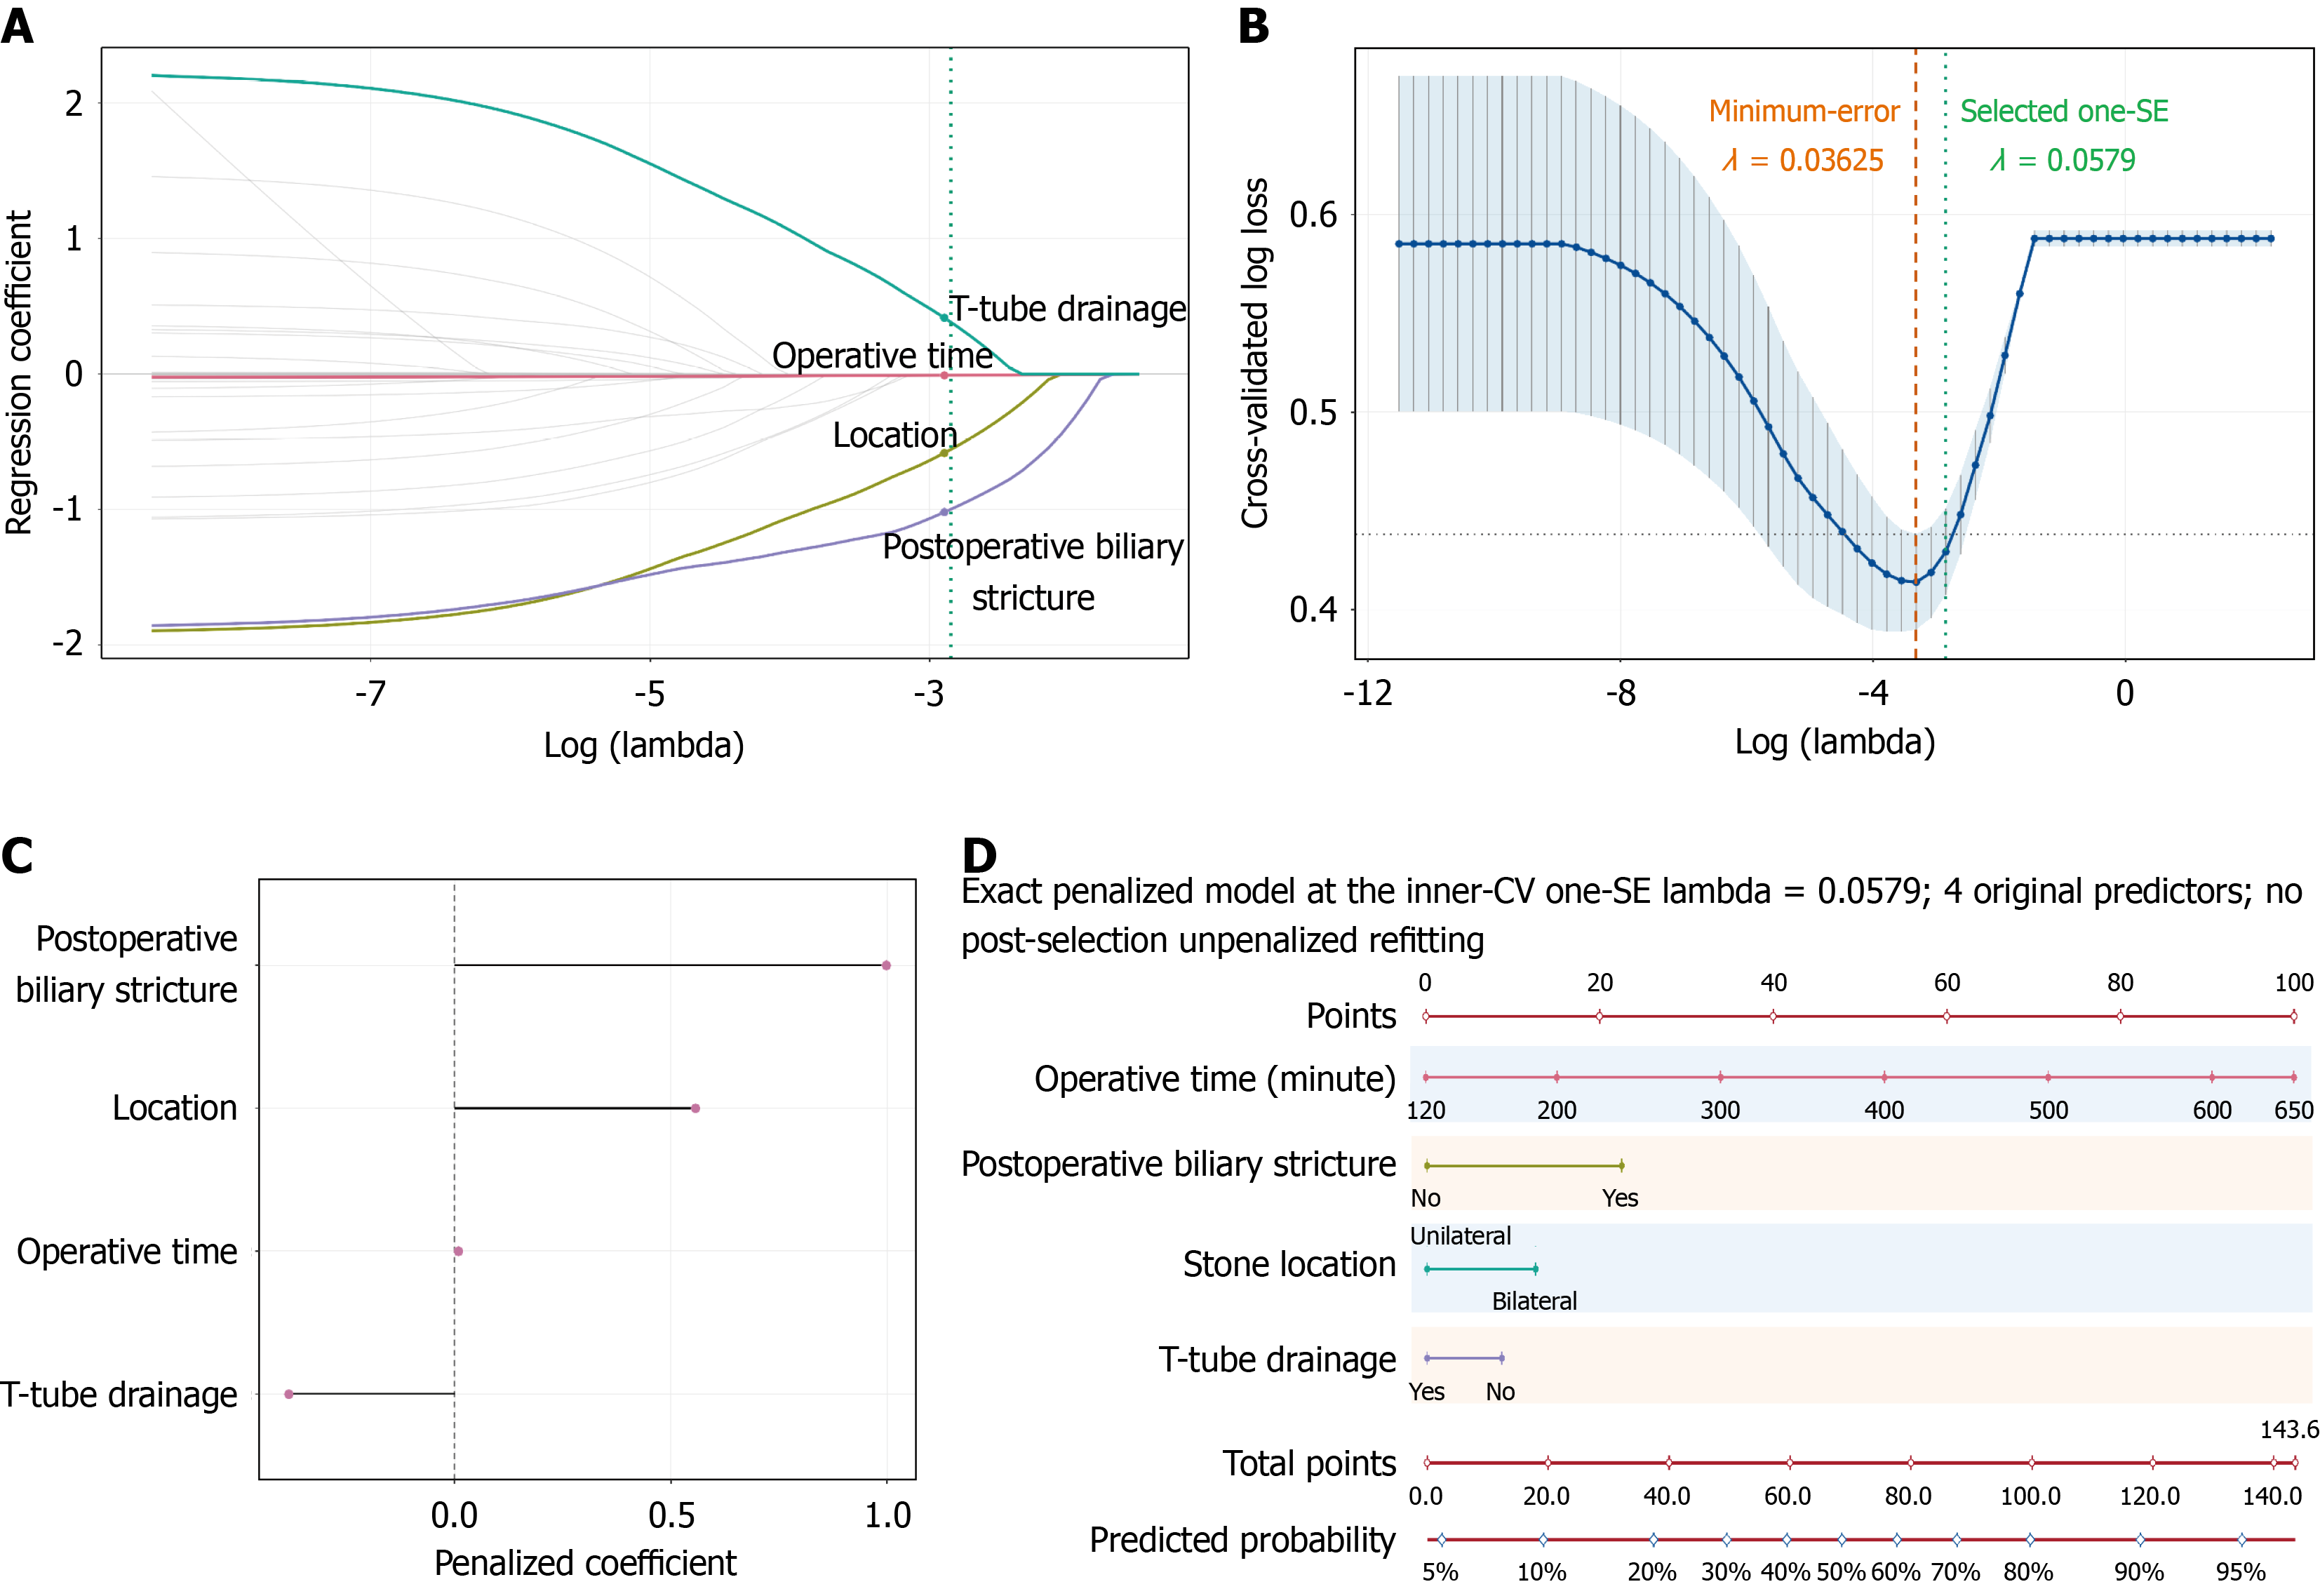
Figure 3 Selection, specification, and clinical presentation of the final least absolute shrinkage and selection operator-logistic regression model.
A: Coefficient profiles of candidate predictors across the log (λ) penalty path. The vertical green line indicates the selected 1-SE parameter (λ = 0.0579); B: Cross-validated log loss vs log (λ), contrasting the minimum-error (lambda = 0.03625; orange) and the selected 1-SE (λ = 0.0579; green) thresholds; C: Exact non-zero penalized coefficients for retained predictors: Postoperative biliary stricture, bilateral stone location, prolonged operative time (positive coefficients), and T-tube drainage (negative coefficient); D: Nomogram derived directly from the locked penalized model, mapping individual predictor values to total points and predicted residual-stone probability without unpenalized refitting. CV: Cross-validation.
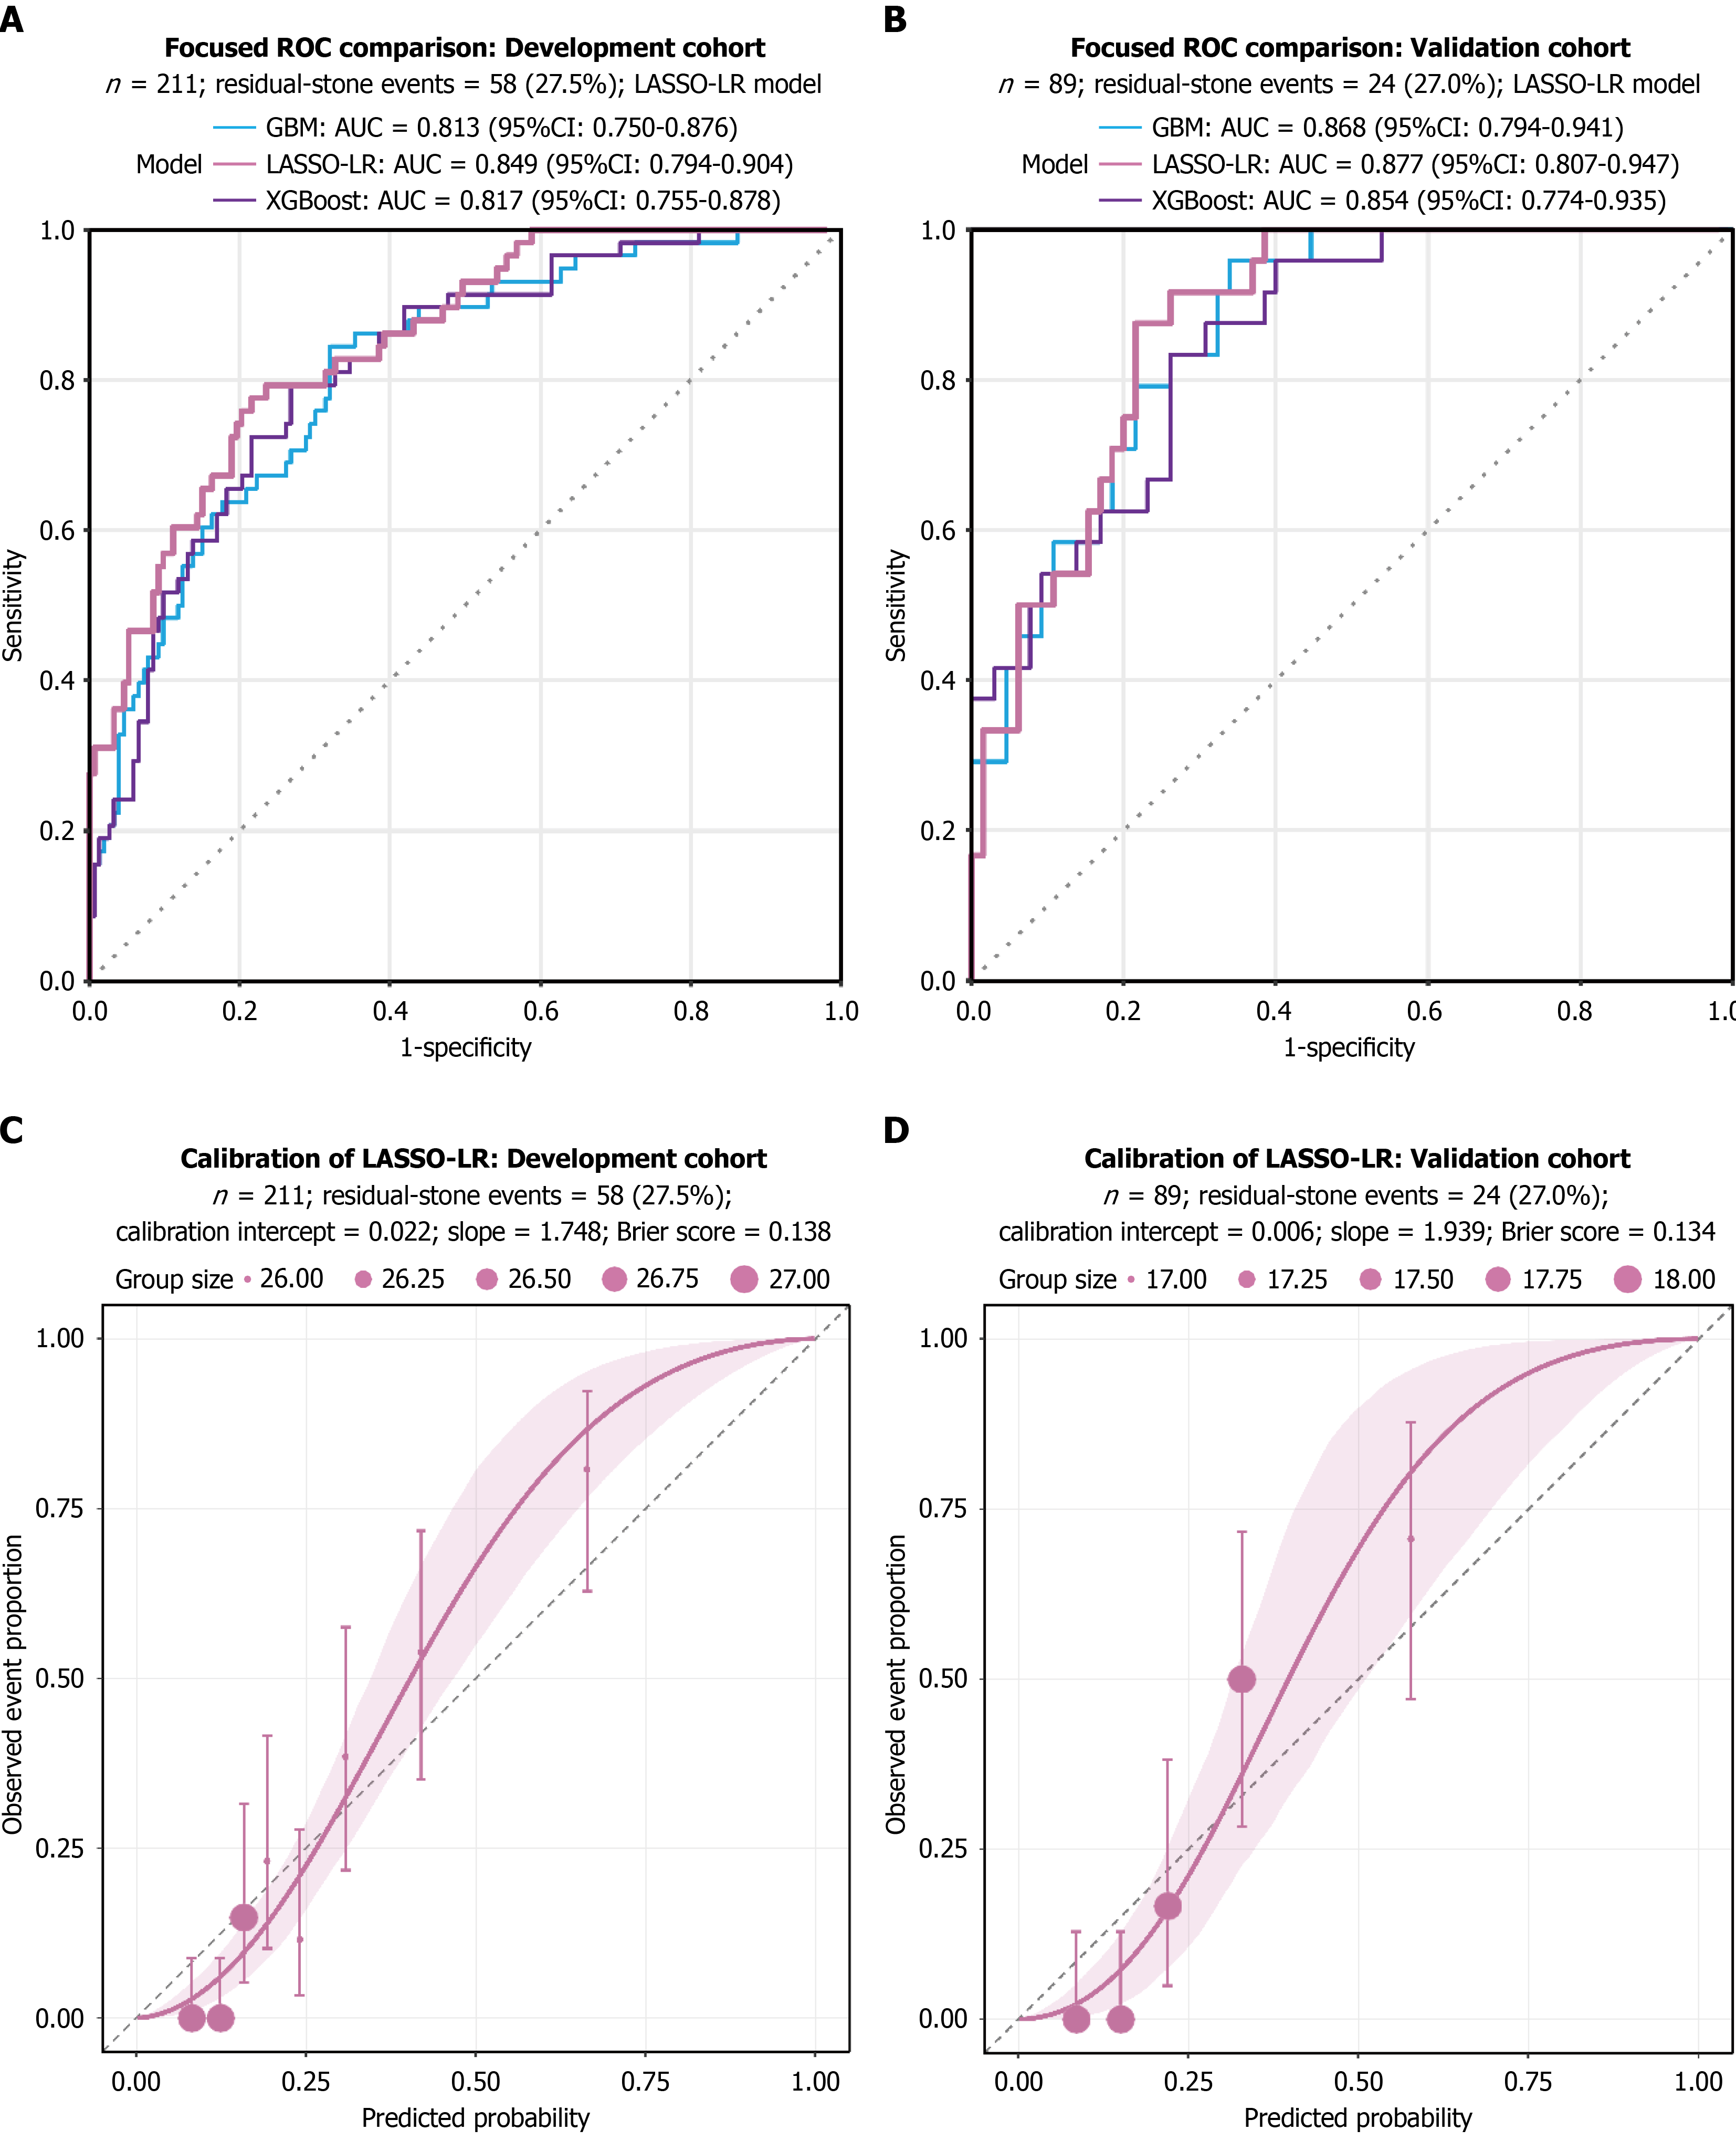
Figure 4 Discriminative performance and calibration curves of the least absolute shrinkage and selection operator-logistic regression model.
A: Receiver operating characteristic curves in the development cohort evaluated via out-of-fold (OOF) cross-validation; B: Receiver operating characteristic curves in the independent held-out validation cohort (n = 89). Shaded regions represent 95% confidence intervals (CIs) for the least absolute shrinkage and selection operator-logistic regression model, with comparator models (gradient boosting machine, eXtreme Gradient Boosting, and support vector machine with radial basis function kernel) shown for reference; C: Calibration plot in the development cohort based on OOF predictions; D: Calibration plot in the held-out validation cohort. The dashed 45-degree line represents perfect calibration. Solid colored lines and scatter points indicate observed vs predicted residual stone probabilities with bootstrap-derived 95%CIs. LASSO-LR: Least absolute shrinkage and selection operator-logistic regression; ROC: Receiver operating characteristic; XGBoost: EXtreme Gradient Boosting; GBM: Gradient boosting machine; AUC: Area under the receiver operating characteristic curve.
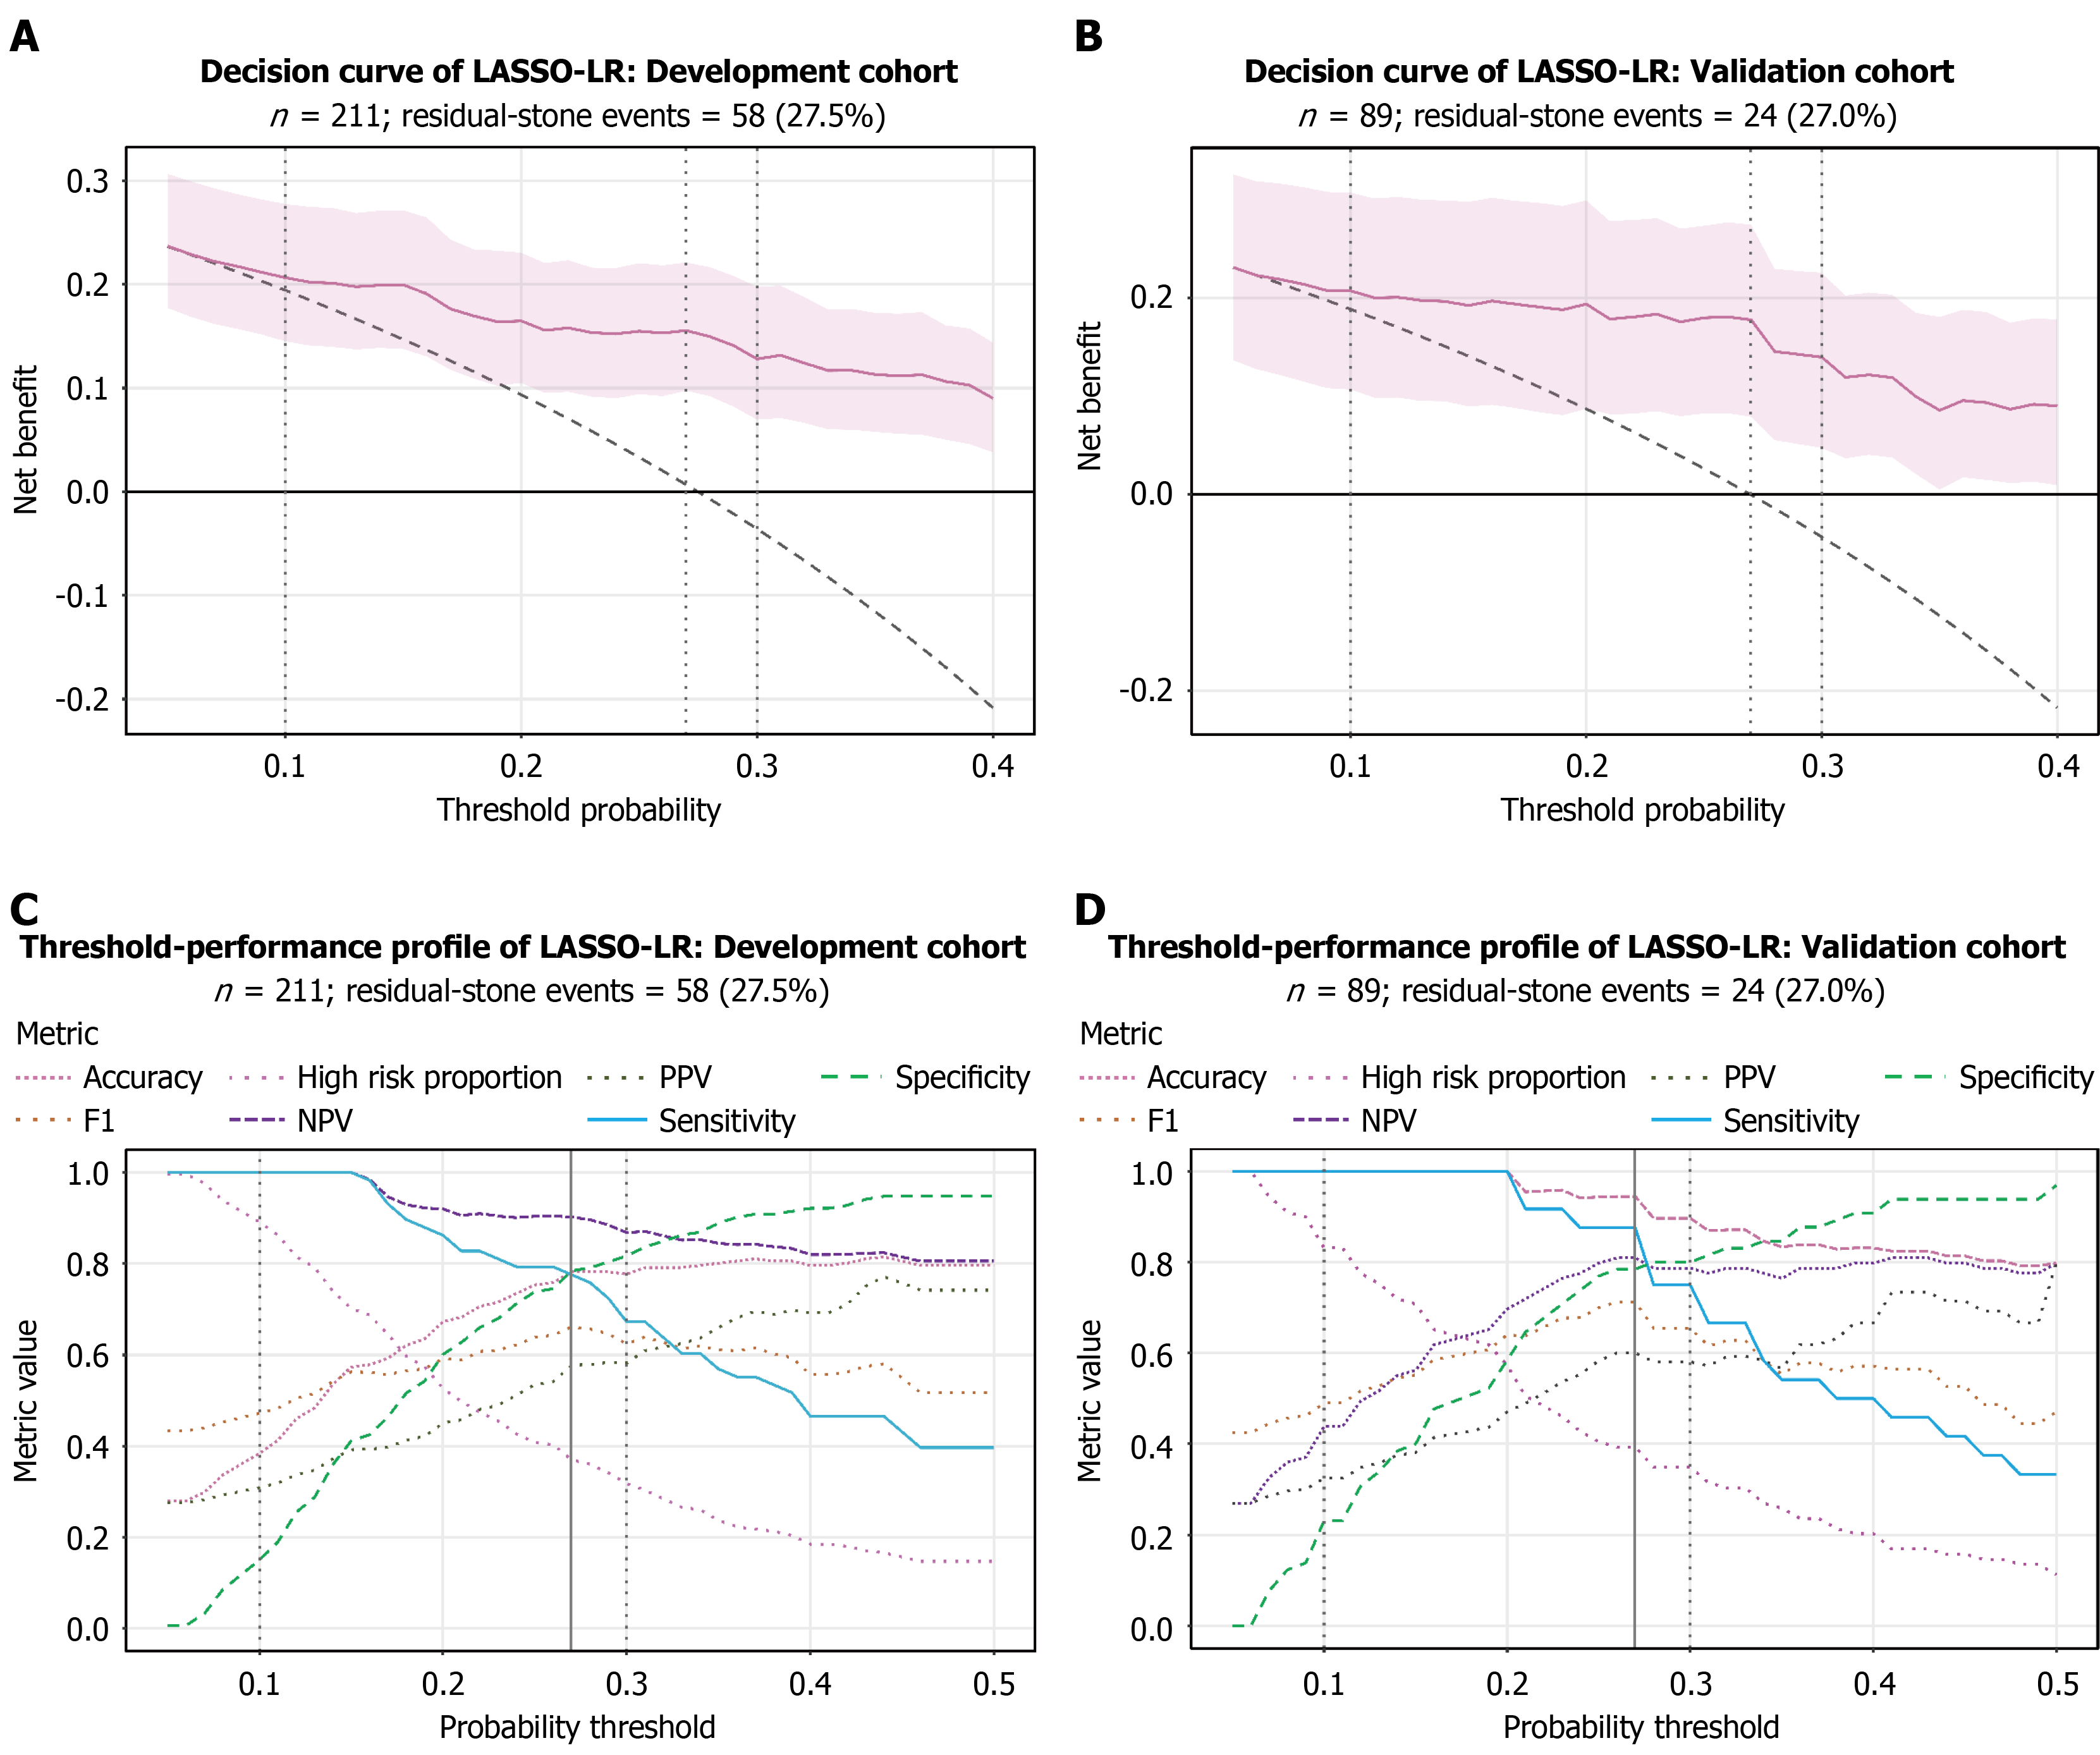
Figure 5 Decision curves and classification performance across decision thresholds.
A: Decision-curve analysis displaying the standardized net clinical benefit of the least absolute shrinkage and selection operator-logistic regression model compared with “treat-all” and “treat-none” strategies across risk thresholds in the development cohort; B: Decision-curve analysis in the held-out validation cohort; C: Classification performance metrics (sensitivity, specificity, positive predictive value, and negative predictive value) as a function of decision thresholds in the development cohort. The vertical dashed line indicates the pre-specified optimal cutoff of 0.270 derived from the maximum Youden index; D: Classification performance profiles across decision thresholds in the held-out validation cohort at the locked 0.270 cutoff. LASSO-LR: Least absolute shrinkage and selection operator-logistic regression; NPV: Negative predictive value; PPV: Positive predictive value.
- Citation: Shao HR, Zeng D, Chen X, Zhu Y, Liu LX, Zhao SL, Zou H. Development and validation of a postoperative prediction model for residual stones after hepatectomy in patients with hepatolithiasis. World J Gastrointest Surg 2026; 18(11): 123786
- URL: https://www.wjgnet.com/1948-9366/full/v18/i11/123786.htm
- DOI: https://dx.doi.org/10.4240/wjgs.123786