
















Copyright: ©Author(s) 2026.
World J Gastrointest Surg. Nov 27, 2026; 18(11): 123786
Published online Nov 27, 2026. doi: 10.4240/wjgs.123786
Published online Nov 27, 2026. doi: 10.4240/wjgs.123786
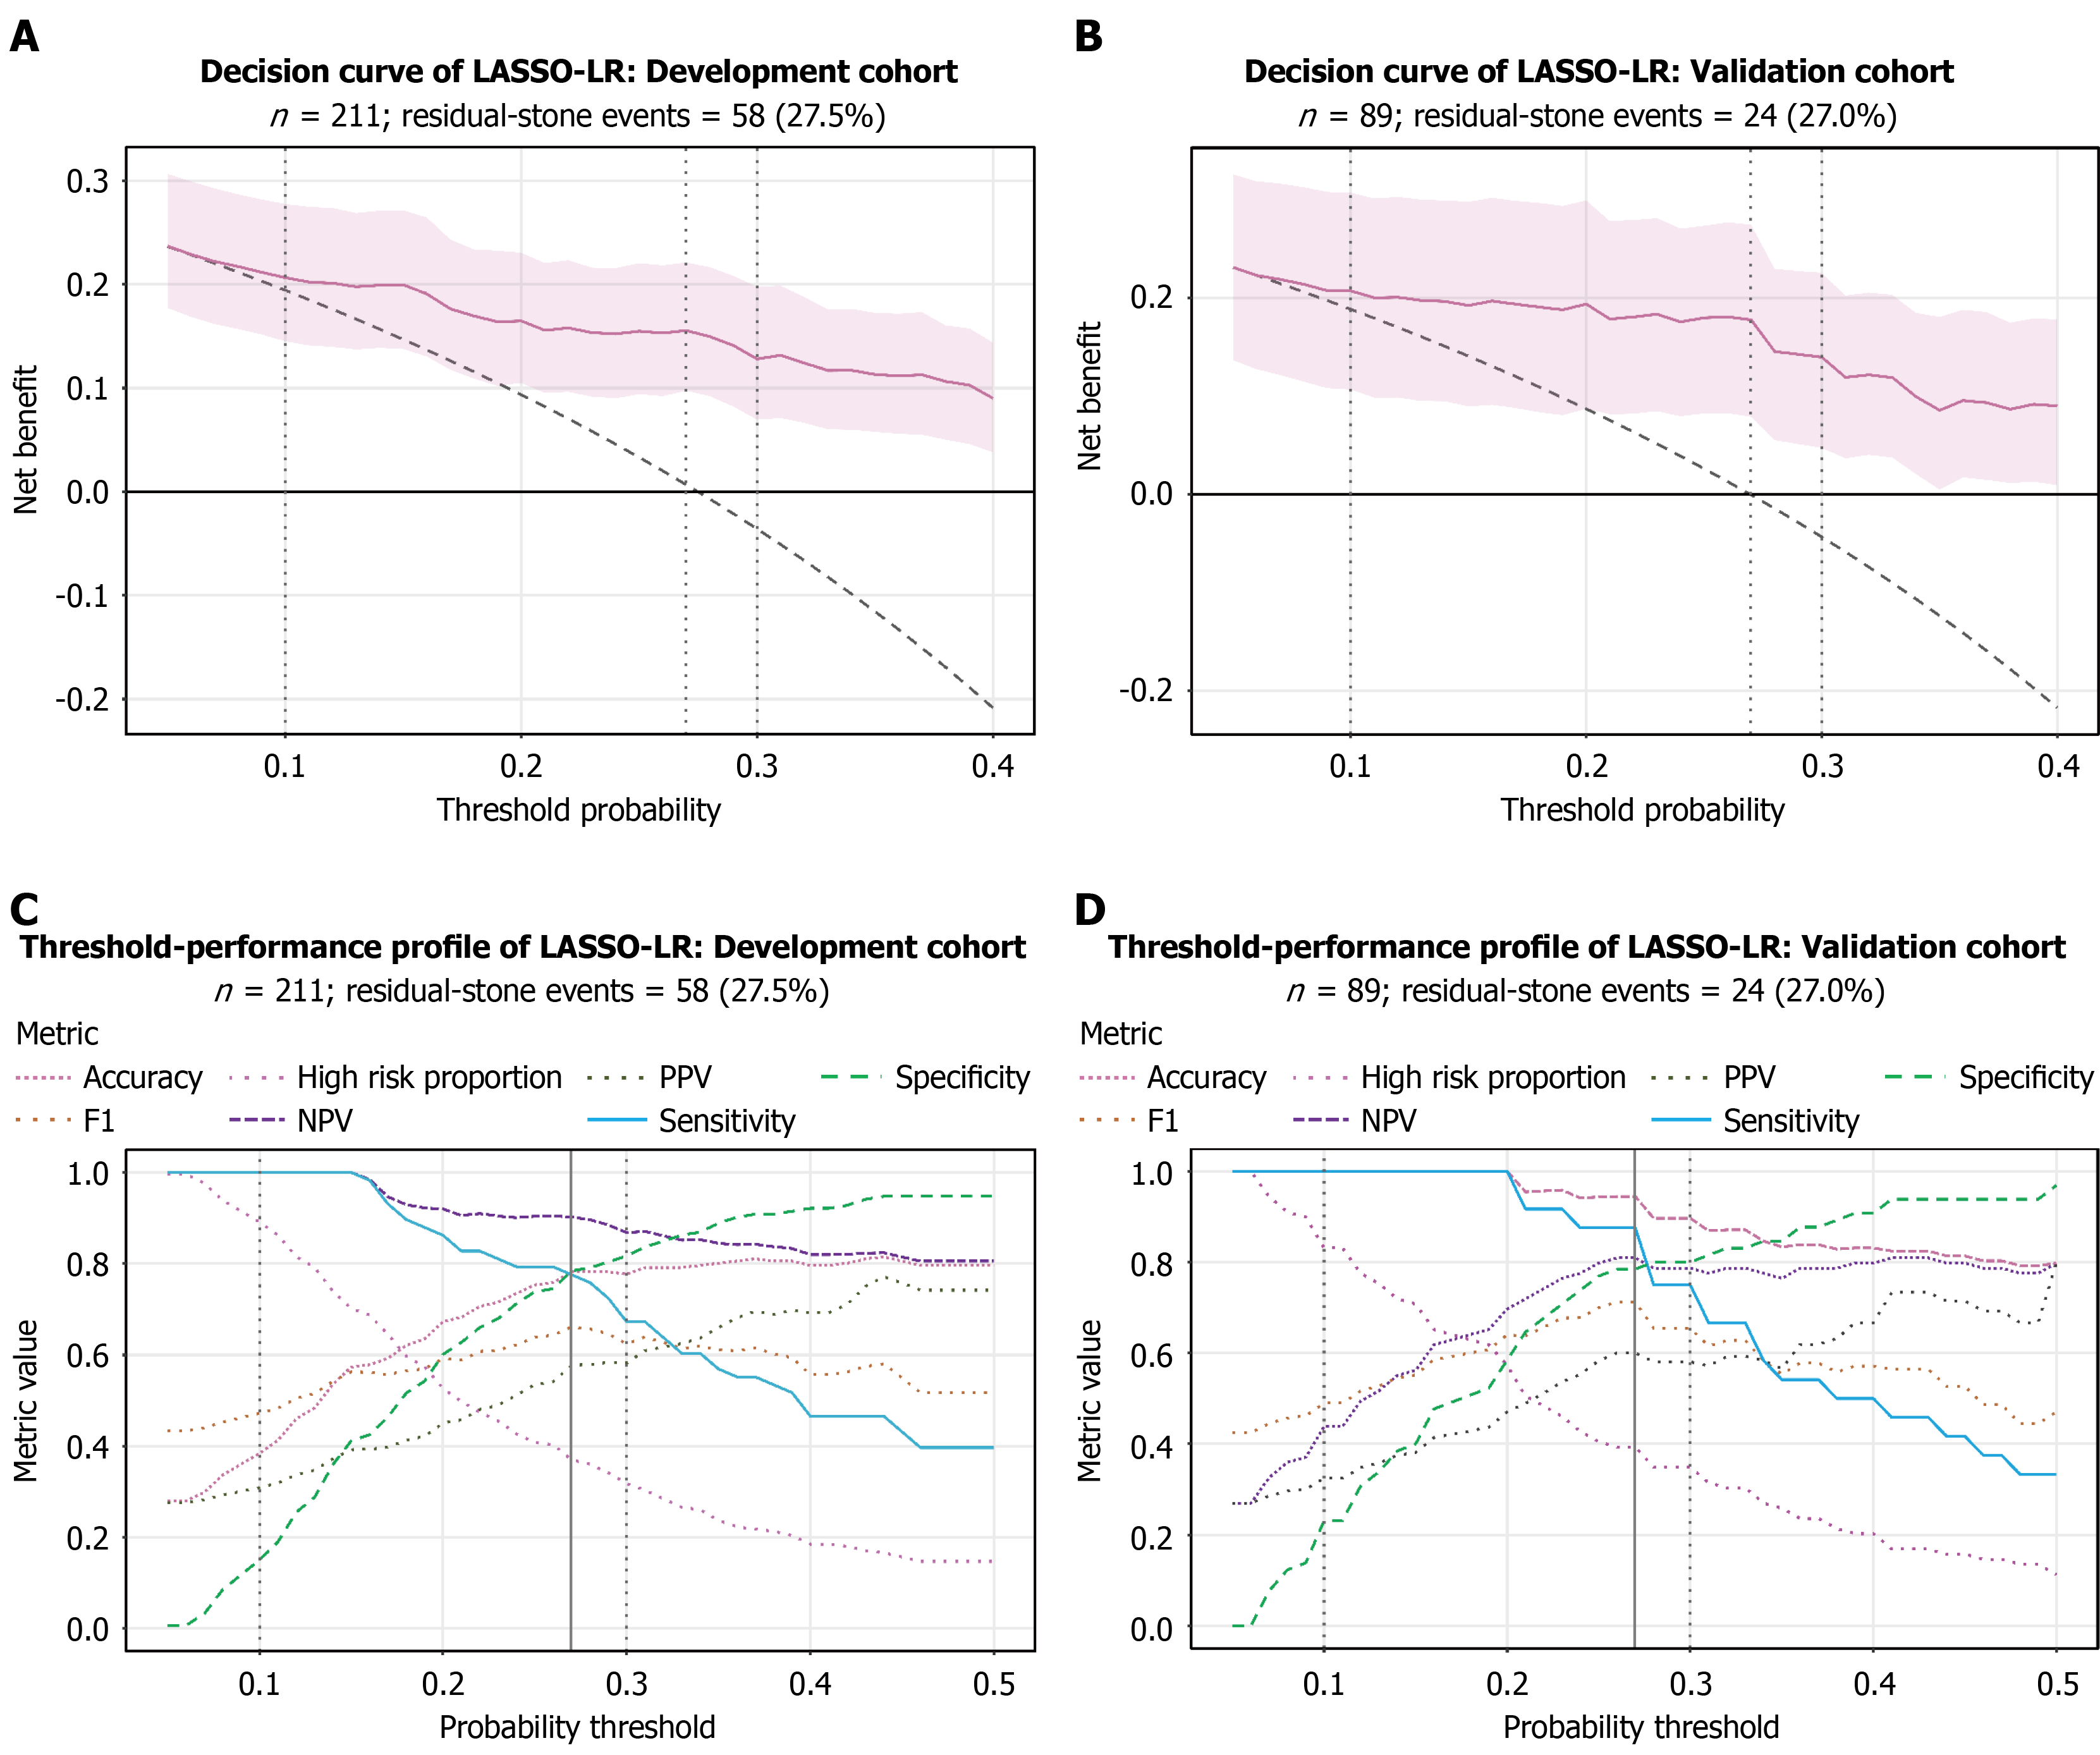
Figure 5 Decision curves and classification performance across decision thresholds.
A: Decision-curve analysis displaying the standardized net clinical benefit of the least absolute shrinkage and selection operator-logistic regression model compared with “treat-all” and “treat-none” strategies across risk thresholds in the development cohort; B: Decision-curve analysis in the held-out validation cohort; C: Classification performance metrics (sensitivity, specificity, positive predictive value, and negative predictive value) as a function of decision thresholds in the development cohort. The vertical dashed line indicates the pre-specified optimal cutoff of 0.270 derived from the maximum Youden index; D: Classification performance profiles across decision thresholds in the held-out validation cohort at the locked 0.270 cutoff. LASSO-LR: Least absolute shrinkage and selection operator-logistic regression; NPV: Negative predictive value; PPV: Positive predictive value.
- Citation: Shao HR, Zeng D, Chen X, Zhu Y, Liu LX, Zhao SL, Zou H. Development and validation of a postoperative prediction model for residual stones after hepatectomy in patients with hepatolithiasis. World J Gastrointest Surg 2026; 18(11): 123786
- URL: https://www.wjgnet.com/1948-9366/full/v18/i11/123786.htm
- DOI: https://dx.doi.org/10.4240/wjgs.123786