
















Copyright: ©Author(s) 2026.
World J Gastrointest Surg. Nov 27, 2026; 18(11): 123786
Published online Nov 27, 2026. doi: 10.4240/wjgs.123786
Published online Nov 27, 2026. doi: 10.4240/wjgs.123786
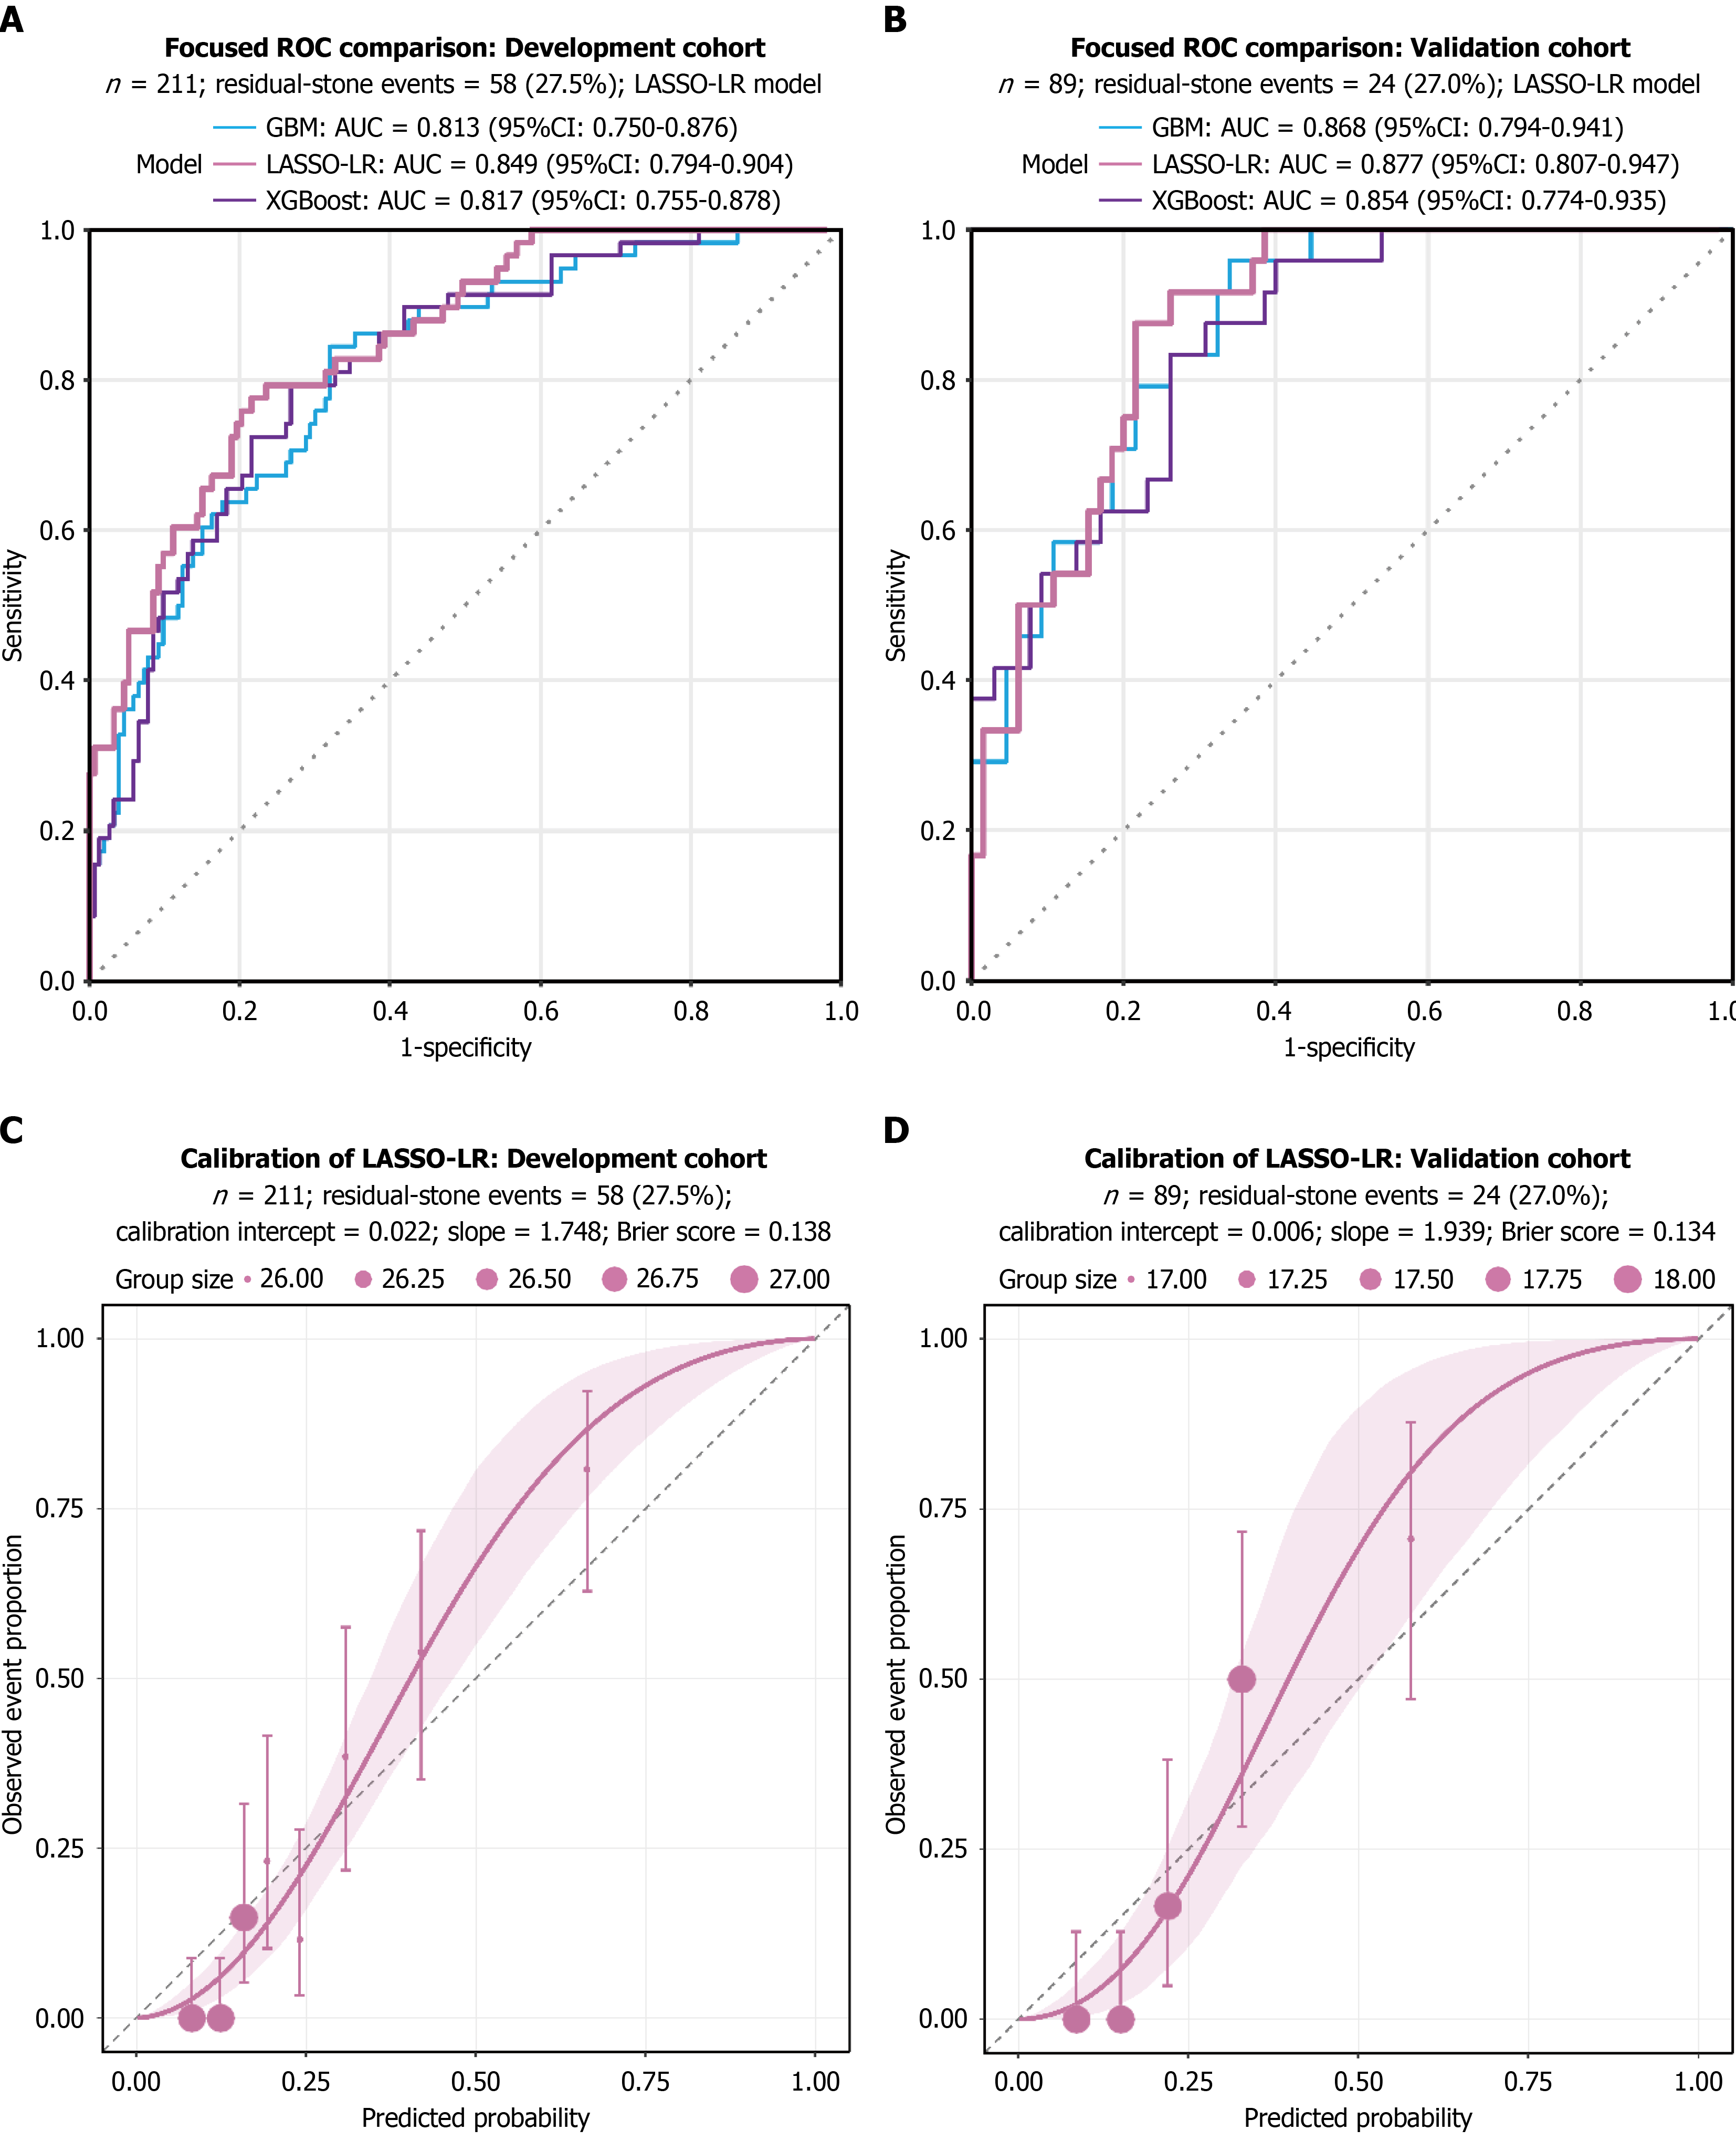
Figure 4 Discriminative performance and calibration curves of the least absolute shrinkage and selection operator-logistic regression model.
A: Receiver operating characteristic curves in the development cohort evaluated via out-of-fold (OOF) cross-validation; B: Receiver operating characteristic curves in the independent held-out validation cohort (n = 89). Shaded regions represent 95% confidence intervals (CIs) for the least absolute shrinkage and selection operator-logistic regression model, with comparator models (gradient boosting machine, eXtreme Gradient Boosting, and support vector machine with radial basis function kernel) shown for reference; C: Calibration plot in the development cohort based on OOF predictions; D: Calibration plot in the held-out validation cohort. The dashed 45-degree line represents perfect calibration. Solid colored lines and scatter points indicate observed vs predicted residual stone probabilities with bootstrap-derived 95%CIs. LASSO-LR: Least absolute shrinkage and selection operator-logistic regression; ROC: Receiver operating characteristic; XGBoost: EXtreme Gradient Boosting; GBM: Gradient boosting machine; AUC: Area under the receiver operating characteristic curve.
- Citation: Shao HR, Zeng D, Chen X, Zhu Y, Liu LX, Zhao SL, Zou H. Development and validation of a postoperative prediction model for residual stones after hepatectomy in patients with hepatolithiasis. World J Gastrointest Surg 2026; 18(11): 123786
- URL: https://www.wjgnet.com/1948-9366/full/v18/i11/123786.htm
- DOI: https://dx.doi.org/10.4240/wjgs.123786