Copyright
©The Author(s) 2025.
World J Diabetes. Jun 15, 2025; 16(6): 103616
Published online Jun 15, 2025. doi: 10.4239/wjd.v16.i6.103616
Published online Jun 15, 2025. doi: 10.4239/wjd.v16.i6.103616
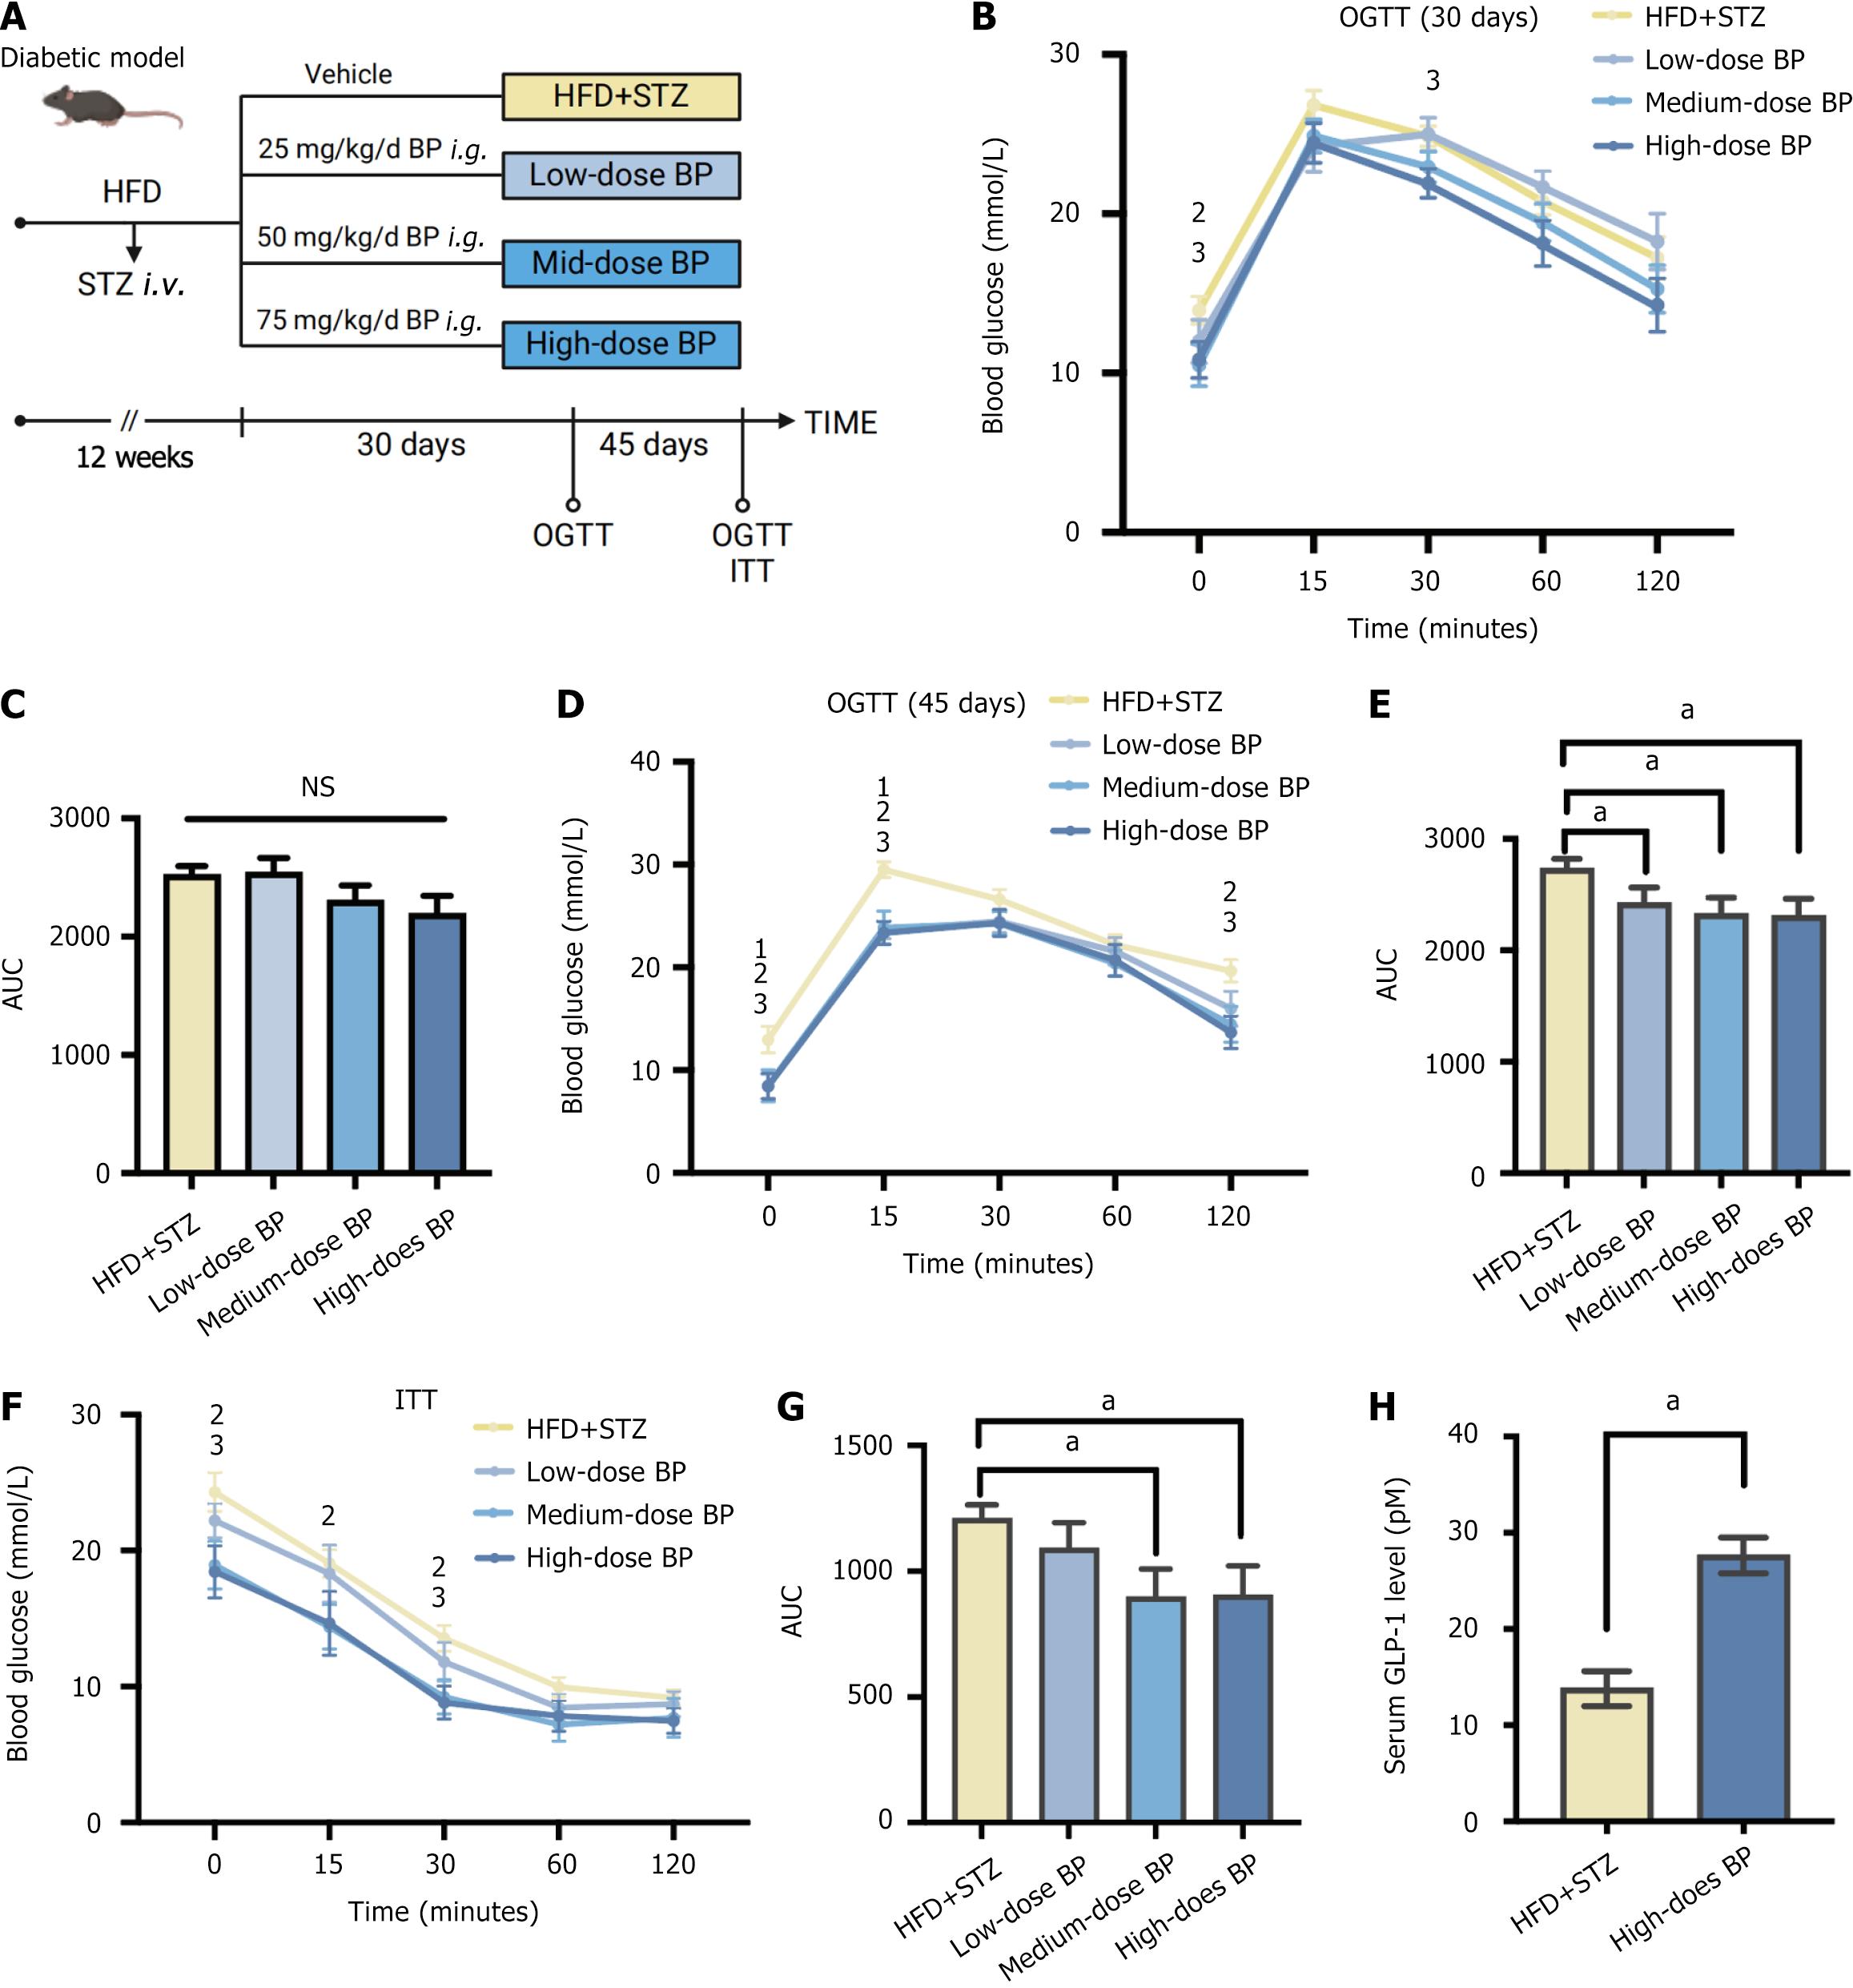
Figure 1 Bile powder improved blood glucose in a diabetic mouse model.
A: Schematic diagram. Mice were fed a high-fat diet (HFD) for 6 weeks and were injected with streptozotocin (STZ) (50 mg/kg, intravenous) to induce blood glucose disorder. Mice continued a HFD for an additional 6 weeks. The mice were randomly divided into four groups (n = 5 per group) and treated with different doses of bile powder (BP): The HFD + STZ group (control group); The low-dose BP group (25 mg/kg/day, intragastric gavage); The medium-dose BP group (50 mg/kg/day, intragastric gavage); The high-dose BP group (75 mg/kg/day, intragastric gavage). The oral glucose tolerance test (OGTT) and insulin tolerance test (ITT) were performed after 30 days and 45 days of BP administration; B: OGTT after 30 days of BP treatment; C: Area under the curve (AUC) of the OGTT after 30 days of BP treatment; D: OGTT after 45 days of BP treatment; E: AUC of the OGTT after 45 days of BP treatment; F: ITT after 45 days of BP treatment; G: AUC of the ITT after 45 days of BP treatment; H: Serum glucagon-like peptide-1 levels in the HFD + STZ group and the high-dose BP group after 45 days of treatment. Data are shown as mean ± SEM. NS: Not significant (P > 0.05) compared between groups. Statistical analysis was performed using the Student’s t-test. aP < 0.05. 1High-fat diet + streptozotocin vs low-dose bile powder. 2High-fat diet + streptozotocin vs medium-dose bile powder. 3High-fat diet + streptozotocin vs high-dose bile powder. HFD: High-fat diet; STZ: Streptozotocin; BP: Bile powder; OGTT: Oral glucose tolerance test; ITT: Insulin tolerance test; AUC: Area under the curve; GLP-1: Glucagon-like peptide-1.
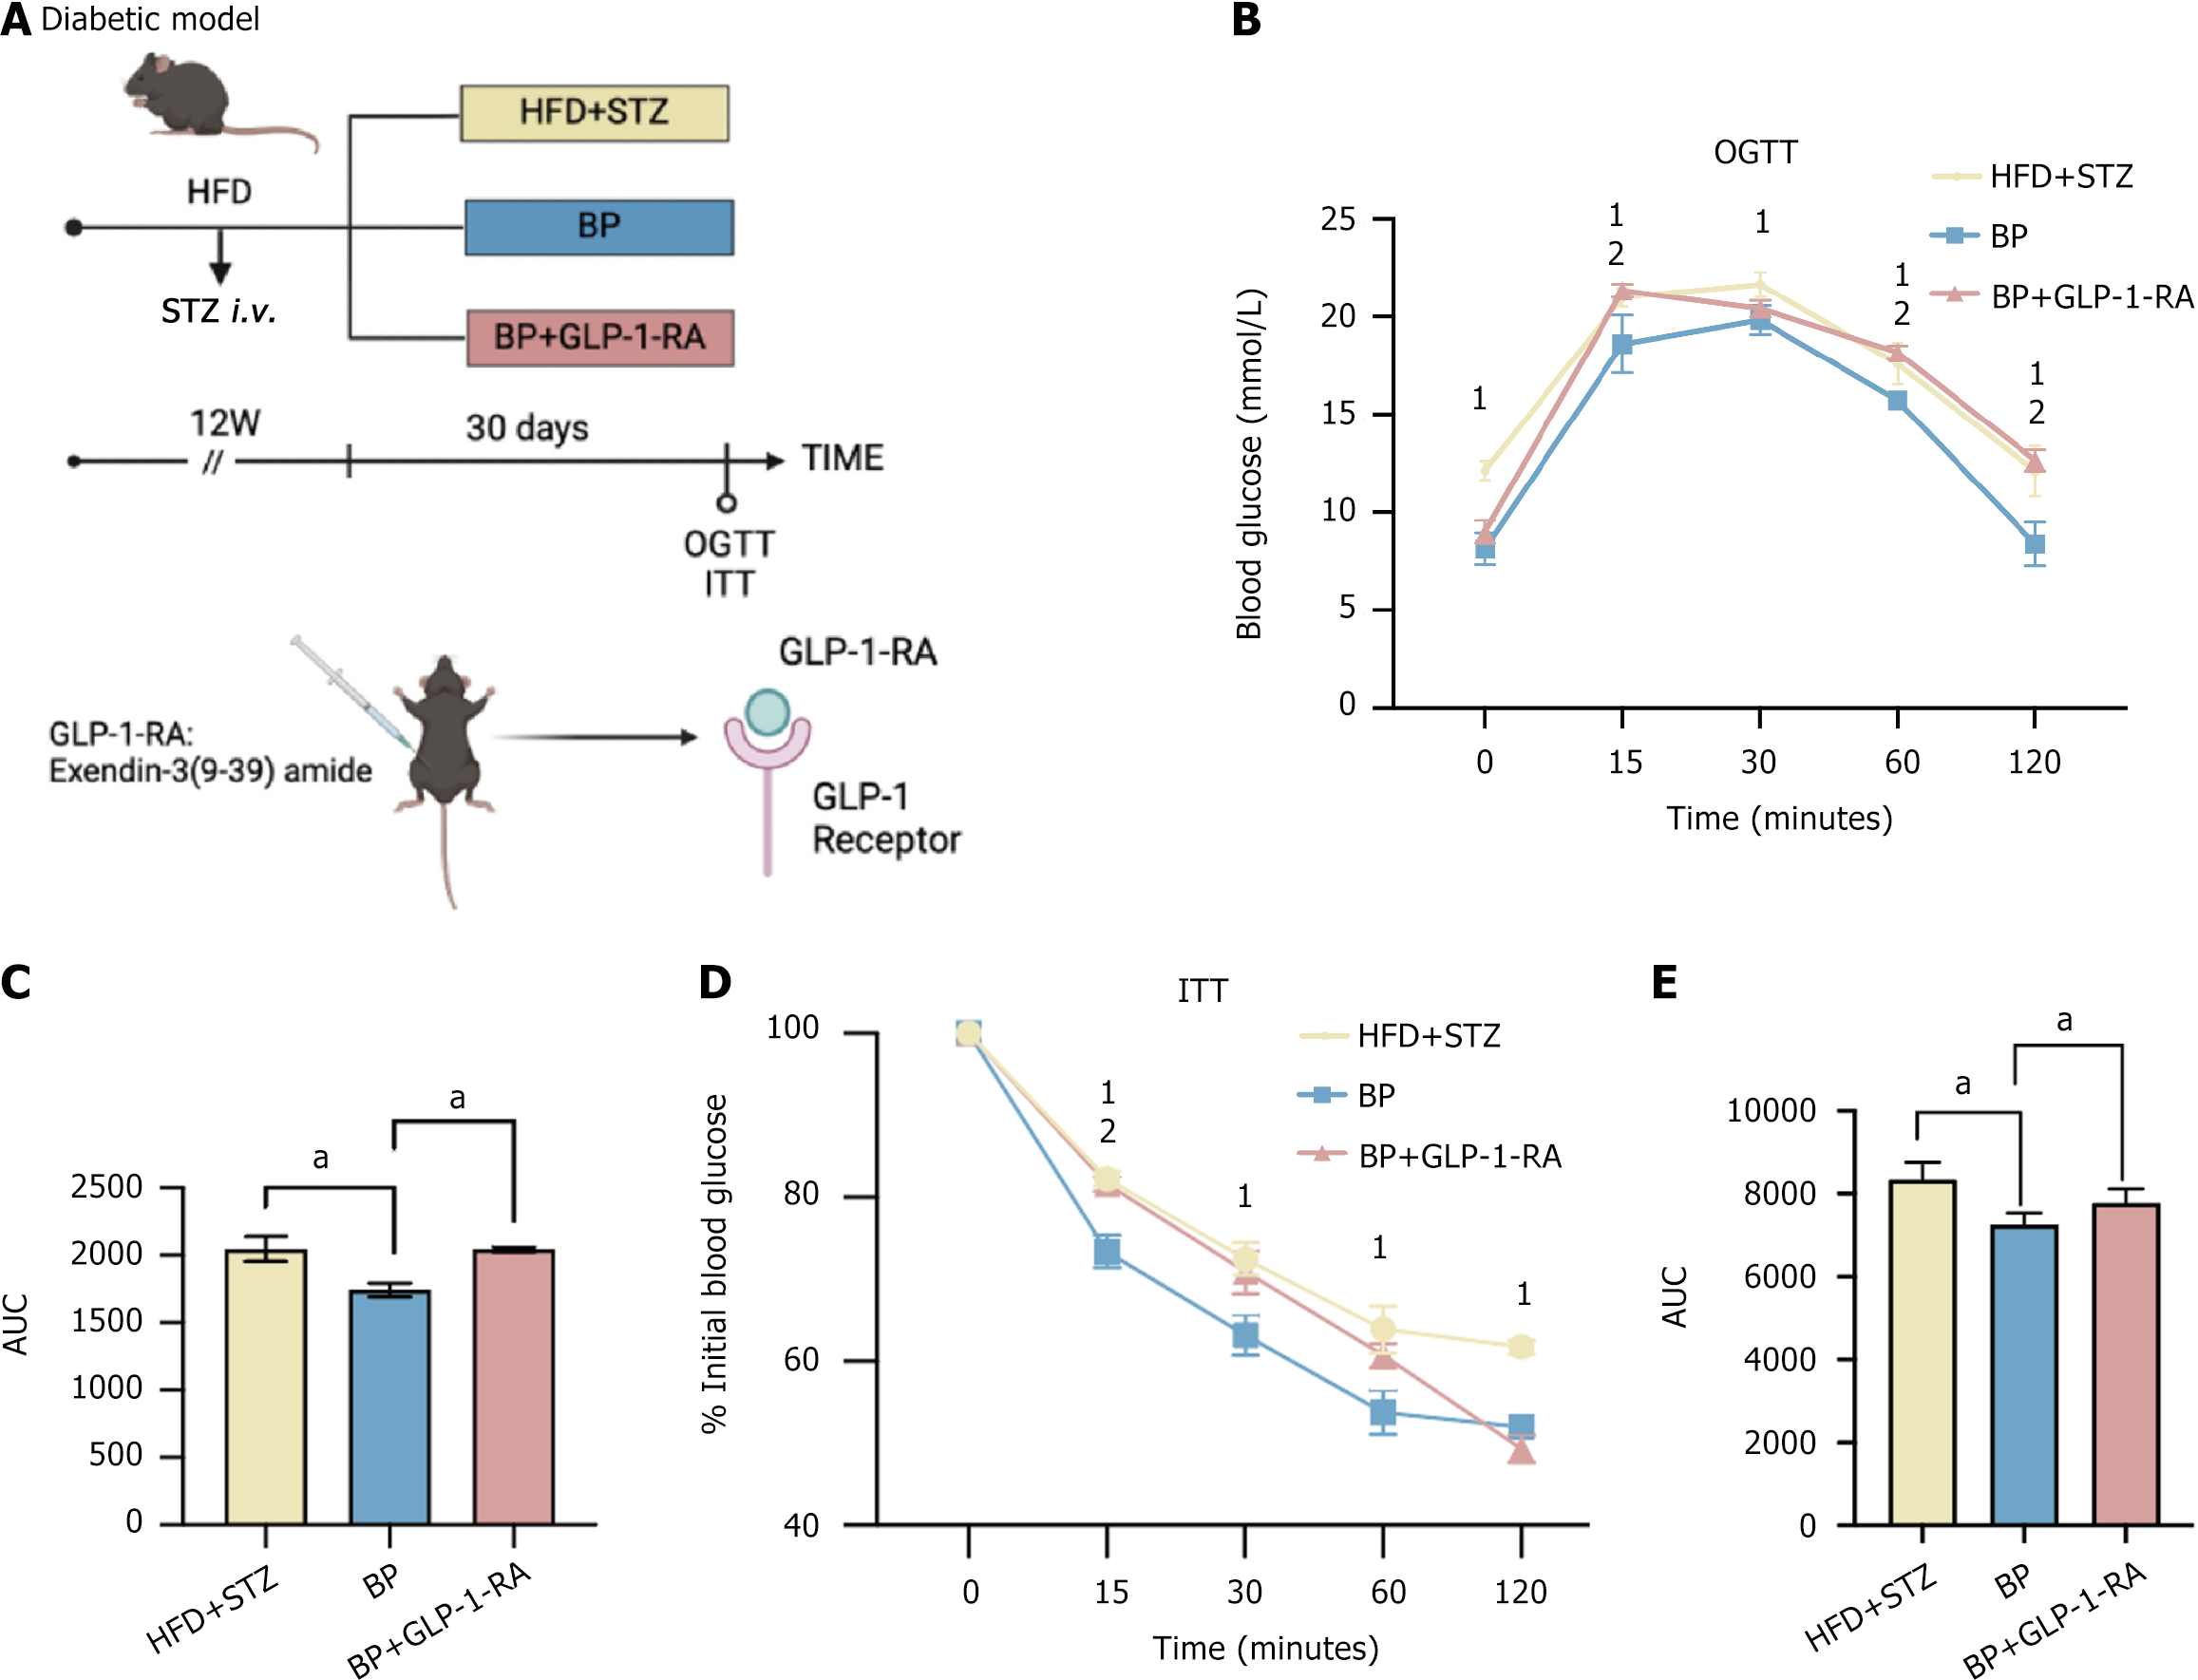
Figure 2 Bile powder alleviated hyperglycemia through glucagon-like peptide-1 signaling.
A: Schematic diagram. Mice were fed a high-fat diet (HFD) for 6 weeks and were injected with streptozotocin (STZ) (50 mg/kg, intravenous) to induce blood glucose disorder. The HFD was continued for an additional 6 weeks. The mice were randomly divided into three groups (n = 5 per group): The HFD + STZ group; the bile powder (BP) group (75 mg/kg/day BP, intragastric gavage); and the BP + glucagon-like peptide-1 receptor agonist group [75 mg/kg/day BP, intragastric gavage + 25 nmol/kg/day glucagon-like peptide-1 receptor antagonist, exendin-3 (3-39) amide, intraperitoneal]. The oral glucose tolerance test (OGTT) and insulin tolerance test (ITT) were performed after the 30-day treatment; B: OGTT; C: Area under the curve (AUC) of the OGTT after the 30-day treatment; D: ITT; E: AUC of the ITT after the 30-day treatment. Data are shown as mean ± SEM. P < 0.05 compared between groups. Statistical analysis was performed using the Student’s t-test. aP < 0.05. 1High-fat diet-streptozotocin vs bile powder. 2Bile powder vs bile powder + glucagon-like peptide-1 receptor antagonist. HFD: High-fat diet; STZ: Streptozotocin; BP: Bile powder; OGTT: Oral glucose tolerance test; ITT: Insulin tolerance test; AUC: Area under the curve; GLP-1: Glucagon-like peptide-1; GLP1-RA: Glucagon-like peptide-1 receptor antagonist.
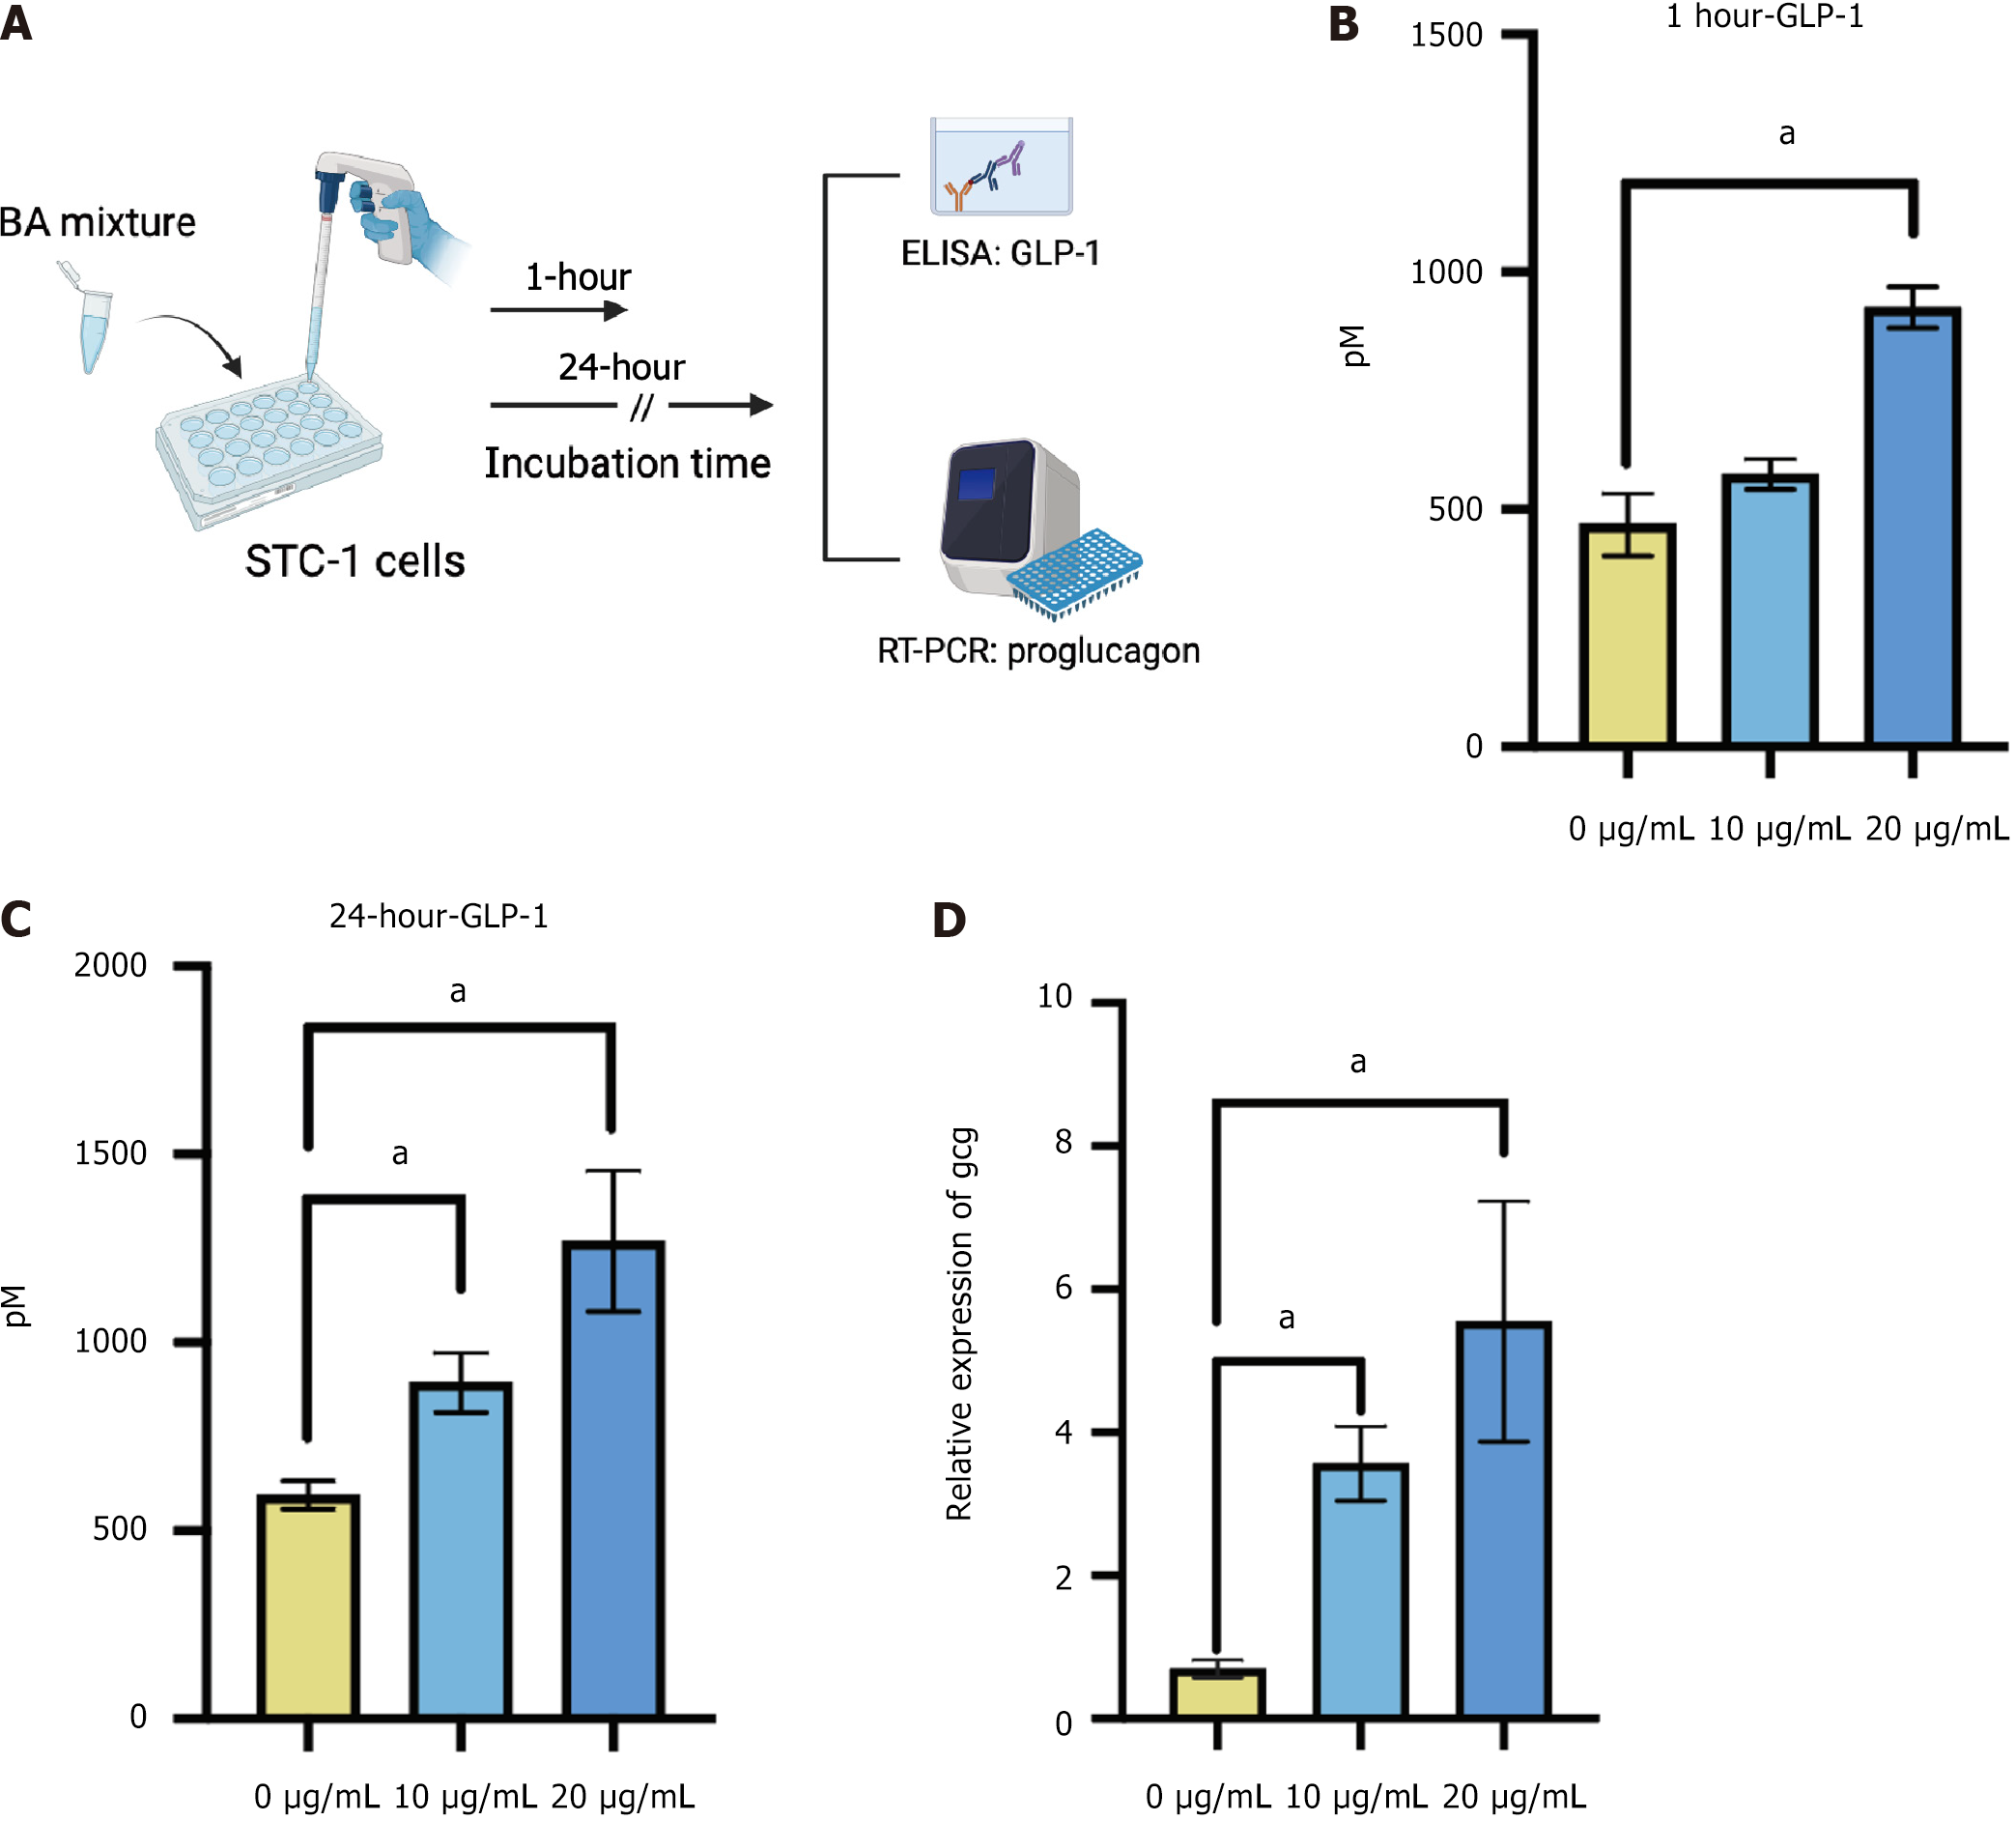
Figure 3 Bile acid mixture stimulated glucagon-like peptide-1 secretion in STC-1 cells.
A: Schematic diagram. STC-1 cells were treated with 0, 10, and 20 μg/mL of mixed bile acids for 1 hour or 24 hours to determine glucagon-like peptide-1 secretion and the proglucagon (Gcg) expression level; B: Glucagon-like peptide-1 levels in the medium after 1 hour of treatment; C: Glucagon-like peptide-1 levels in the medium after 24 hours of treatment; D: Relative expression levels of Gcg in STC-1 cells after 24 hours of treatment. Data are shown as mean ± SEM. P < 0.05 compared between groups. Statistical analysis was performed using the Student’s t-test. aP < 0.05. BA: Bile acid; ELASA: Enzyme-linked immunosorbent assay; RT-PCR: Real-time polymerase chain reaction; GLP-1: Glucagon-like peptide-1.
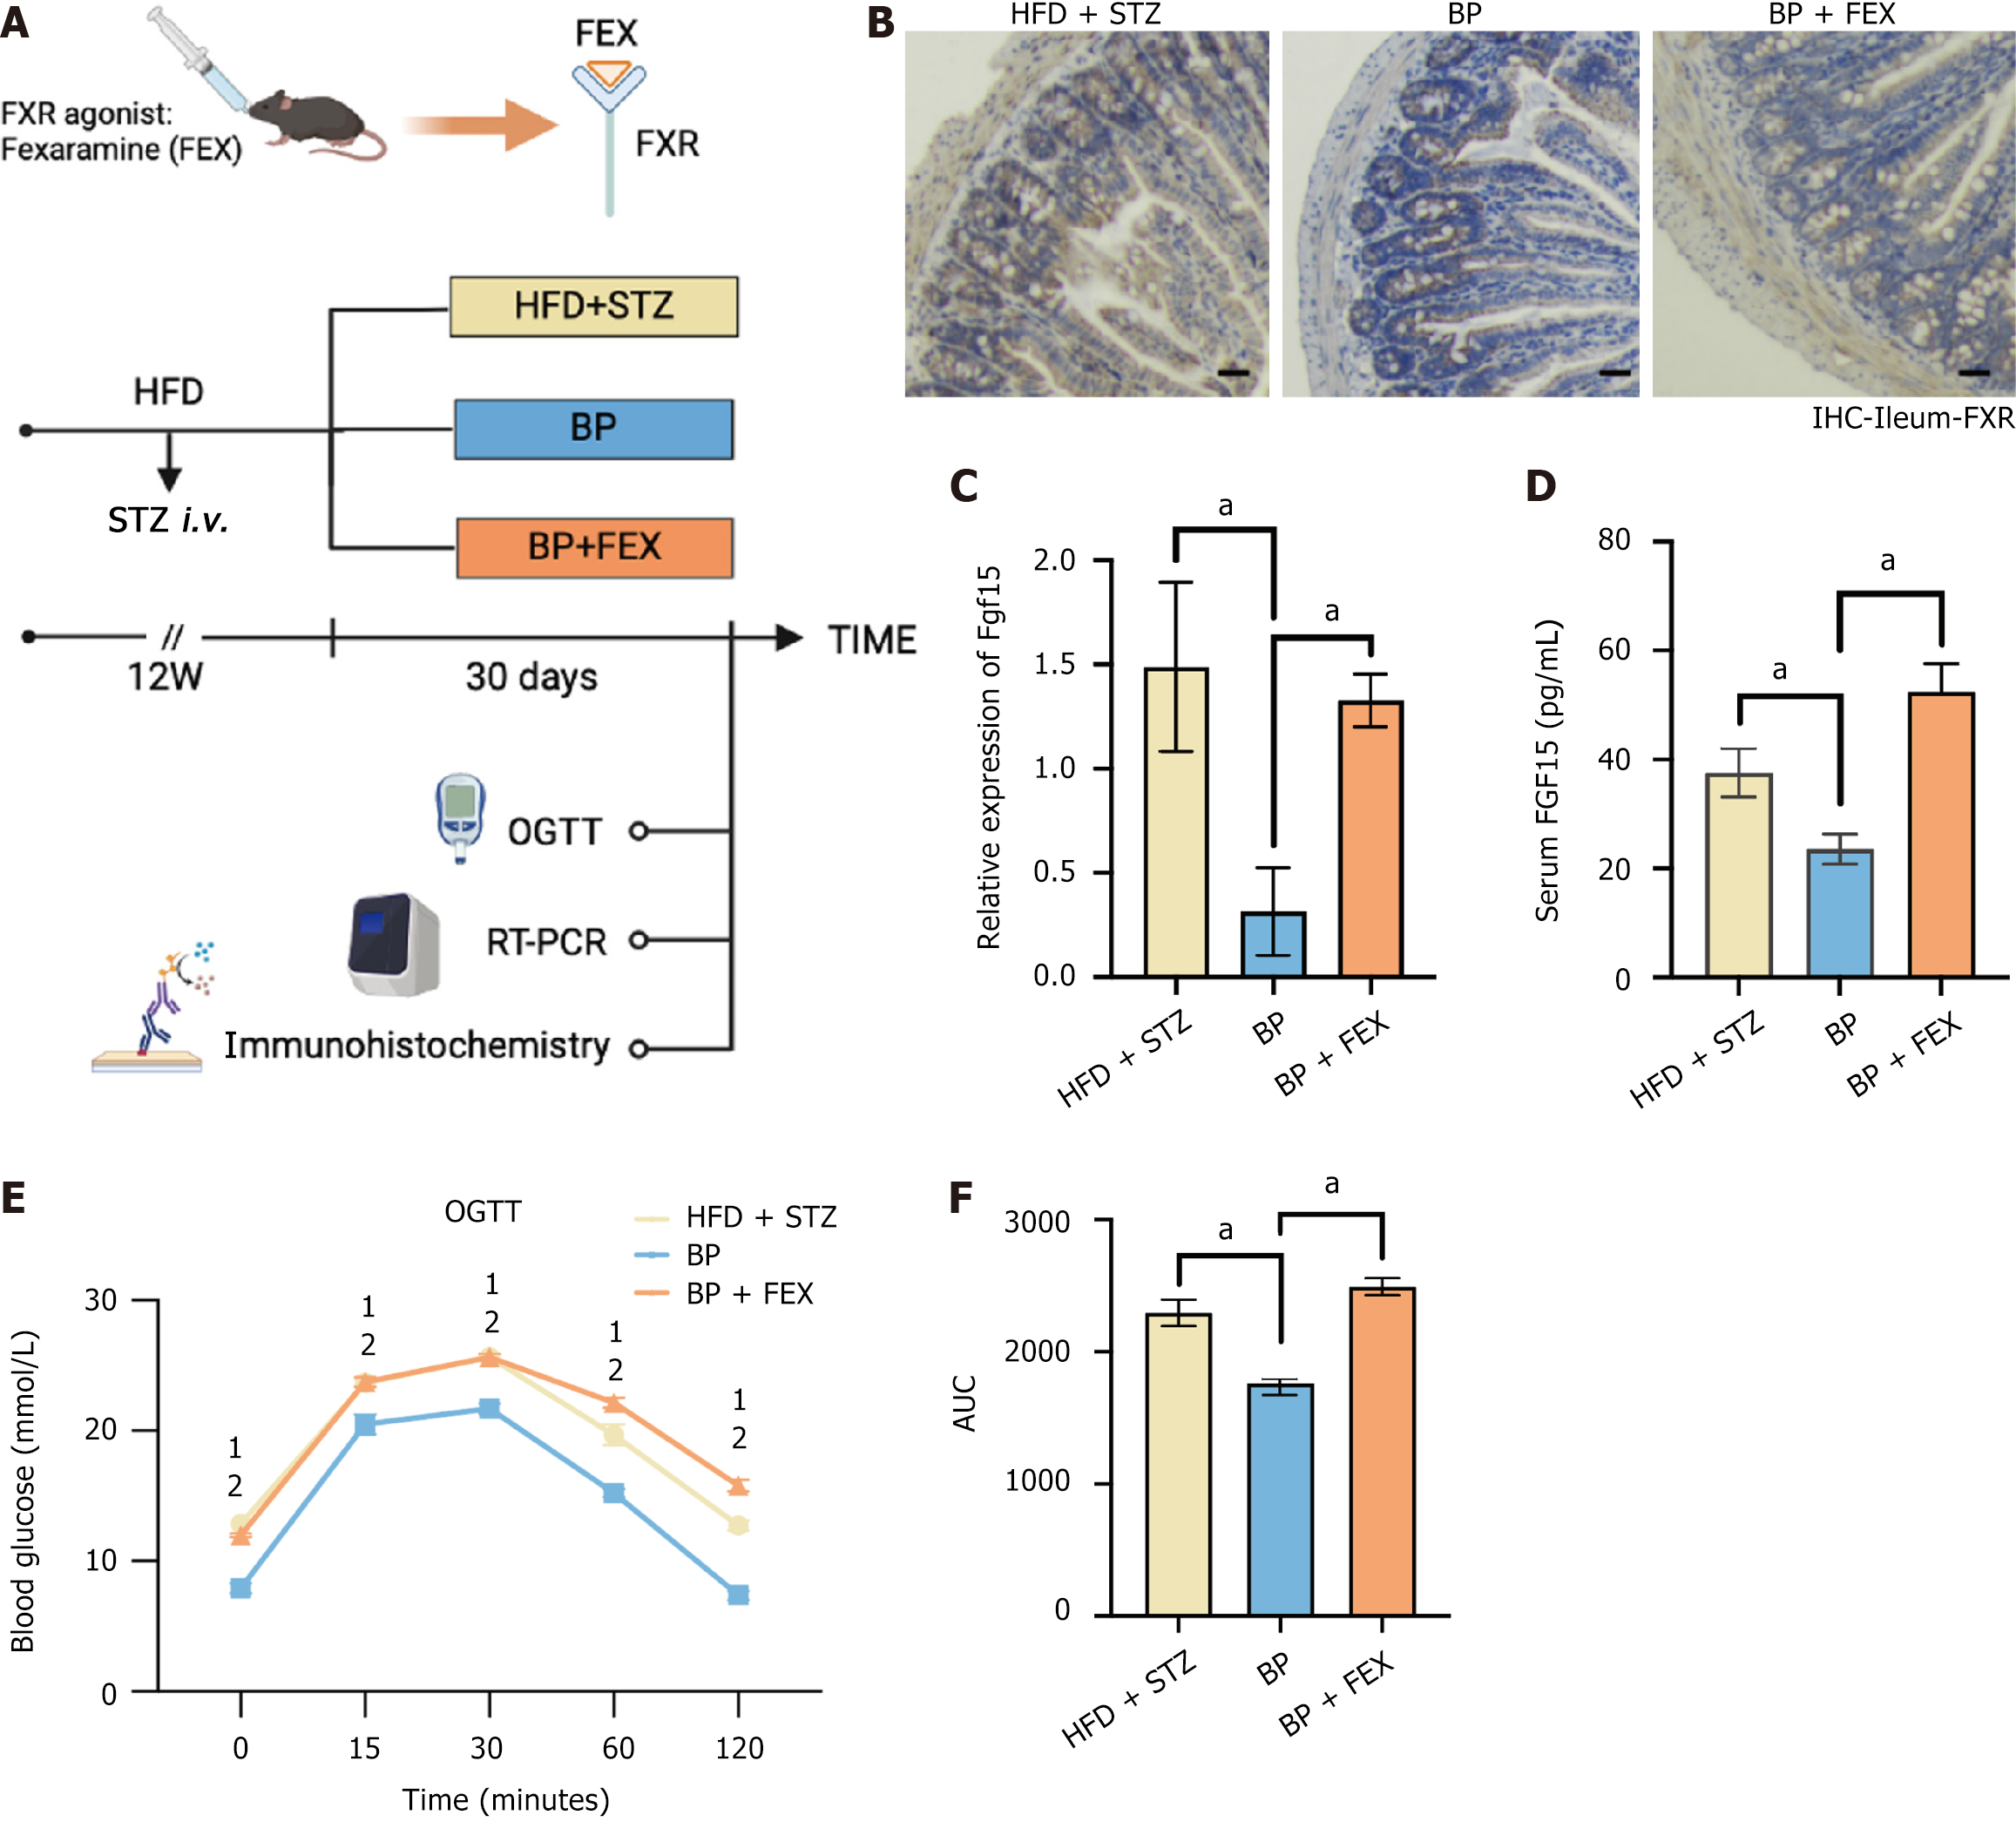
Figure 4 Bile powder regulated blood glucose homeostasis via inhibiting intestinal farnesoid X receptor signaling pathway.
A: Schematic diagram. Mice were fed a high-fat diet (HFD) for 6 weeks and were injected with streptozotocin (STZ) (50 mg/kg, intravenous) to induce blood glucose disorder. Mice were fed a HFD for an additional 6 weeks. The mice were randomly divided into three groups (n = 5 per group): The HFD + STZ group; The bile powder (BP) group (75 mg/kg/day BP, intragastric gavage); The BP + fexaramine group (75 mg/kg/day BP, intragastric gavage + 100 mg/kg/day fexaramine, intragastric gavage); B: Intestinal immunohistochemistry analysis of the farnesoid X receptor (scale bars = 100 μm); C: Relative expression of fibroblast growth factor 15 transcription in the ileum; D: Serum fibroblast growth factor 15 levels; E: Oral glucose tolerance test after the 30-day treatment; F: The area under the curve of the oral glucose tolerance test after the 30-day treatment. Data are shown as mean ± SEM. P < 0.05 compared between groups. Statistical analysis was performed using Student’s t-test. aP < 0.05. 1High-fat diet + streptozotocin vs bile powder. 2Bile powder vs bile powder + fexaramine. FXR: Farnesoid X receptor; FEX: Fexaramine; HFD: High-fat diet; STZ: Streptozotocin; BP: Bile powder; OGTT: Oral glucose tolerance test; RT-PCR: Real-time polymerase chain reaction; IHC: Immunohistochemistry; AUC: Area under the curve.
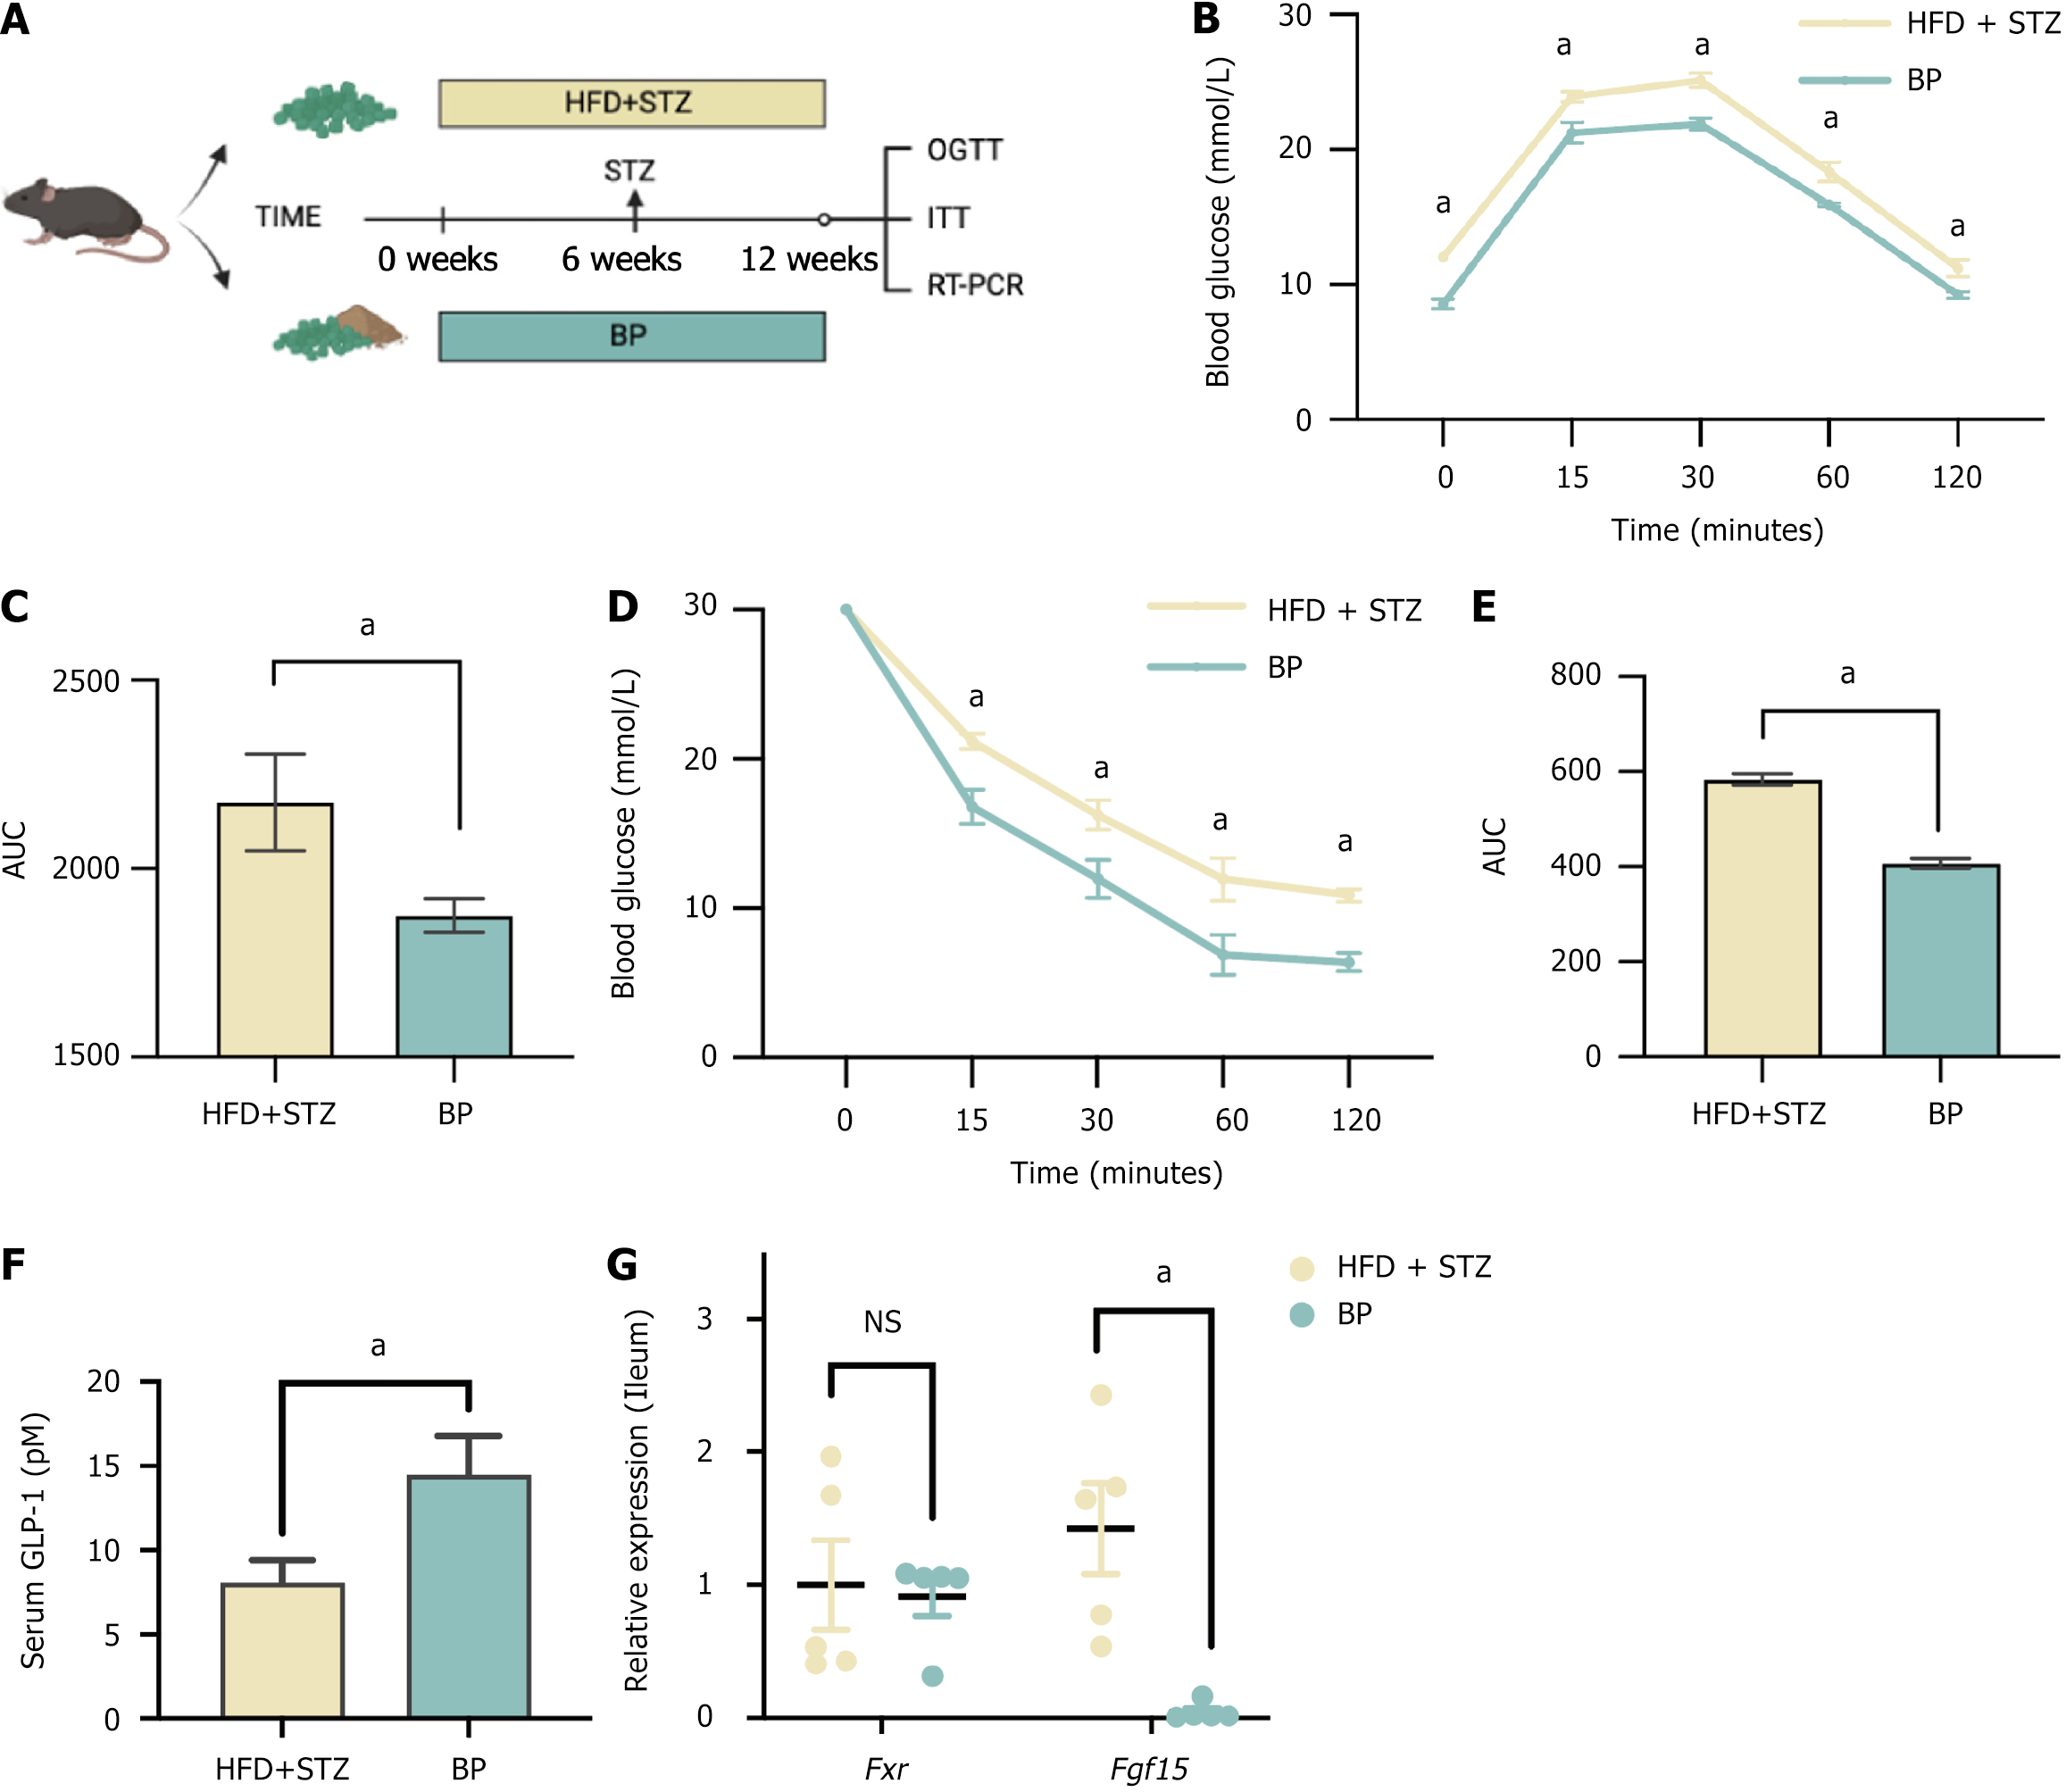
Figure 5 Long-term feeding of bile powder prevented blood glucose disorders.
A: Schematic diagram. Mice were randomly divided into two groups (n = 5 per group). All of the mice were fed a high-fat diet (HFD) for 6 weeks and were injected with streptozotocin (STZ) (50 mg/kg, intravenous) to induce blood glucose disorder. An HFD was continued for an additional 6 weeks. Mice in the bile powder group were treated with bile powder (75 mg/kg/day, intragastric gavage) for 12 weeks, and those in the HFD + STZ group were treated with the vehicle; B: Oral glucose tolerance test after 12 weeks of treatment; C: The area under the curve of the oral glucose tolerance test after 12 weeks of treatment; D: Insulin tolerance test after 12 weeks; E: The area under the curve of the insulin tolerance test after 12 weeks of treatment; F: Serum glucagon-like peptide-1 levels; G: Relative expression of farnesoid X receptor and fibroblast growth factor 15 gene expression in the ileum. Data are shown as mean ± SEM. P < 0.05. ns: Not significant (P > 0.05) compared between groups. Statistical analysis was performed using the Student’s t-test. HFD: High-fat diet; STZ: Streptozotocin; BP: Bile powder; OGTT: Oral glucose tolerance test; ITT: Insulin tolerance test; AUC: Area under the curve; GLP-1: Glucagon-like peptide-1; RT-PCR: Real-time polymerase chain reaction.
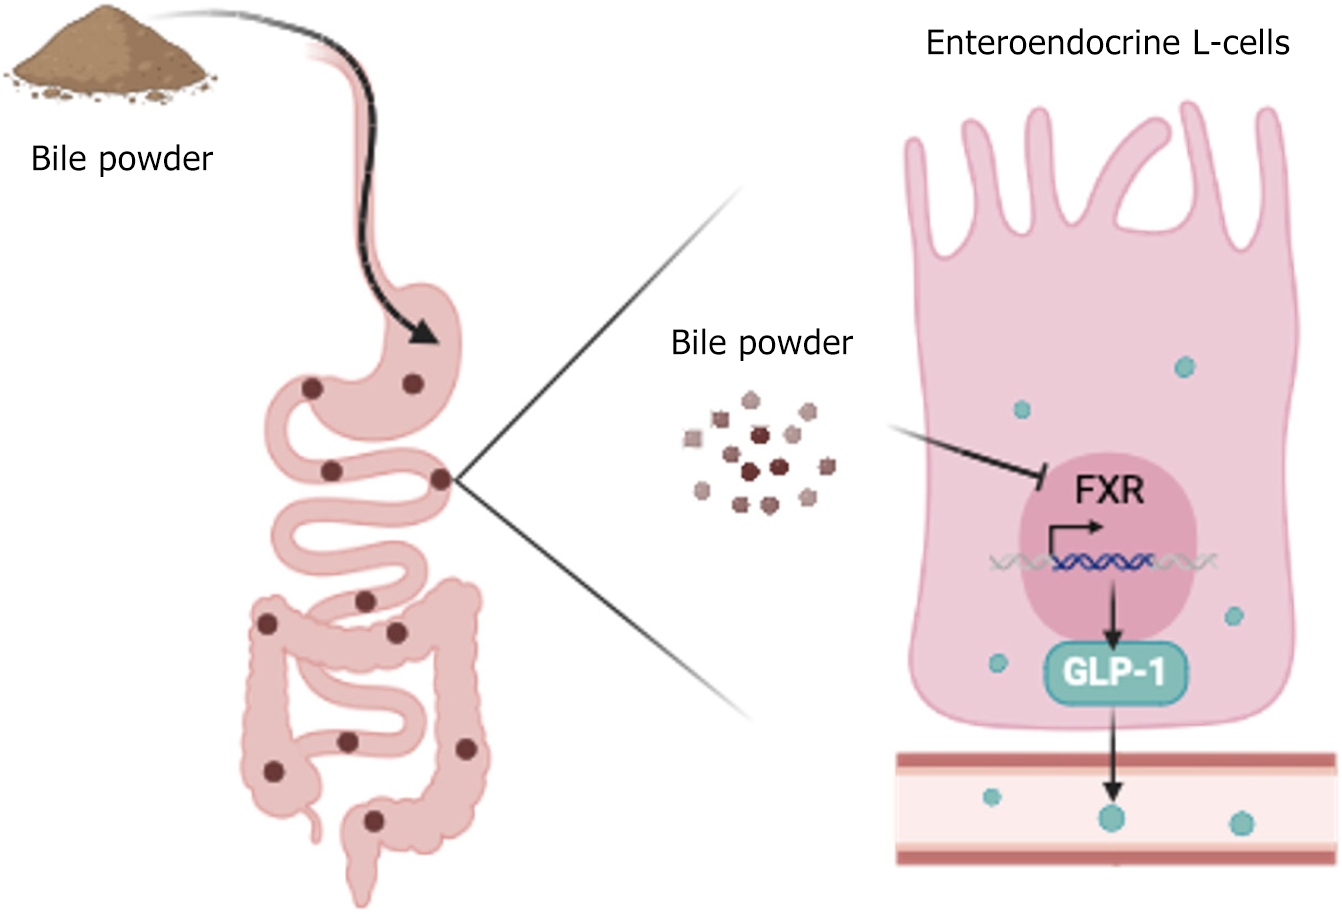
Figure 6 Mechanism of glucose disorder amelioration by bile powder-mediated intestinal glucagon-like peptide-1 secretion.
Our study revealed that bile powder interacts with the intestinal enteroendocrine L cells to inhibit farnesoid X receptor signaling and to promote glucagon-like peptide-1 production. Bile powder is a glucagon-like peptide-1 stimulator and attenuates blood glucose impairment. GLP-1: Glucagon-like peptide-1; FXR: Farnesoid X receptor.
- Citation: Sun YM, Kuang JL, Zhang HH, Xia XX, Wang JY, Zheng D, Zhou KJ, Tang YJ, Zhao AH, Jia W, Xie GX, Zheng XJ. Pig bile powder maintains blood glucose homeostasis by promoting glucagon-like peptide-1 secretion via inhibiting farnesoid X receptor. World J Diabetes 2025; 16(6): 103616
- URL: https://www.wjgnet.com/1948-9358/full/v16/i6/103616.htm
- DOI: https://dx.doi.org/10.4239/wjd.v16.i6.103616


