Copyright
©The Author(s) 2025.
World J Diabetes. Jun 15, 2025; 16(6): 103616
Published online Jun 15, 2025. doi: 10.4239/wjd.v16.i6.103616
Published online Jun 15, 2025. doi: 10.4239/wjd.v16.i6.103616
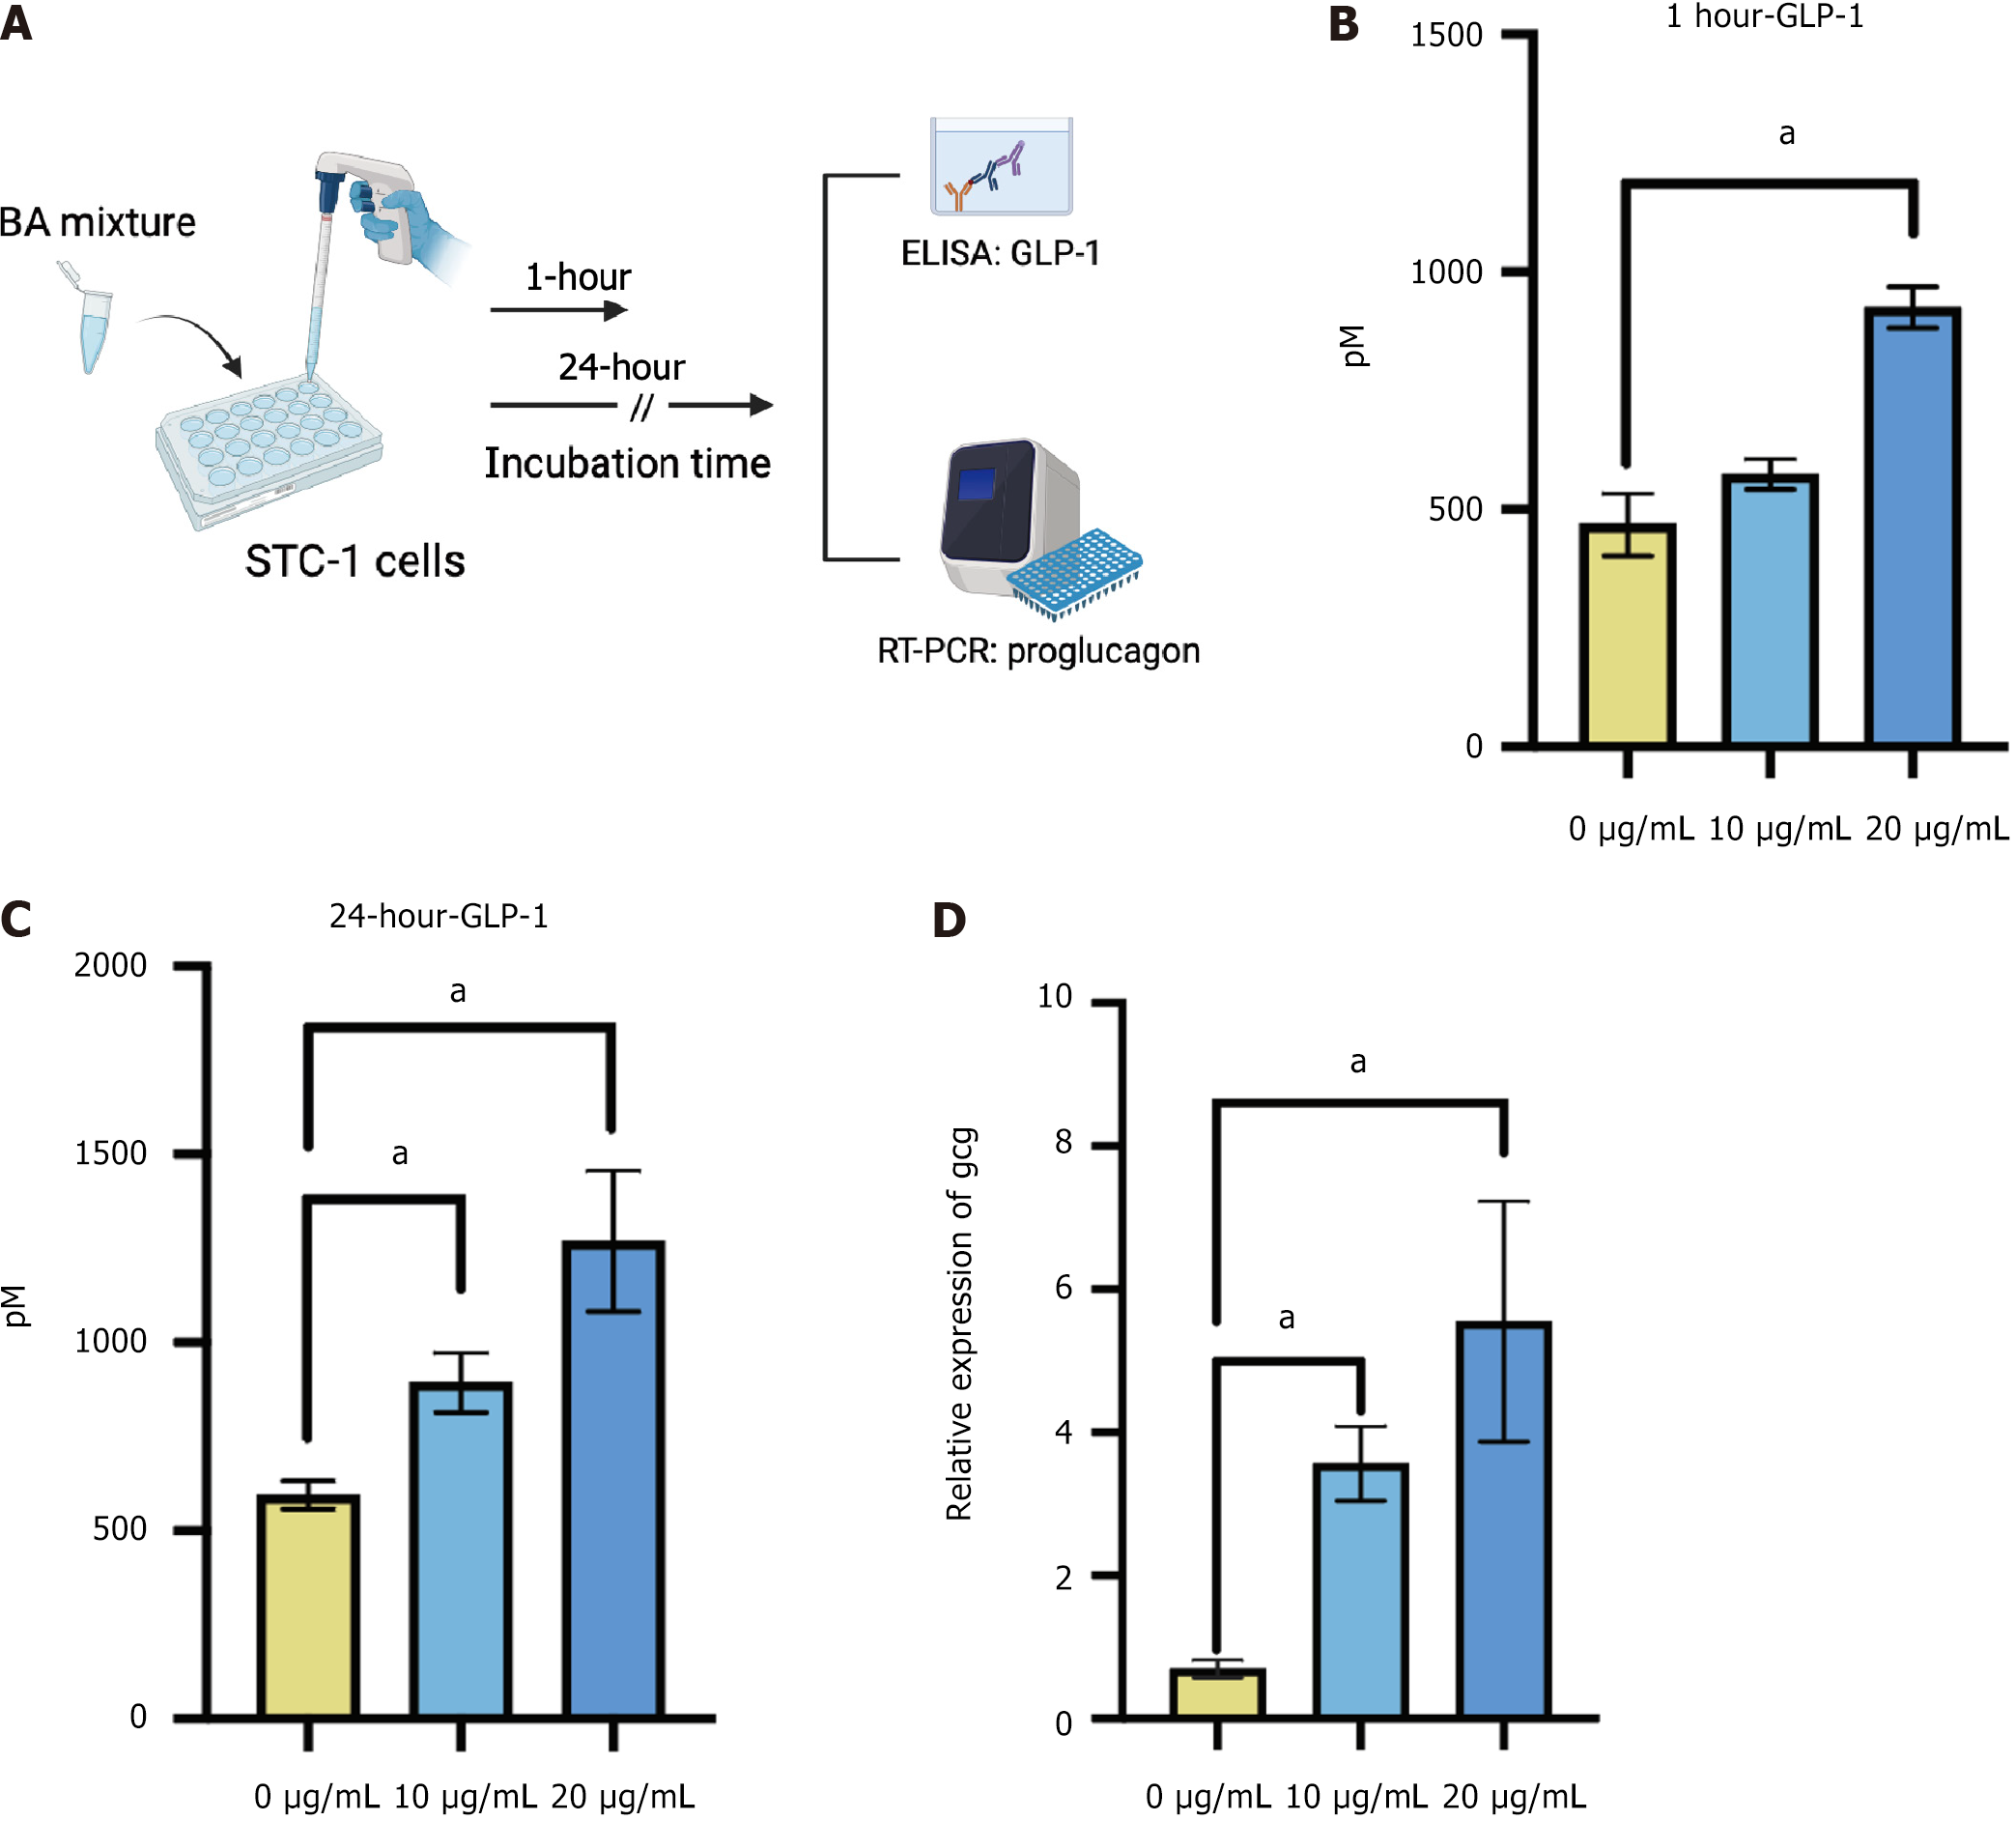
Figure 3 Bile acid mixture stimulated glucagon-like peptide-1 secretion in STC-1 cells.
A: Schematic diagram. STC-1 cells were treated with 0, 10, and 20 μg/mL of mixed bile acids for 1 hour or 24 hours to determine glucagon-like peptide-1 secretion and the proglucagon (Gcg) expression level; B: Glucagon-like peptide-1 levels in the medium after 1 hour of treatment; C: Glucagon-like peptide-1 levels in the medium after 24 hours of treatment; D: Relative expression levels of Gcg in STC-1 cells after 24 hours of treatment. Data are shown as mean ± SEM. P < 0.05 compared between groups. Statistical analysis was performed using the Student’s t-test. aP < 0.05. BA: Bile acid; ELASA: Enzyme-linked immunosorbent assay; RT-PCR: Real-time polymerase chain reaction; GLP-1: Glucagon-like peptide-1.
- Citation: Sun YM, Kuang JL, Zhang HH, Xia XX, Wang JY, Zheng D, Zhou KJ, Tang YJ, Zhao AH, Jia W, Xie GX, Zheng XJ. Pig bile powder maintains blood glucose homeostasis by promoting glucagon-like peptide-1 secretion via inhibiting farnesoid X receptor. World J Diabetes 2025; 16(6): 103616
- URL: https://www.wjgnet.com/1948-9358/full/v16/i6/103616.htm
- DOI: https://dx.doi.org/10.4239/wjd.v16.i6.103616


