Published online Mar 15, 2024. doi: 10.4251/wjgo.v16.i3.919
Peer-review started: September 7, 2023
First decision: December 5, 2023
Revised: December 16, 2023
Accepted: February 2, 2024
Article in press: February 2, 2024
Published online: March 15, 2024
Processing time: 186 Days and 18.5 Hours
Treatment options for patients with gastric cancer (GC) continue to improve, but the overall prognosis is poor. The use of PD-1 inhibitors has also brought benefits to patients with advanced GC and has gradually become the new standard treatment option at present, and there is an urgent need to identify valuable biomarkers to classify patients with different characteristics into subgroups.
To determined the effects of differentially expressed immune-related genes (DEIRGs) on the development, prognosis, tumor microenvironment (TME), and treatment response among GC patients with the expectation of providing new biomarkers for personalized treatment of GC populations.
Gene expression data and clinical pathologic information were downloaded from The Cancer Genome Atlas (TCGA), and immune-related genes (IRGs) were searched from ImmPort. DEIRGs were extracted from the intersection of the differentially-expressed genes (DEGs) and IRGs lists. The enrichment pathways of key genes were obtained by analyzing the Kyoto Encyclopedia of Genes and Genomes (KEGGs) and Gene Ontology (GO) databases. To identify genes asso
We collected 412 GC and 36 adjacent tissue samples, and identified 3627 DEGs and 1311 IRGs. A total of 482 DEIRGs were obtained. GO analysis showed that DEIRGs were mainly distributed in immunoglobulin complexes, receptor ligand activity, and signaling receptor activators. KEGG pathway analysis showed that the top three DEIRGs enrichment types were cytokine-cytokine receptors, neuroactive ligand receptor interactions, and viral protein interactions. We ultimately obtained an immune-related signature based on 10 genes, including 9 risk genes (LCN1, LEAP2, TMSB15A mRNA, DEFB126, PI15, IGHD3-16, IGLV3-22, CGB5, and GLP2R) and 1 protective gene (LGR6). Kaplan-Meier survival analysis, receiver operating characteristic curve analysis, and risk curves confirmed that the risk model had good predictive ability. Multivariate COX analysis showed that age, stage, and risk score were independent prognostic factors for patients with GC. Meanwhile, patients in the low-risk group had higher tumor mutation burden and immunophenotype, which can be used to predict the immune checkpoint inhibitor response. Both cytotoxic T lymphocyte antigen4+ and programmed death 1+ patients with lower risk scores were more sensitive to immunotherapy.
In this study a new prognostic model consisting of 10 DEIRGs was constructed based on the TME. By providing risk factor analysis and prognostic information, our risk model can provide new directions for immunotherapy in GC patients.
Core Tip: We ultimately obtained an Immune Related Signature based on 10 genes, including 9 risk genes (LCN1, LEAP2, TMSB15A mRNA, DEFB126, PI15, IGHD3-16, IGLV3-22, CGB5, GLP2R) and 1 protective gene (LGR6). Kaplan-Meier survival analysis, ROC analysis and risk curve confirmed that the risk model has good predictive ability. Multivariate COX analysis showed that age, stage and risk score were independent prognostic factors. Patients in the low-risk group had higher tumor mutation burden and immunophenotype score, which can be used to predict immune checkpoint inhibitor response. Both cytotoxic T lymphocyte antigen4+ and programmed death 1+ patients with lower risk scores were more sensitive to immunotherapy.
- Citation: Ma XT, Liu X, Ou K, Yang L. Construction of an immune-related gene signature for overall survival prediction and immune infiltration in gastric cancer. World J Gastrointest Oncol 2024; 16(3): 919-932
- URL: https://www.wjgnet.com/1948-5204/full/v16/i3/919.htm
- DOI: https://dx.doi.org/10.4251/wjgo.v16.i3.919
Gastric cancer (GC) is a common malignant tumor of the digestive tract and the fourth most common malignant tumor. In fact, GC is the second most common cause of death among malignant tumors worldwide[1]. Most GC patients are diagnosed with tumors that have already reached an advanced stage. Although surgery is the only way to perform radical treatment, patients with stage II and above GC have a higher postoperative recurrence rate and a lower 5-year survival rate. Therefore, the combination of surgical and medical treatments has become the accepted treatment mode for locally advanced GC. In addition, > 80% of GC patients are diagnosed at an advanced stage, most of whom have extensive invasion and distant metastasis, and are thus not candidates for radical surgery. Despite the continuous improvement in treatment options for patients with GC, the overall prognosis is poor, traditional chemotherapy drugs have entered a difficult period, and the selection of targeted drugs is limited.
Recently, immune checkpoint inhibitors (ICIs), such as programmed death 1(PD-1)/programmed cell death ligand 1 (PD-L1) or cytotoxic T lymphocyte antigen 4 (CTLA4) inhibitors, have become treatment options for various types of cancer. The use of PD-1 inhibitors has also yielded benefits to patients with advanced GC, gradually becoming the current new standard treatment option; however, not all patients benefit from PD-1 inhibitor treatment. At present, in addition to the microsatellite instability-high status, the predictive value of the PD-L1 combined positive score is still controversial. Other prognostic factors, such as tumor mutation burden (TMB)-high, are still uncertain. Therefore, there is an urgent need to identify valuable biomarkers with which to assign patients with different characteristics into subgroups. Immune-related genes (IRGs) have been shown to be significantly associated with individual or partial pathways of immune responses. IRGs participate in the activation of immune cells, migration of immune cells, and release of inflammatory factors, and thus have important roles in the occurrence and development of cancer[2,3]. Research has shown that IRGs can serve as biomarkers for predicting the prognosis of cancer patients[4].
An increasing number of studies have shown that the tumor microenvironment (TME) is the main cause of tumor invasion, which affects the tumor response to immunotherapy. The TME refers to the tissue environment composed of tumor cells, immune cells, mesenchymal cells and their secreted active mediators[5]. Studies have shown that infiltrating immune cells in TME have a crucial role in cancer initiation, invasiveness, and therapeutic response[6,7].
In this study, we established a risk score model for differentially expressed IRGs (DEIRGs) to determine the impact on the development, prognosis, TME, and treatment response of GC patients and to provide a new biomarker for personalized treatment of GC populations.
Gene expression data and clinical pathologic information were sourced from The Cancer Genome Atlas (TCGA) utilizing the ImmPort database (https://www.immport.org/shared/genelists) search for IRGs. Based on clinical data, samples with a missing overall survival (OS) time or 0 d were excluded. The pre-treated TCGA-stomach adenocarcinoma (STAD) dataset consisted of 412 tumor and 36 adjacent tissue samples.
According to the |log2 (fold change)| > 1 and false discovery rate (FDR) < 0.05 criteria, the ‘limma’ package of R was used to search for differentially-expressed genes (DEGs) between the 412 and 36 adjacent tissue samples in the TCGA-STAD dataset. The ‘pheatmap’ package was used to visualize DEGs using volcano plots.
By reading IRGs and DEGs respectively, intersection genes and DEIRGs were obtained, and a Venn diagram was made for differences. According to the expression of intersection genes, the ‘ggplot2’ software package was used to visualize DEIRGs with heatmap.
The Kyoto Encyclopedia of Genes and Genomes (KEGG) and Gene Ontogeny (GO) databases were analyzed using R packages (‘clusterProfiler,’ ‘org.Hs.eg.db,’ ‘DOSE,’ and ‘enrichplot’) to observe the enrichment of DEIRGs in functional pathways, then bar and bubble charts were drawn. P values and q-values < 0.05 were considered statistically significant for GO- and KEGG-enriched pathways, respectively.
To obtain immune genes related to prognosis, we constructed a tumor risk score model based on IRGs. First, univariate Cox regression analysis was performed to determine the DEIRGs which related to survival (P < 0.05). The results are presented as forest plots. Then, Least Absolute Shrinkage and Selection Operator (LASSO) regression analysis was used to screen variables and eliminate genes with high correlation to reduce the number of genes in the risk model and prevent over-fitting of the model. Finally, multivariate Cox regression was used to establish a risk score model, and GC patients were divided into high- and low-risk groups according to the median risk score. To evaluate the feasibility of the model, we randomly divided the cohort into a 2:1 training cohort and a test cohort for internal validation. The calculation formula is as follows: Risk score = gene A expression × coefficient A + gene B expression × coefficient B + … + gene N expression × coefficient N.
To further verify the feasibility of the risk score, the clinical characteristics of the training and testing cohorts were analyzed, including age, gender, grade, T-primary tumor/lymph node/metastasis status, T stage, N stage, M stage, and other clinical characteristics. P values > 0.05 confirmed no significant difference between the two cohorts. OS was compared between the two groups by Kaplan-Meier curve using log-rank test. To evaluate the predictive performance of the risk score model, we used the ‘timeROC’ package to perform receiver operating characteristic (ROC) curve analysis.
Risk curves and survival status diagrams were plotted separately, and heatmaps were developed using the ‘pheatmap’ package to show differences in IRG expression profiles between the high- and low-risk groups.
Mutation data containing somatic variations were retrieved from the TCGA, and TMB counts were measured for each GC sample. The mutation state was studied using R package ‘maftools’ and GC mutation data from the TCGA database. The difference in TMB between high- and low-risk groups was compared, and the results are displayed using oncoprint and boxplot.
The infiltration of 22 immune cells in the sample was obtained using the ‘CIBERSORT’ package, and the infiltration of immune subgroups in the high- and the low-risk groups was analyzed. The GC immune score data were obtained, and the difference in immune scores between the high- and low-risk groups was analyzed. A P < 0.05 was considered statistically significant.
Data were processed, analyzed, and presented using R software (version 4.1.2) and the related software packages. P < 0.05 (two-tailed) was considered valuable.
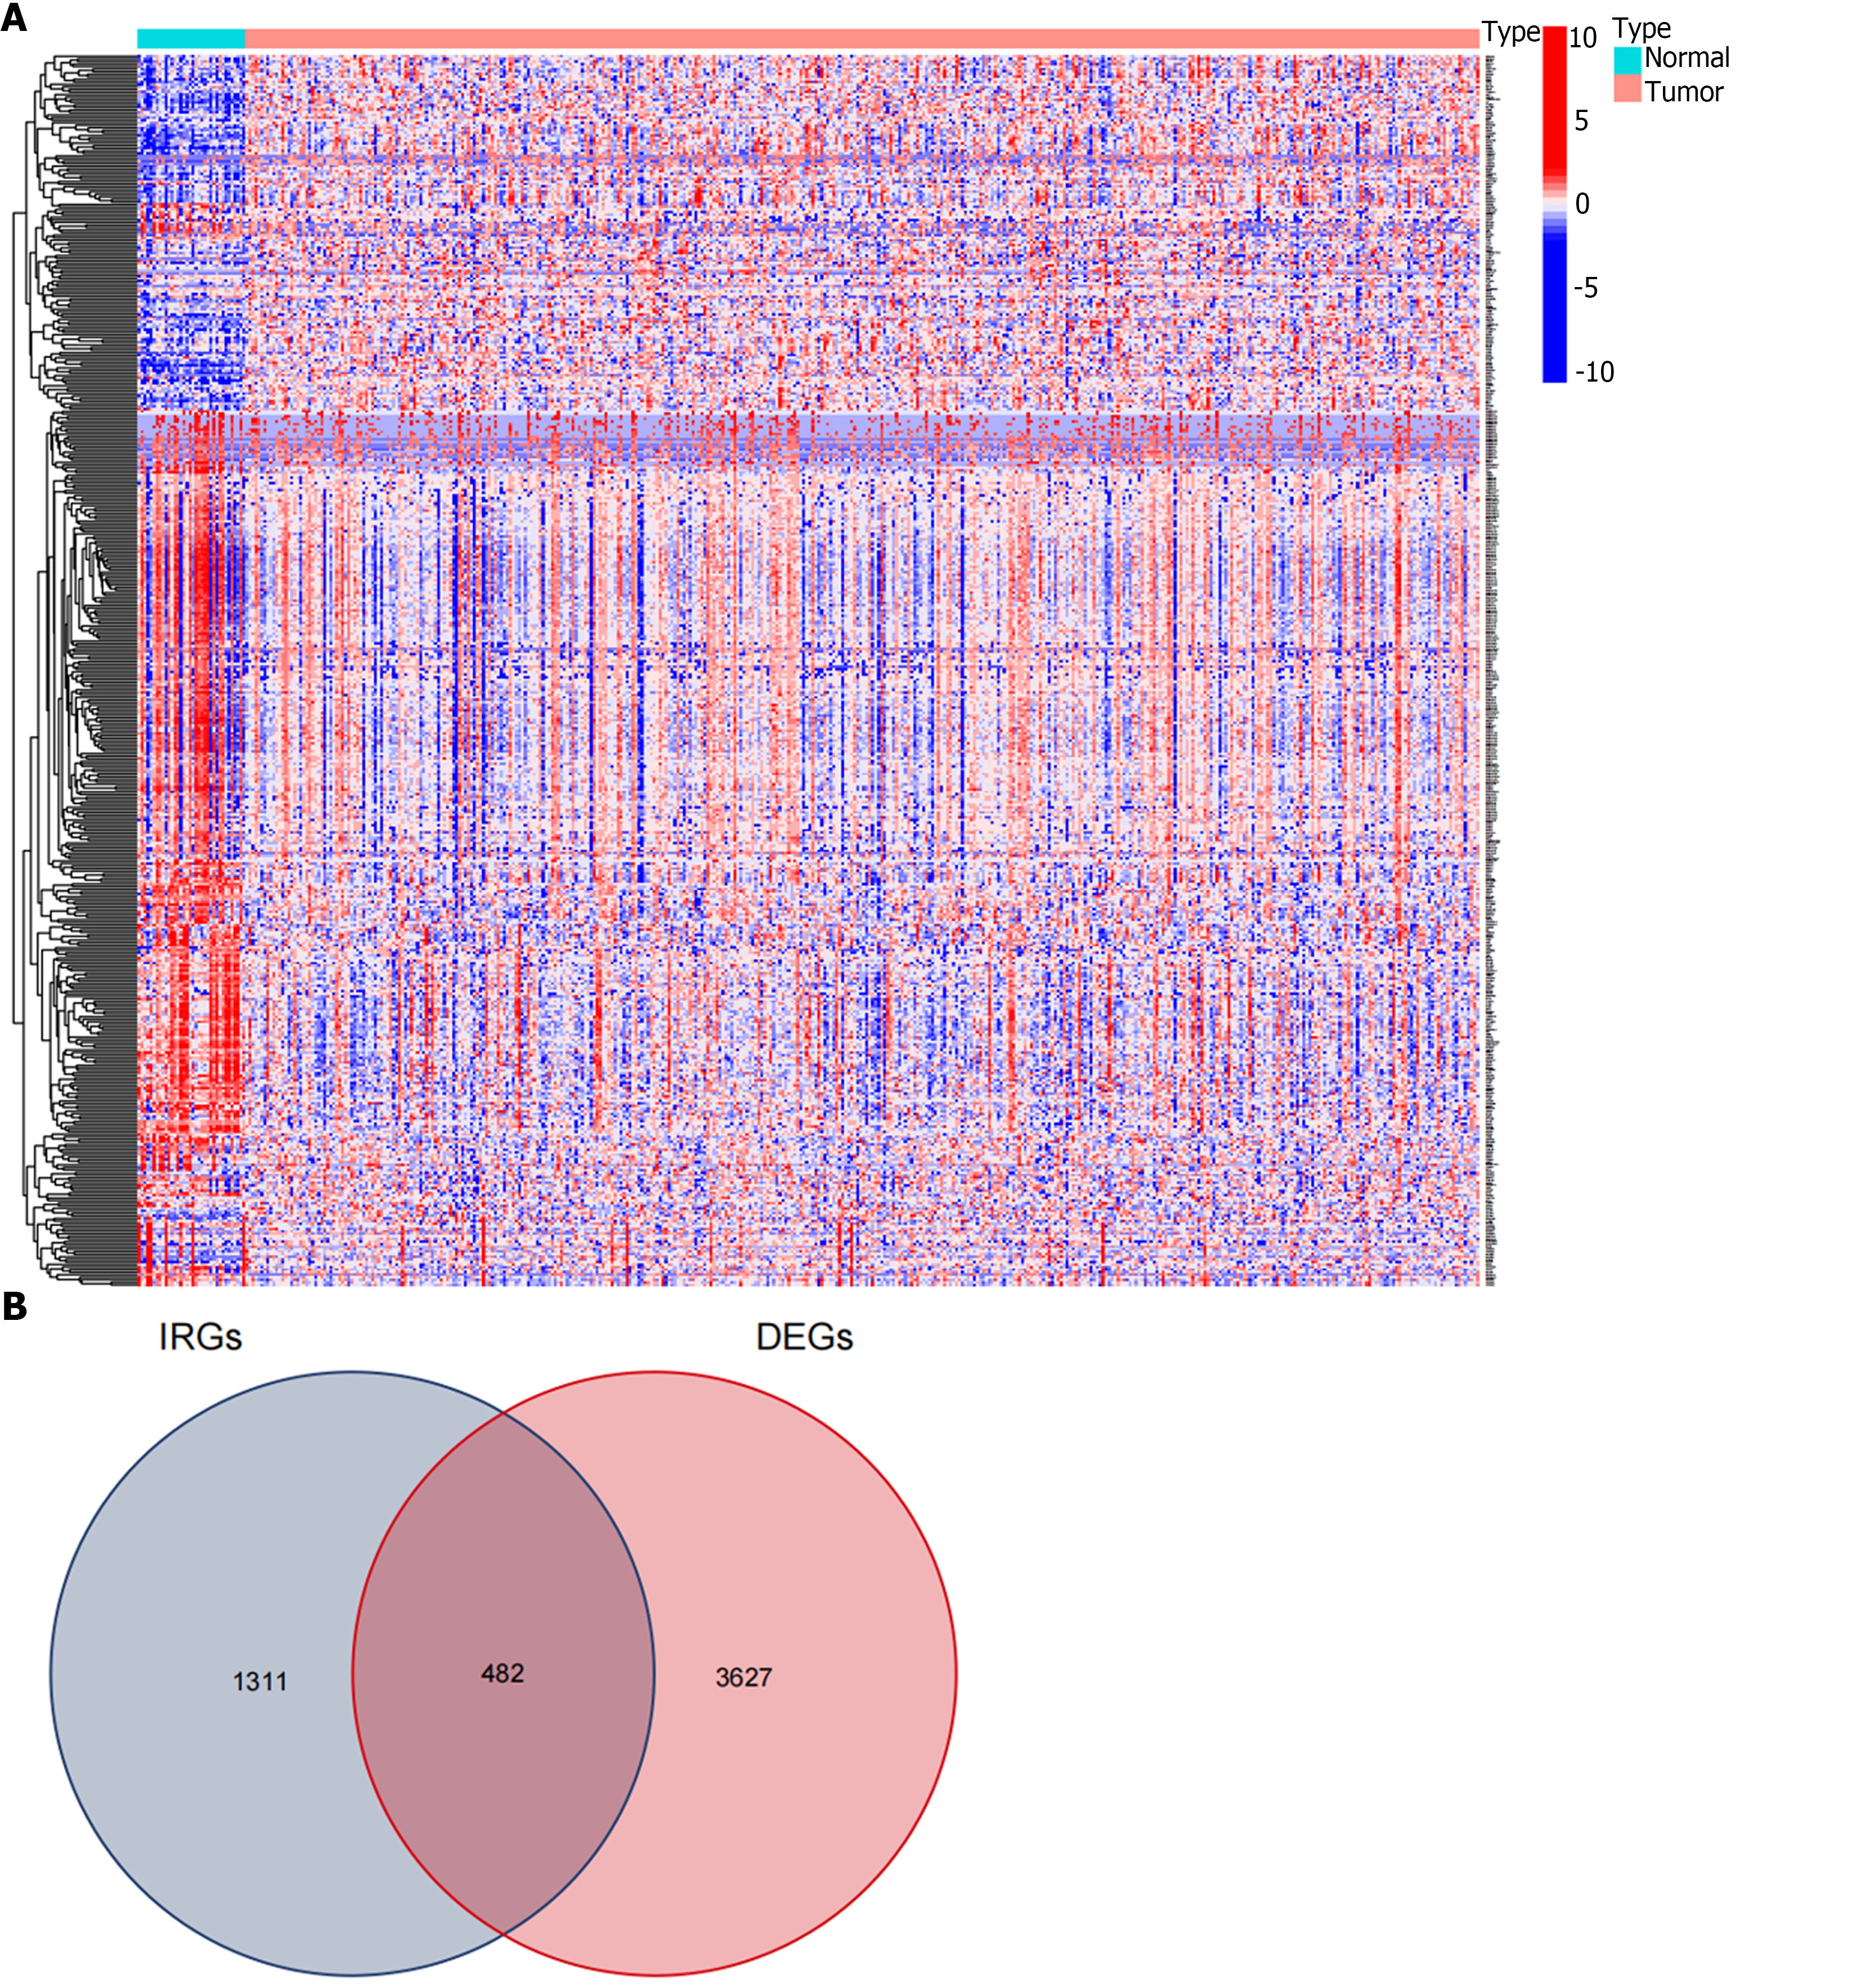
We first identified 412 GC and 36 adjacent tissue samples using the TCGA-STAD dataset. We set the screening threshold to |log2 (fold change)| > 1 and FDR < 0.05 in the differential expression analysis of the R software ‘limma’ package, and identified 3627 DEGs (Figure 1A). A total of 1311 IRGs were obtained in the IRG list from ImmPort. A total of 482 DEIRGs were extracted from the intersection of the DEGs and IRGs lists (Figure 1B).
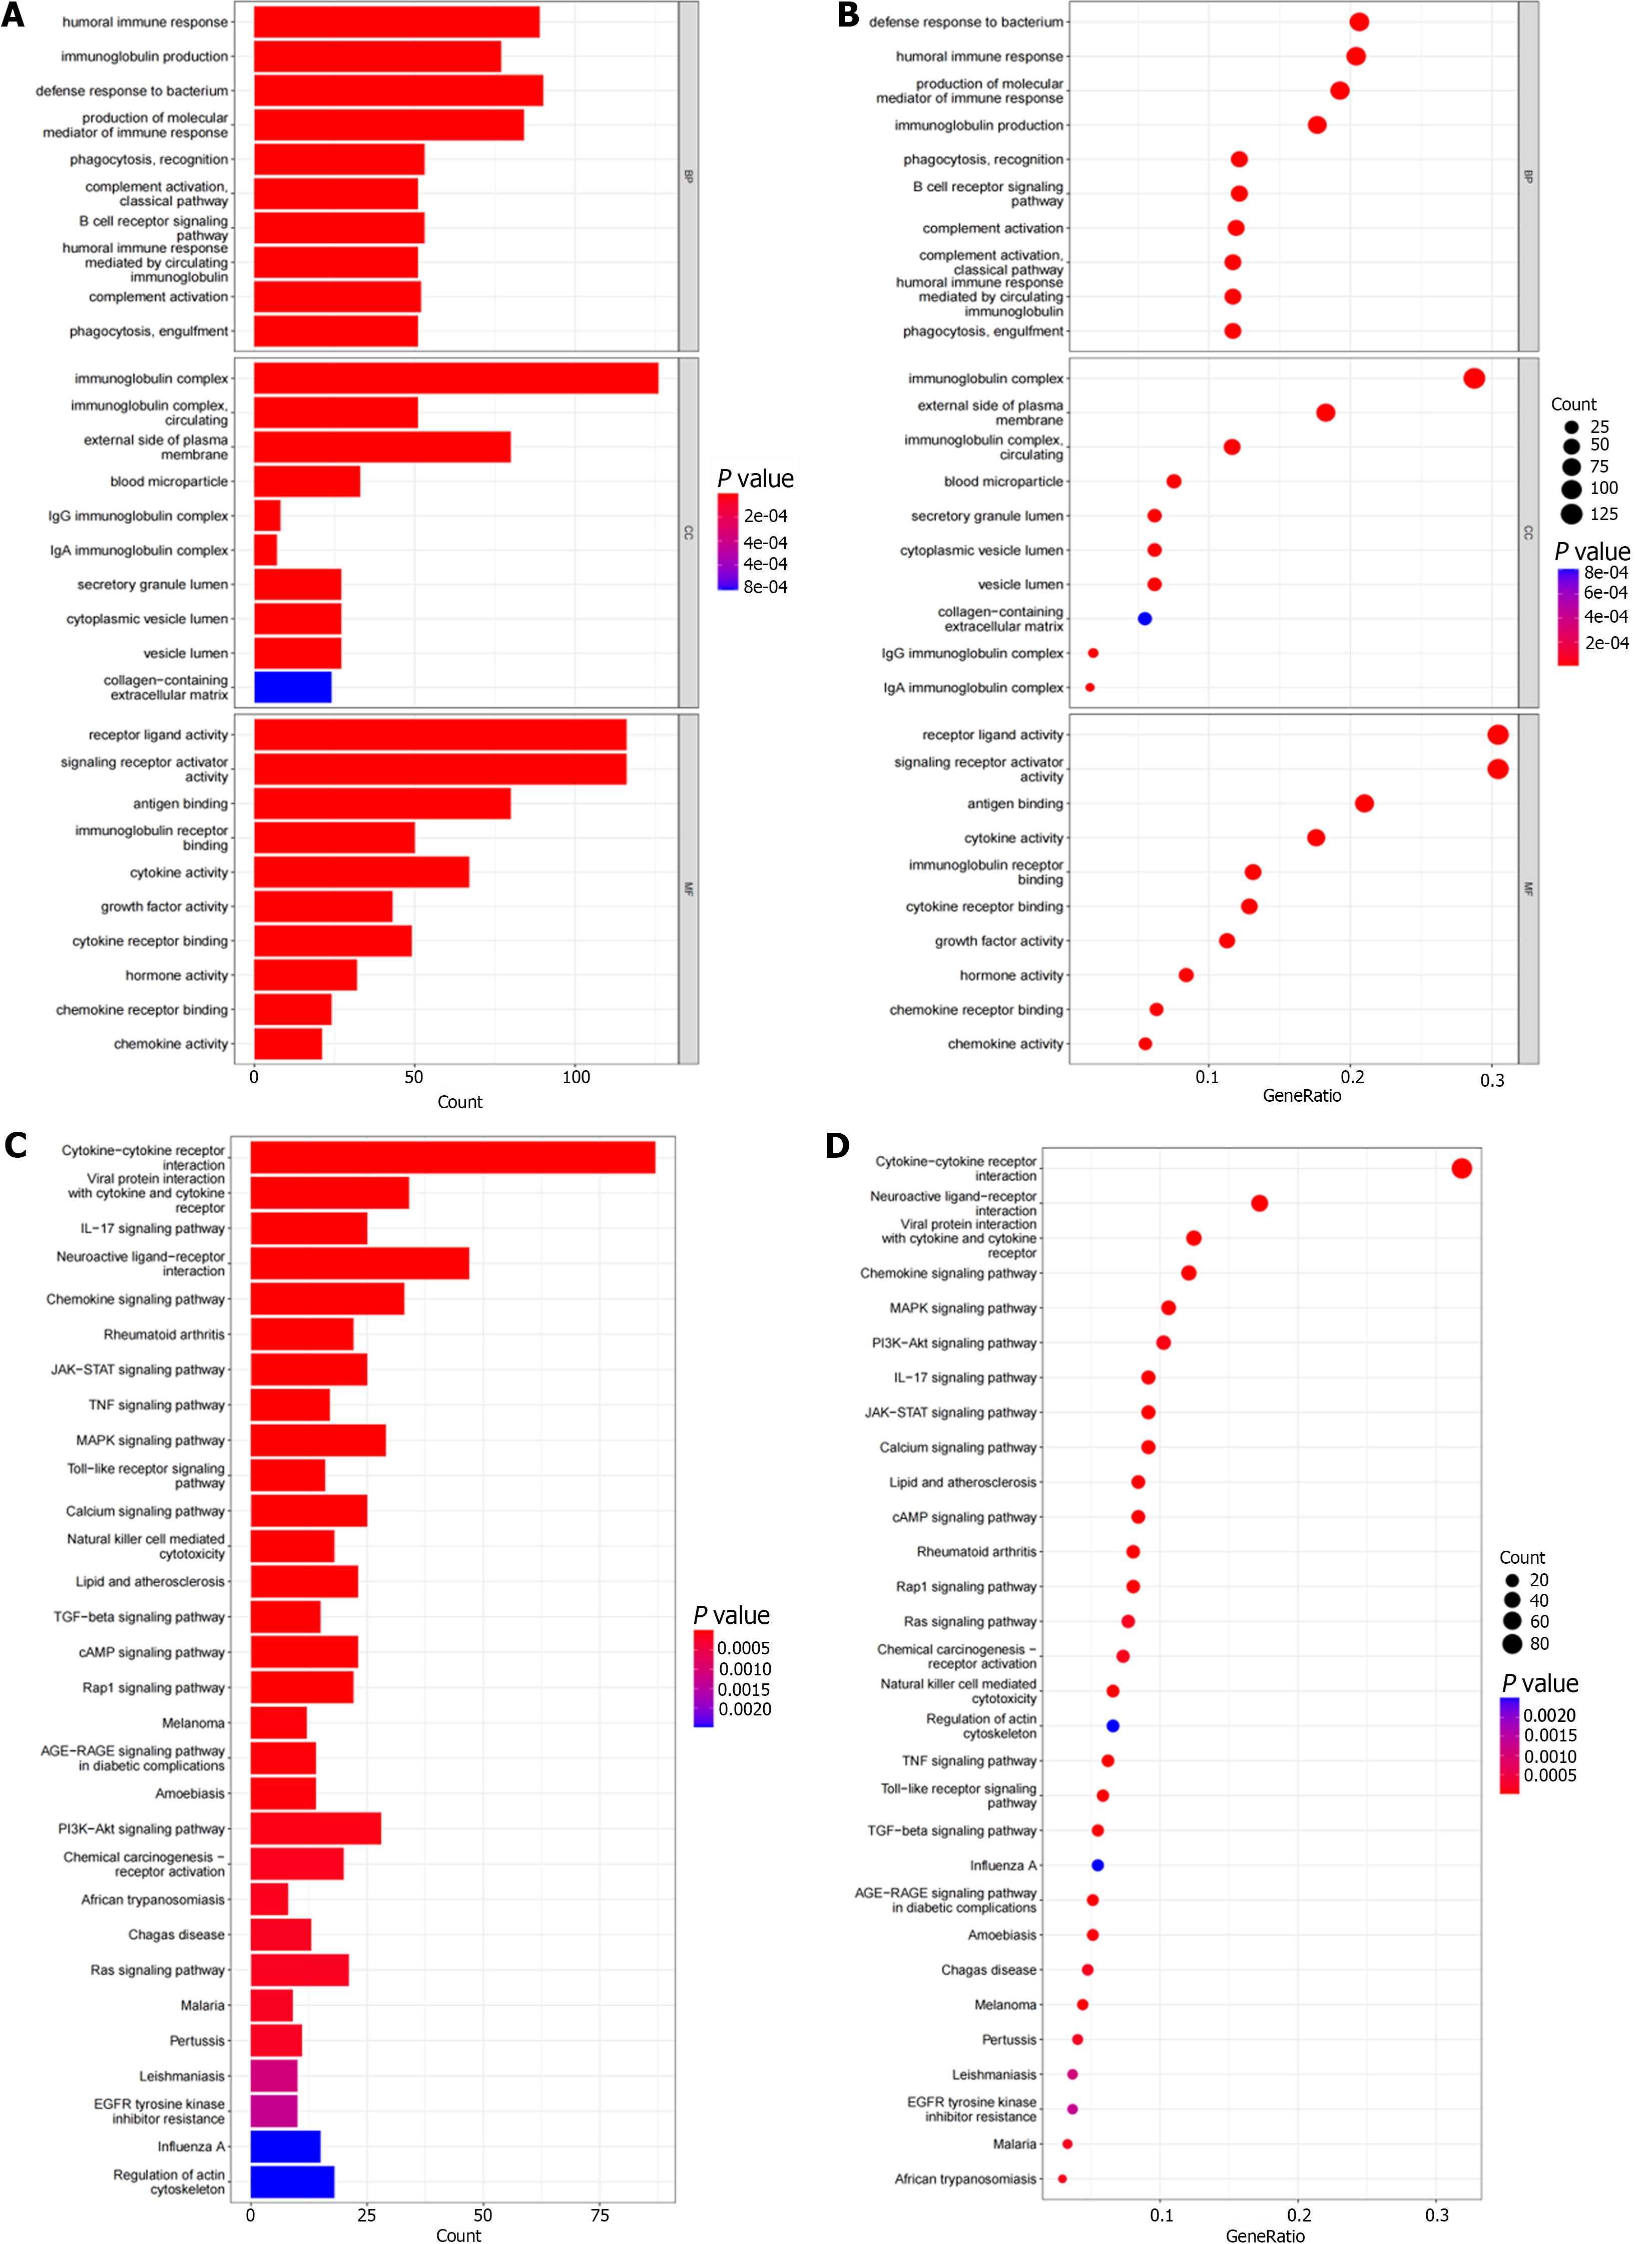
We performed functional enrichment analysis based on identified genes in the GO and KEGG pathways. The top 10 pathways enriched in 3 functional categories (BP, CC, and MF) in GO analysis are shown by bubble and bar charts. The DEIRGs were mainly distributed in immunoglobulin complexes, receptor ligand activity, and signaling receptor activators (Figure 2A and B). KEGG pathway analysis showed that the first three DEIRGs enrichment types were cytokine-cytokine receptors, neuroactive ligand receptor interactions, and viral protein interactions (Figure 2C and D).
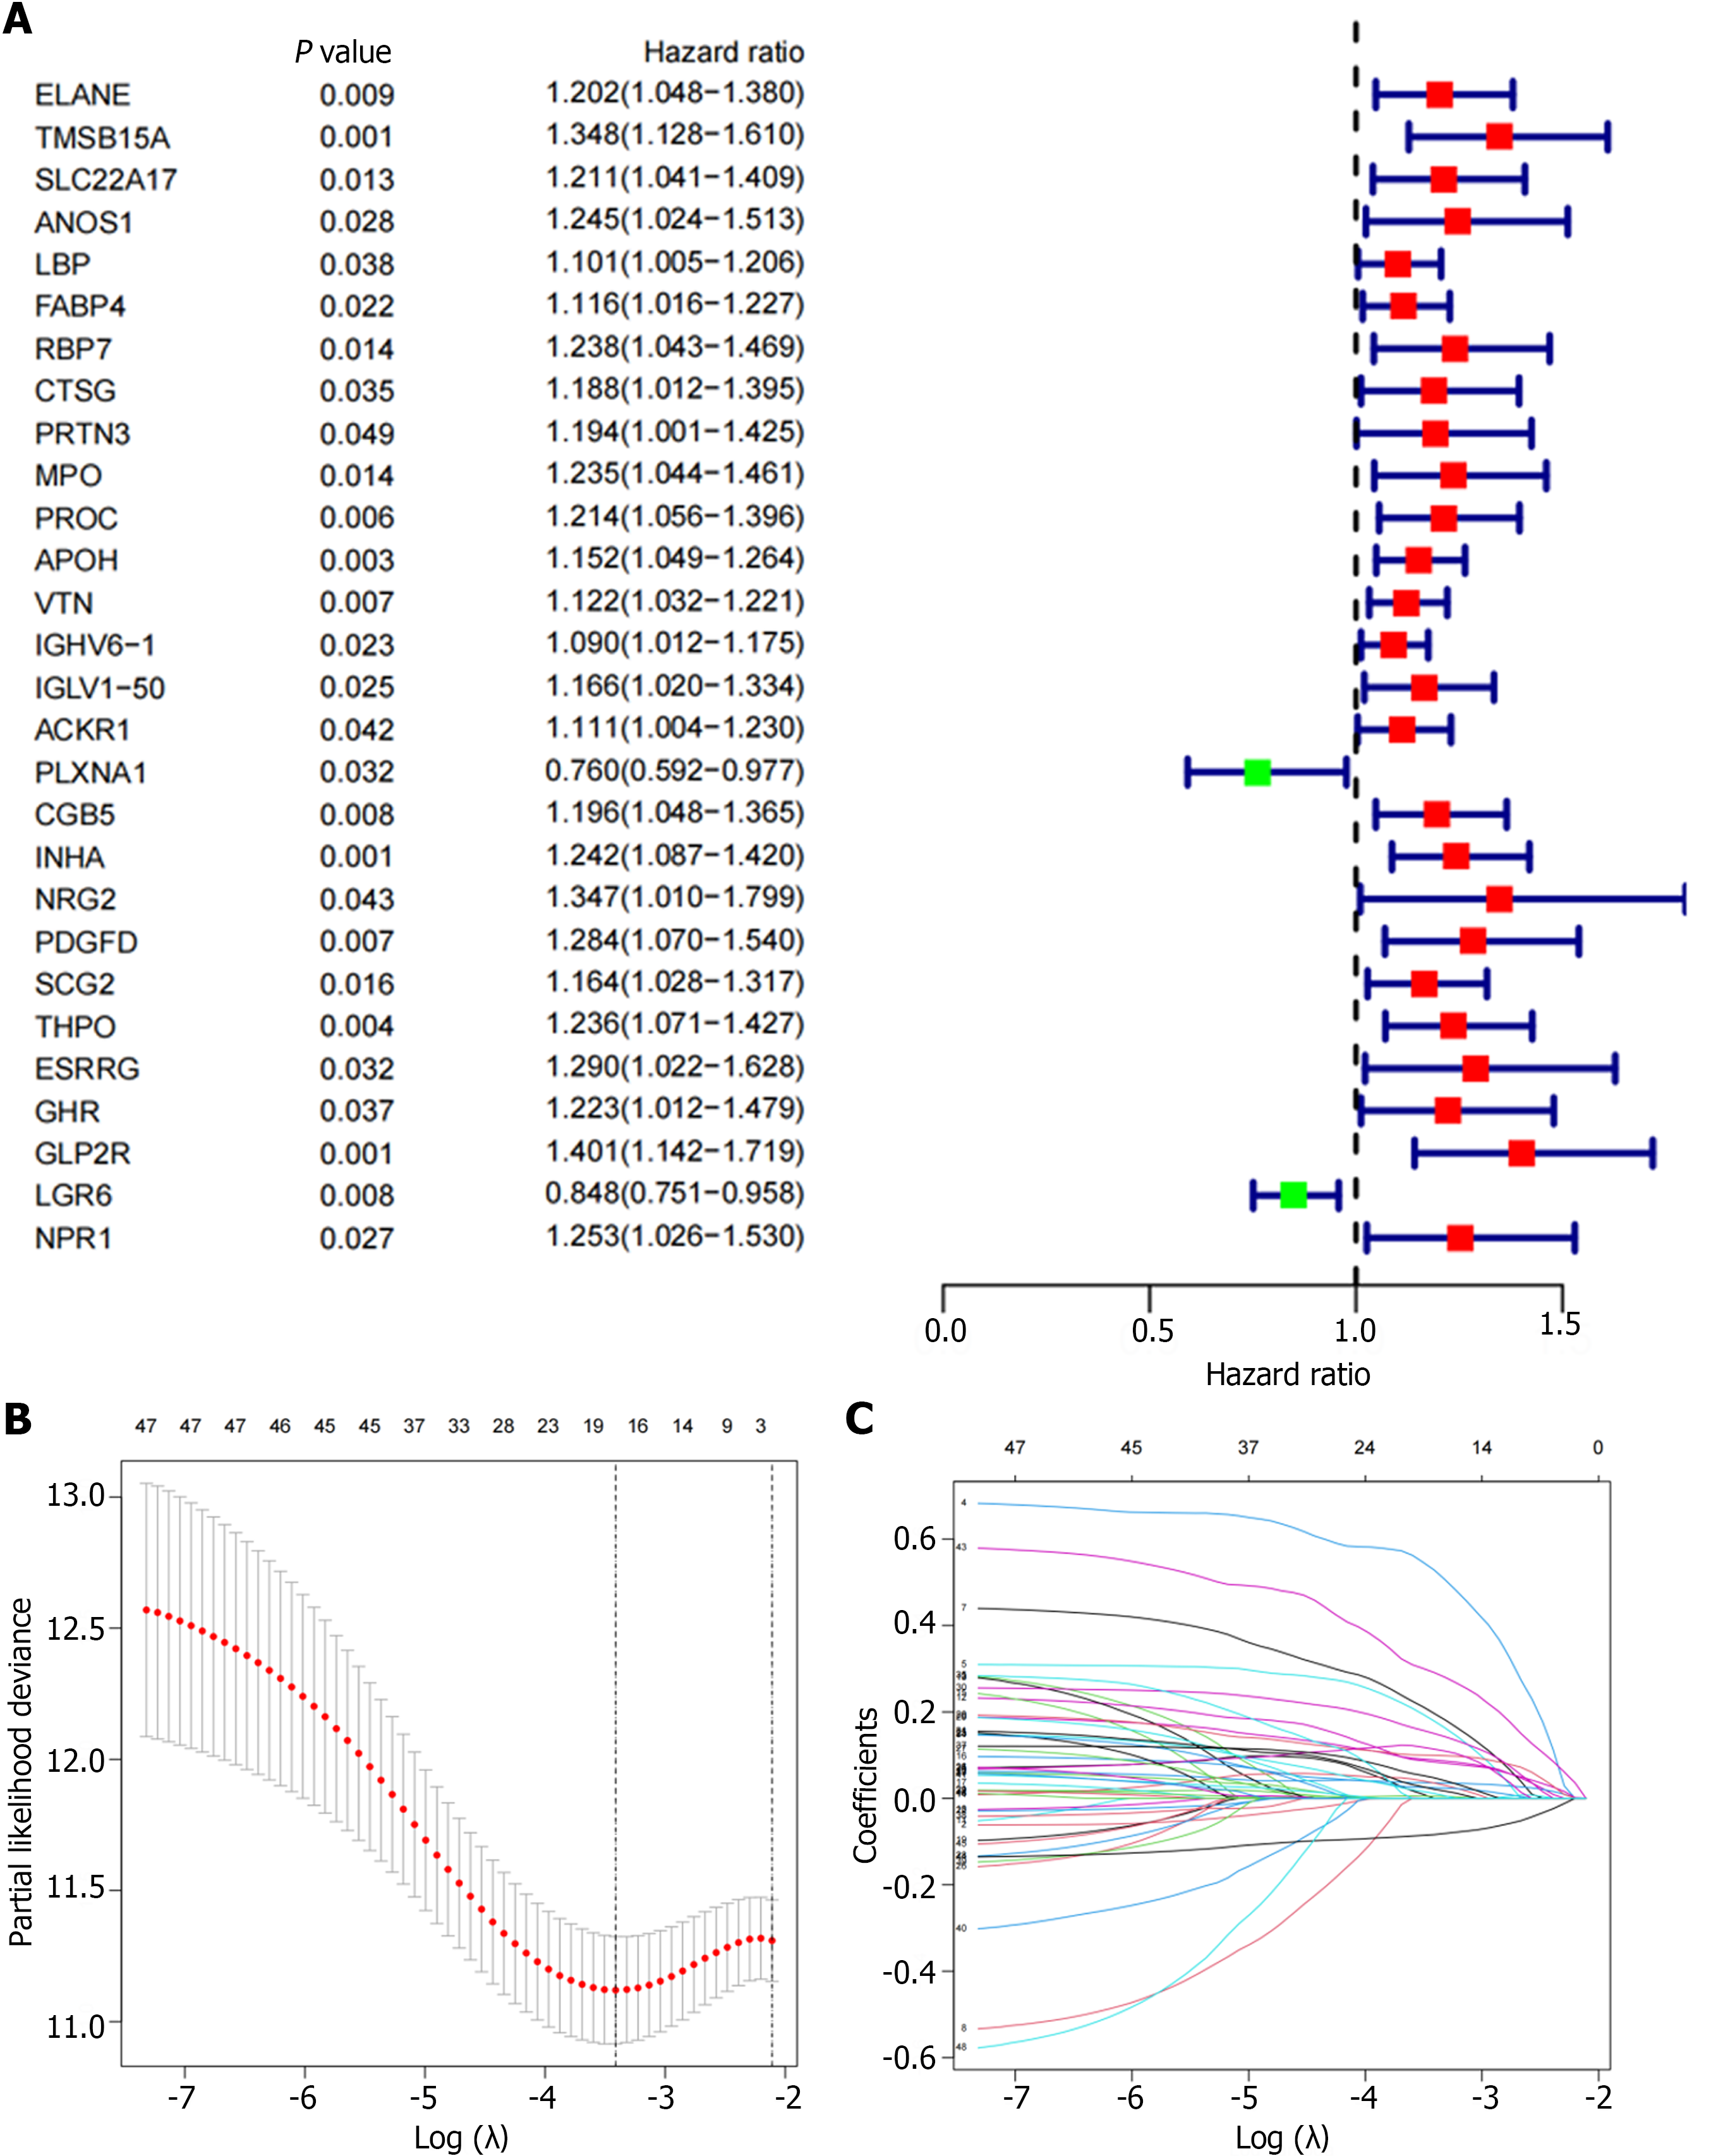
We randomly divided the cohort into a 2:1 training cohort and a testing cohort for internal verification. The expression of 48 DEIRGs in GC patients was statistically significant based on univariate Cox regression analysis (Figure 3A). We used the LASSO algorithm to identify these DEIRGs (Figure 3B and C). Multivariate Cox regression analysis was performed for the above DEIRGs to determine the prognostic characteristics. We obtained an immune-related signature based on 10 genes in the training cohort, as follows: Risk score = LCN1 mRNA expression level × 0.797234455489025 + LEAP2 mRNA expression level × 0.360879313341945 + TMSB15A mRNA expression level × 0.169974119204932 + DEFB126 mRNA expression level × 0.371620785532426 + PI15 mRNA expression level × 0.152108920340092 + IGHD3-16 mRNA expression level × 0.149245094458141 + IGLV3-22 mRNA expression level × 0.176805538372338 + CGB5 mRNA expression level × 0.242547750831489 + GLP2R mRNA expression level × 0.465078727018208 - LGR6 mRNA expression level × 0.140512170786152 (Supplementary Figure 1). According to the median risk score, GC patients were divided into high- and a low-risk groups.
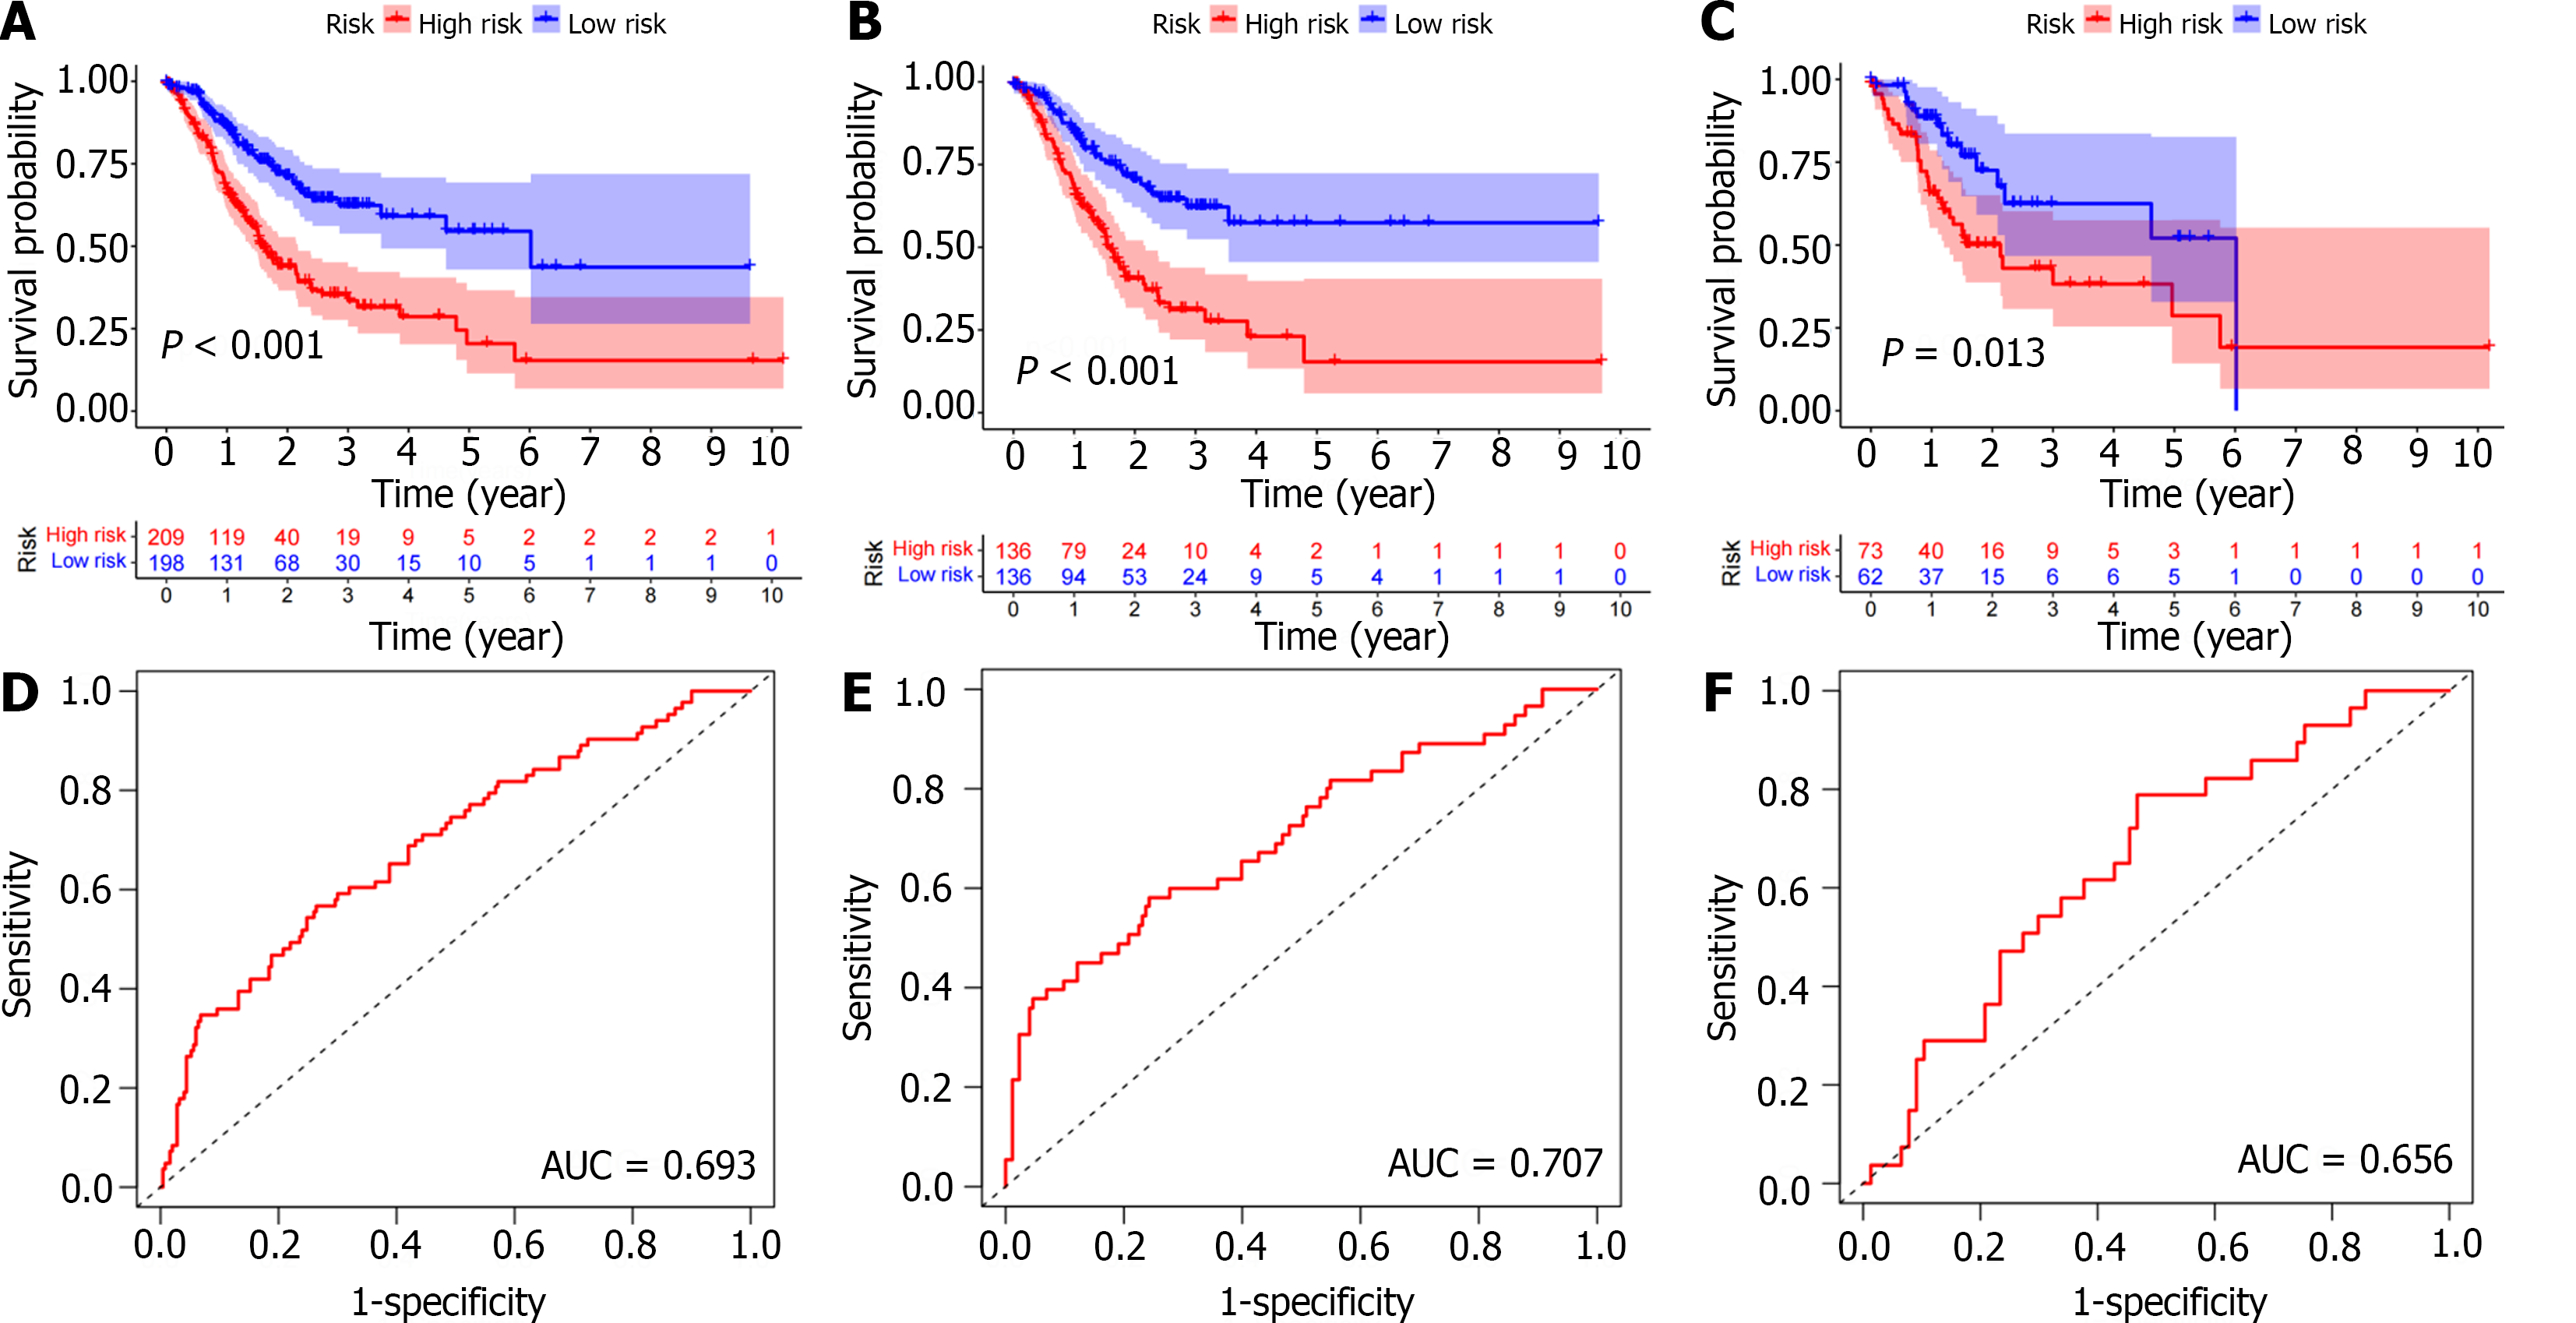
We then further confirmed the feasibility of this risk score by performing univariate Cox regression analysis for clinical pathologic factors and comparing high- and low-risk groups. There were no significant differences in age (‘≤ 65 years’ or ‘> 65 years’), gender (female or male), grade (G1-2 or G3), and tumor stage (stage I-II or III-IV) between the training and test cohorts. Furthermore, Kaplan-Meier survival analysis showed that the low-risk group had a significantly longer OS in both the training and test cohorts (P < 0.05; Figure 4A-C). In addition, the area under the ROC curve of the total population, training cohort, and test cohort were 0.693, 0.707, and 0.656, respectively, thus showing high predictive accuracy and reliability (Figure 4D-F). Therefore, we validated the feasibility of the immune-related signature.
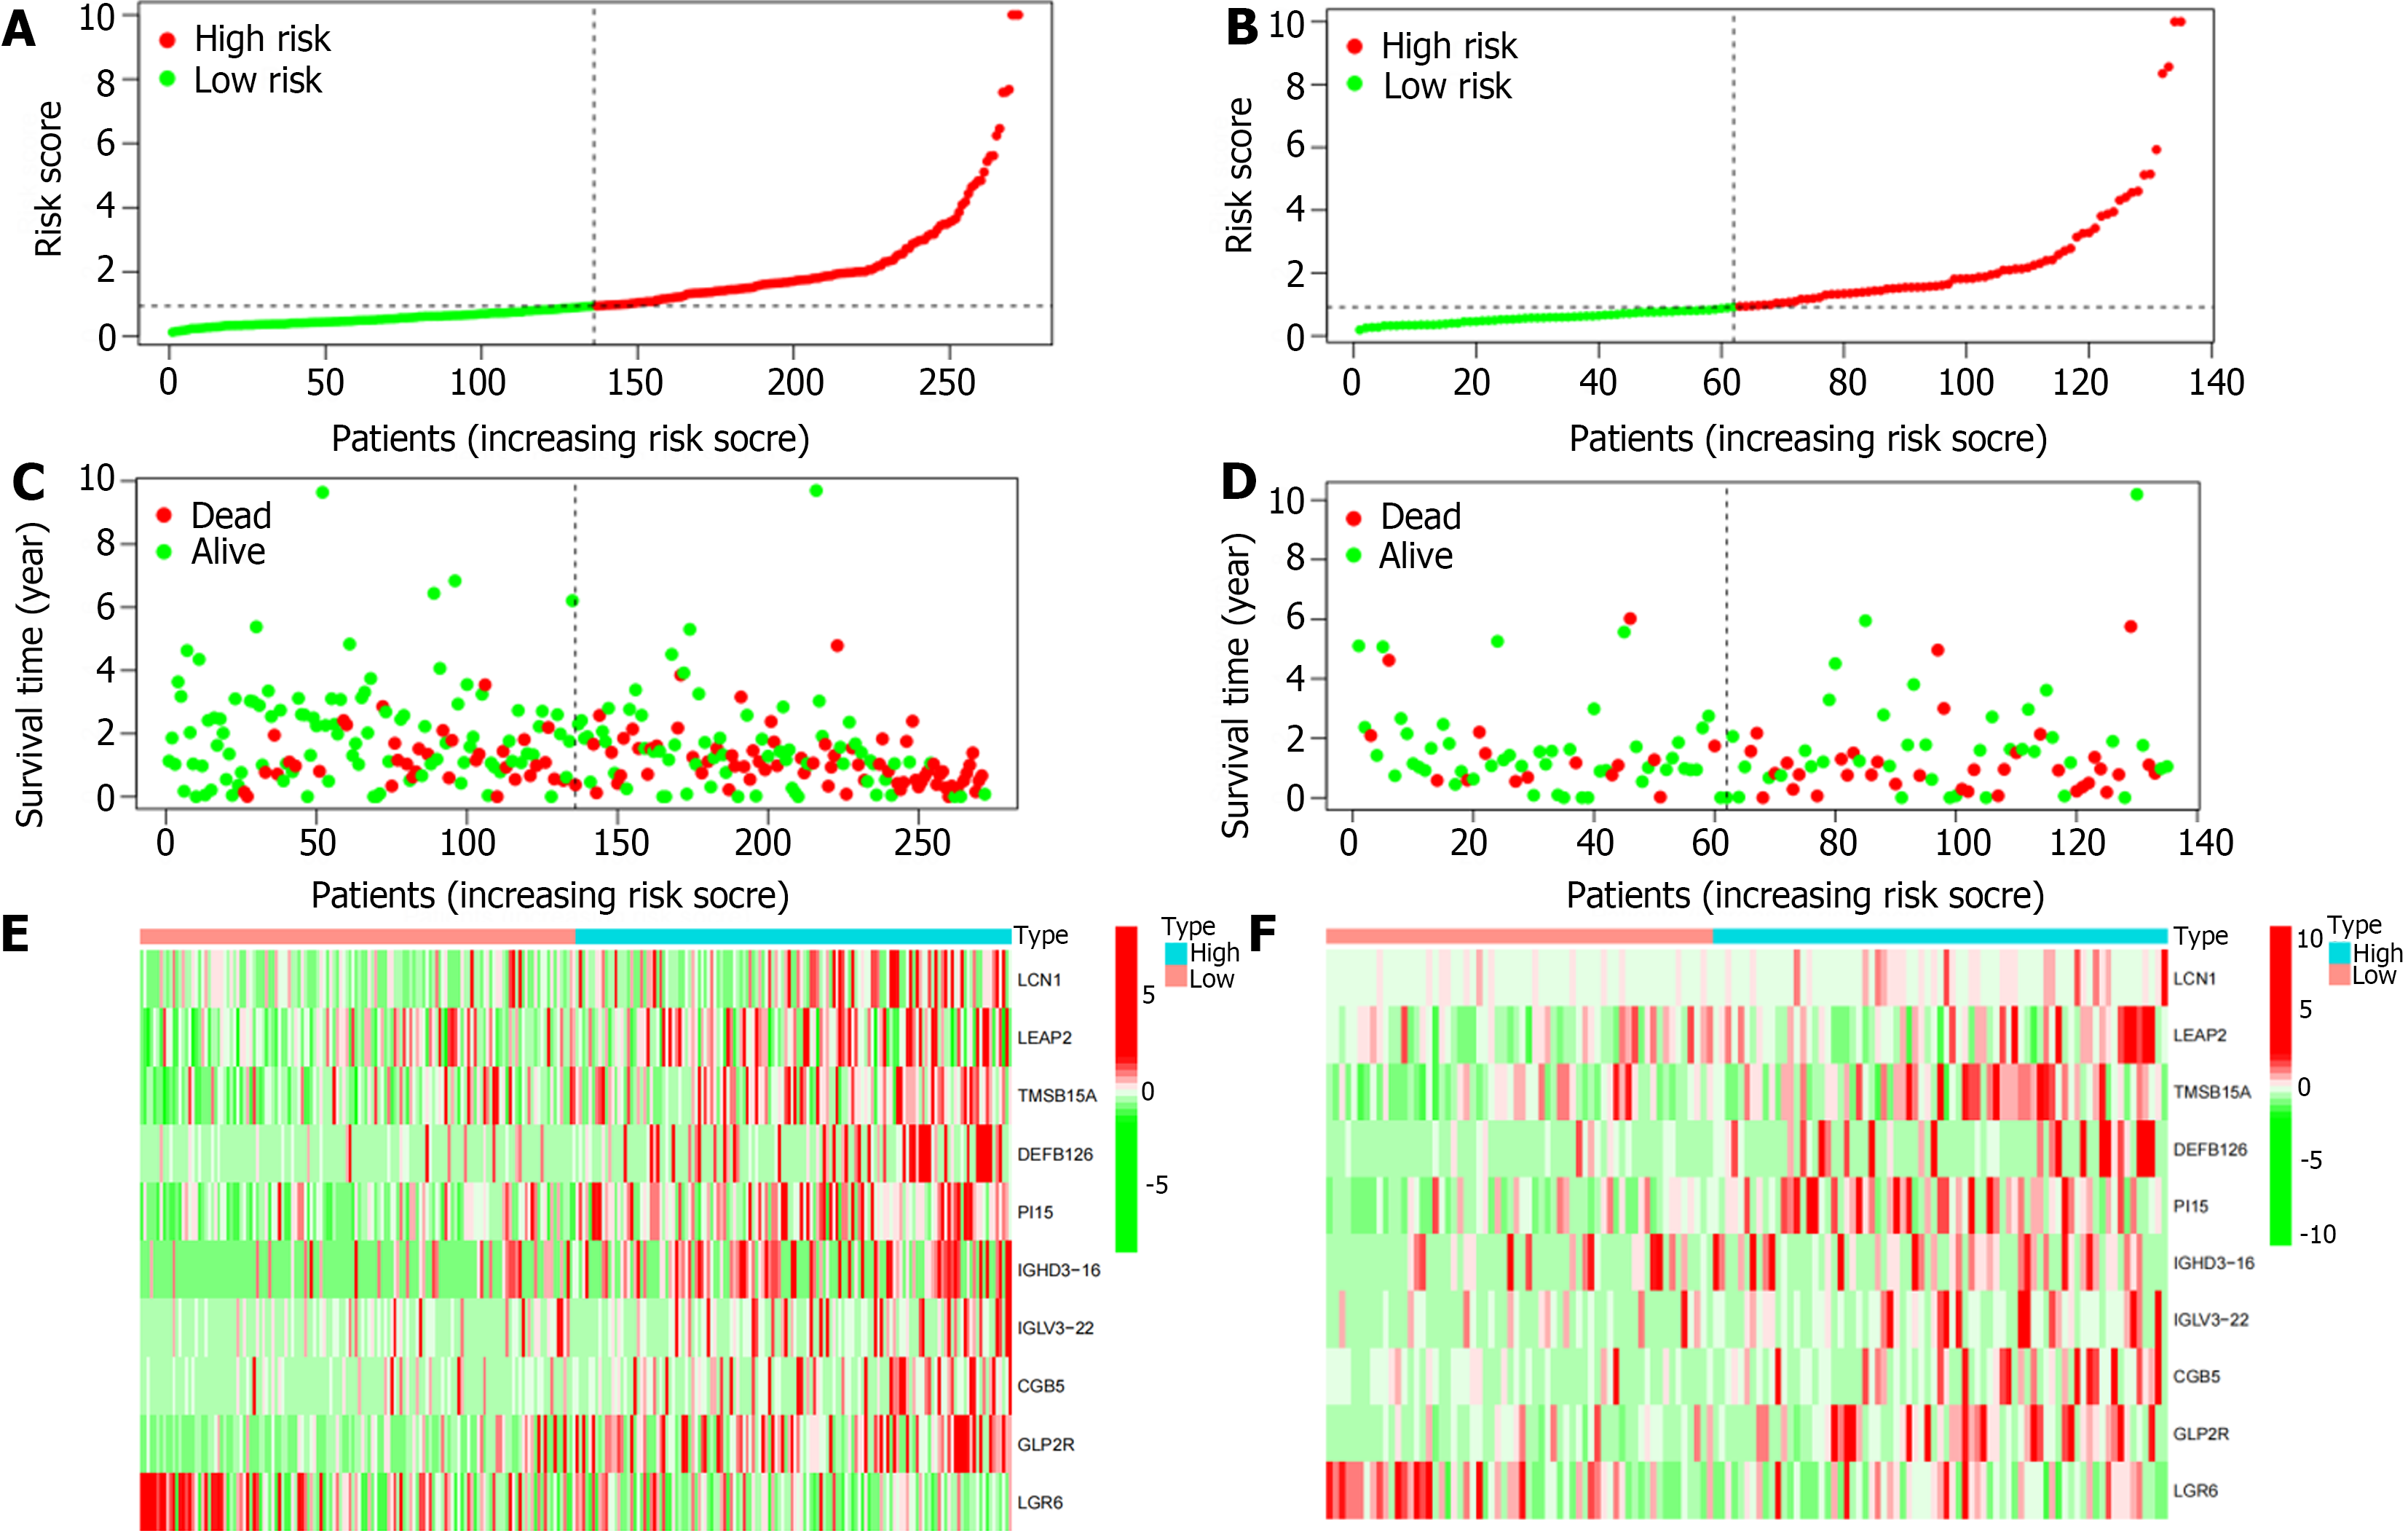
Based on this immune-related signature, there was a correlation between the patient’s risk score and GC mortality, with a higher score indicating a greater risk (Figure 5A and B). The scatter plot shows the correlation between survival time and risk score in GC patients (Figure 5C and D). As shown in the heatmap (Figure 5E and F), LCN1, LEAP2, TMSB15A, DEFB126, PI15, IGHD3-16, IGLV3-22, CGB5, and GLP2R were highly expressed in the high-risk group, while LGR6 was highly expressed in the low-risk group.
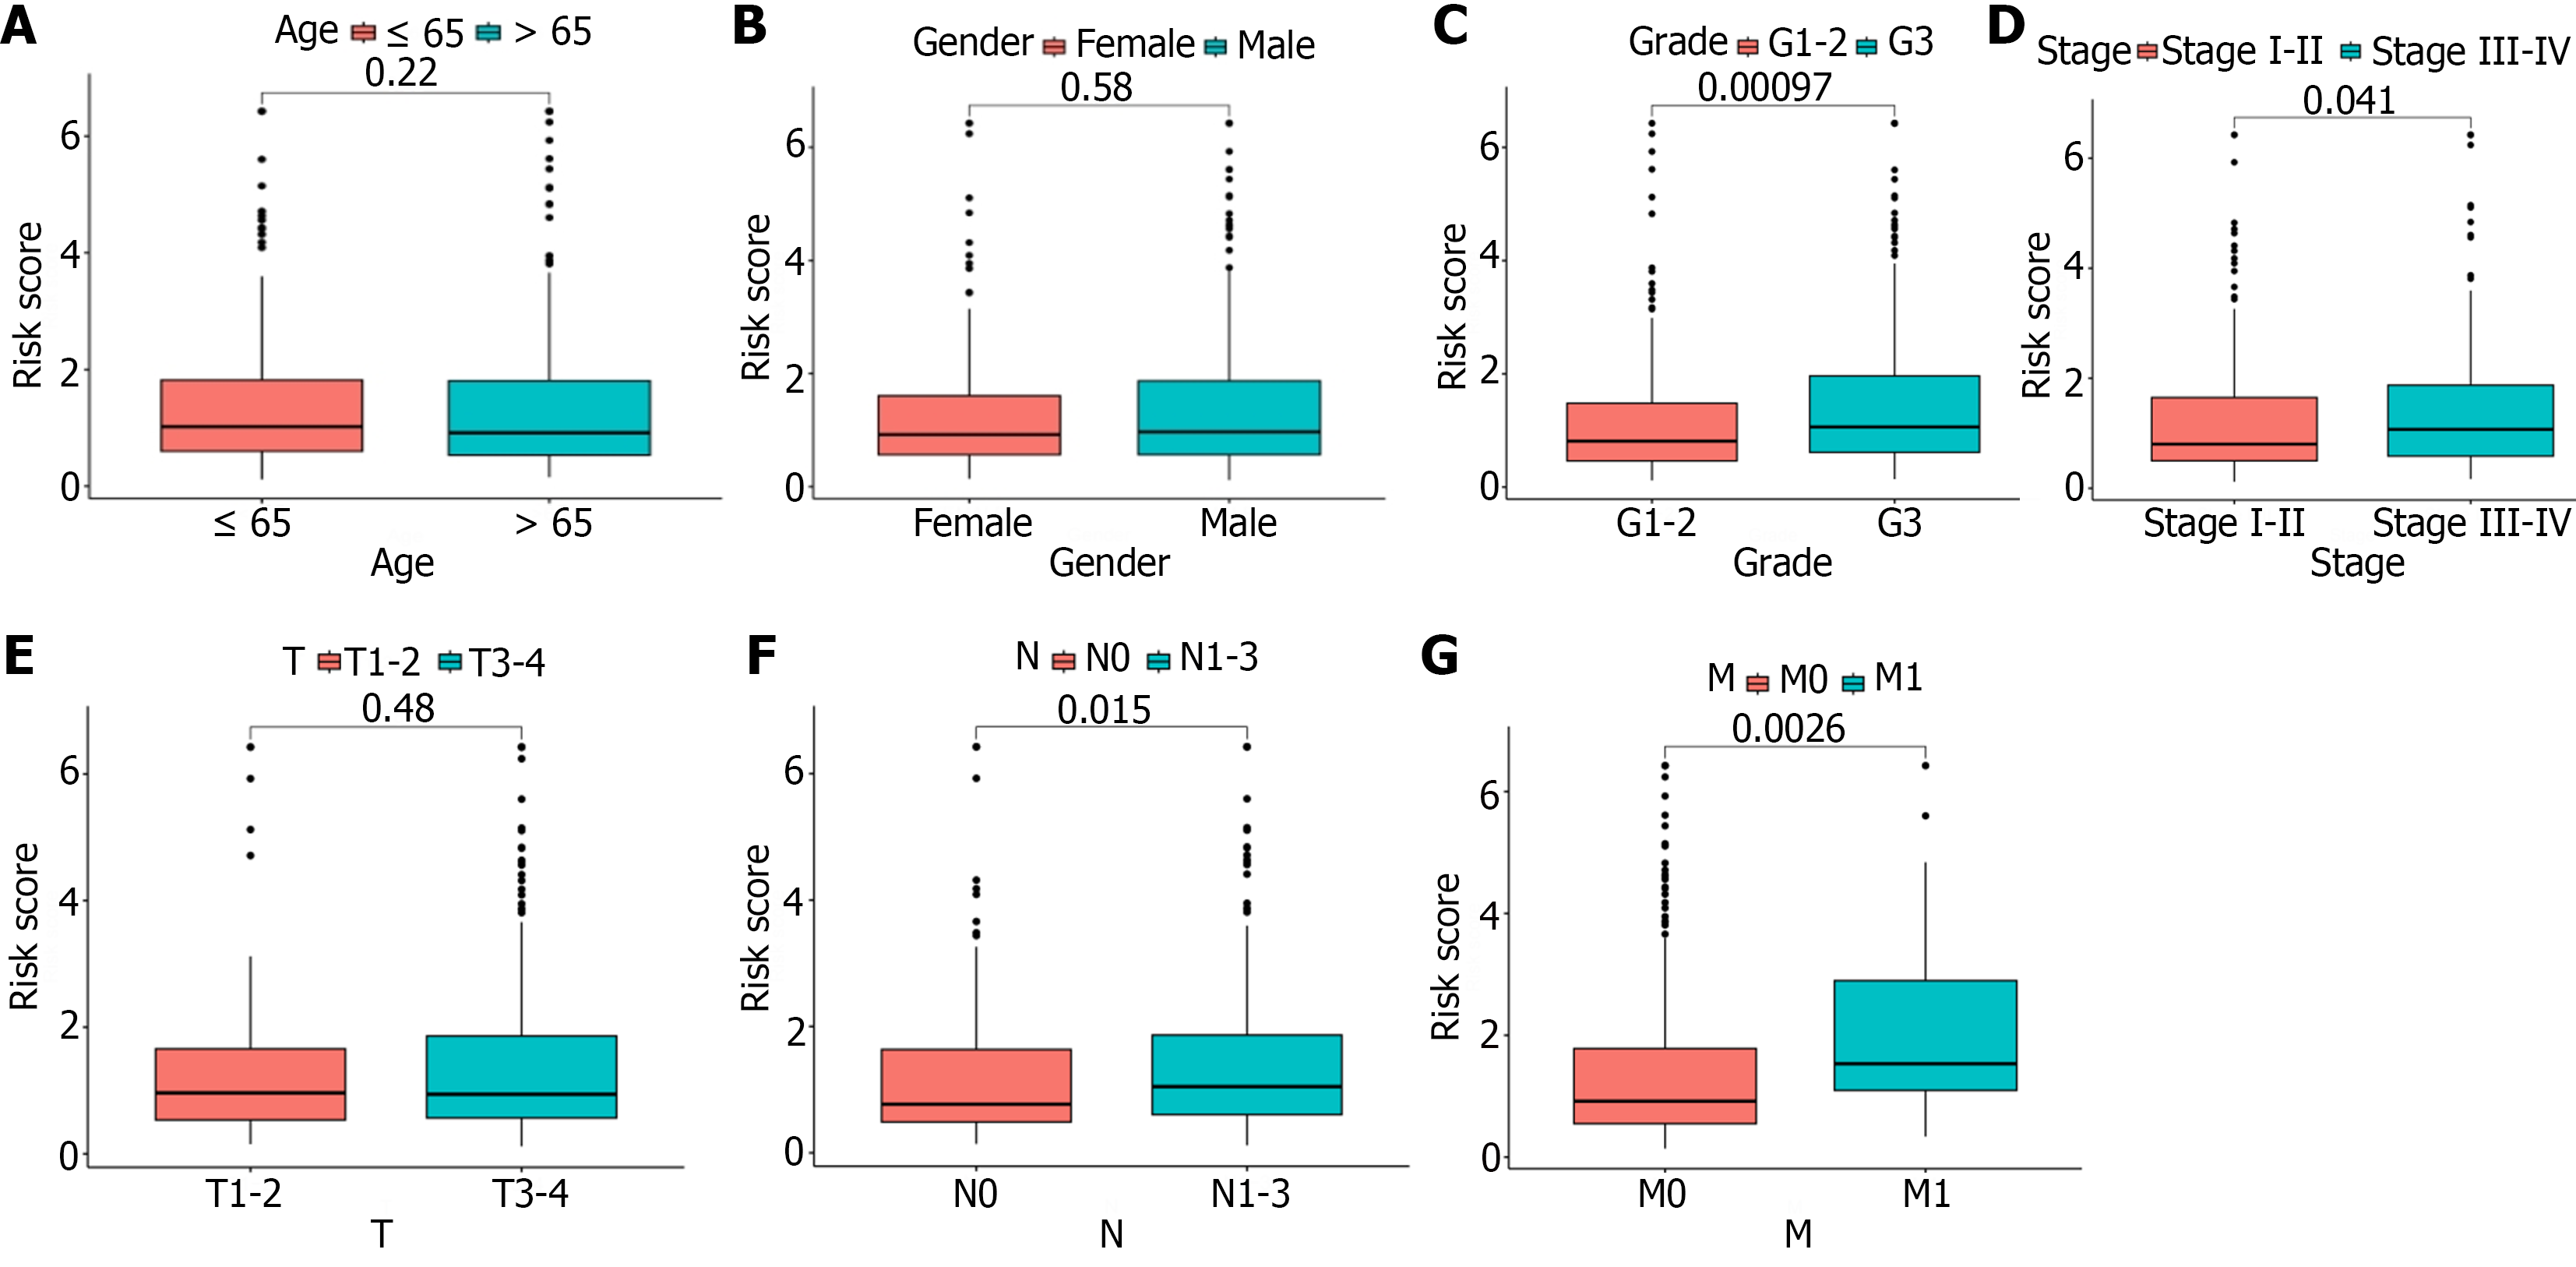
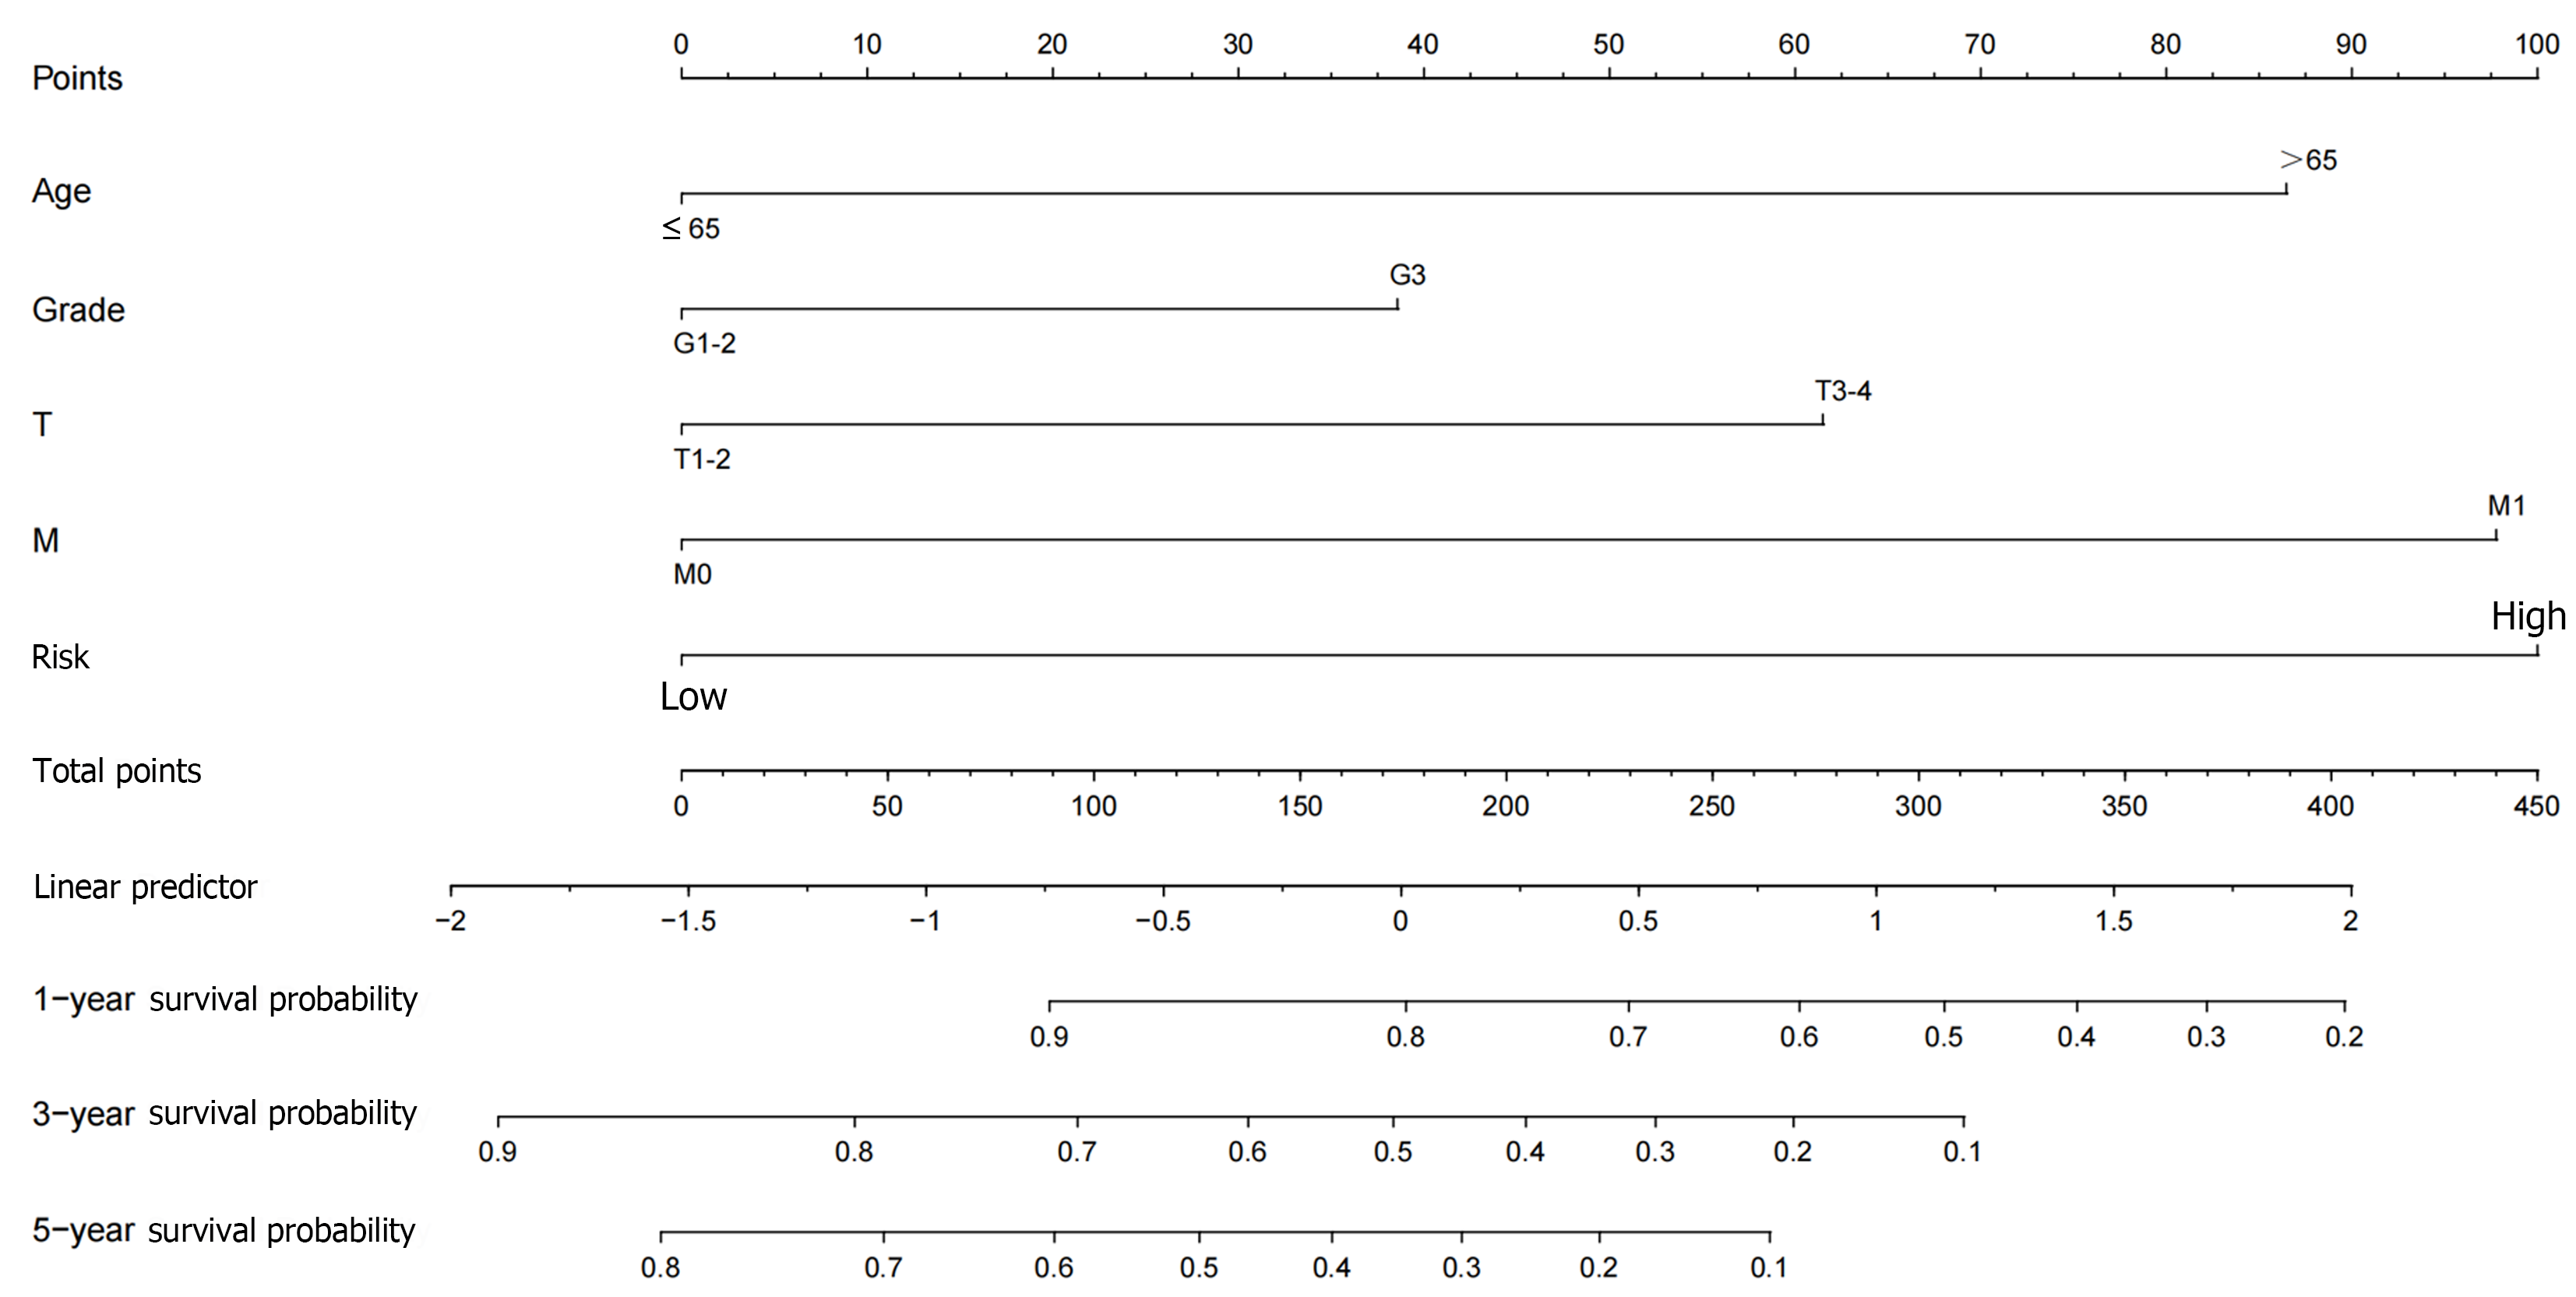
First, we performed an independent prognostic analysis to better predict the prognosis in this population of GC patients. Univariate Cox regression analysis indicated that age, gender, grade, tumor stage, and risk score were independent prognostic factors (Supplementary material). Multivariate analysis identified age, tumor stage, and risk score as independent risk factors influencing prognosis (Supplementary material). We then performed a correlation analysis to assess the relationship between risk score and clinical pathologic features [age (≤ 65 vs > 65), gender (female vs male), grade (G1-2 or G3), tumor stage (stage I-II or III-IV), T stage (T1-2 or T3), N stage (N0 or N1-3) and M stage (M0 or M1)]. The risk score showed significant statistical differences in tumor grade, tumor stage, N stage, and M stage (Figure 6A-D). G3, stage III-IV, N1-3, or M1 patients had significantly higher risk scores than G1-2, stage I-II, N0, or M0 patients. There was no statistical difference in risk score as a function of T stage, age or gender (Figure 6E-G). In addition, we further constructed a nomogram prediction model to improve the application value of this risk score (Figure 7). Both calibration and ROC curves confirmed the consistency of this nomogram prediction model and the data in this study (Supple
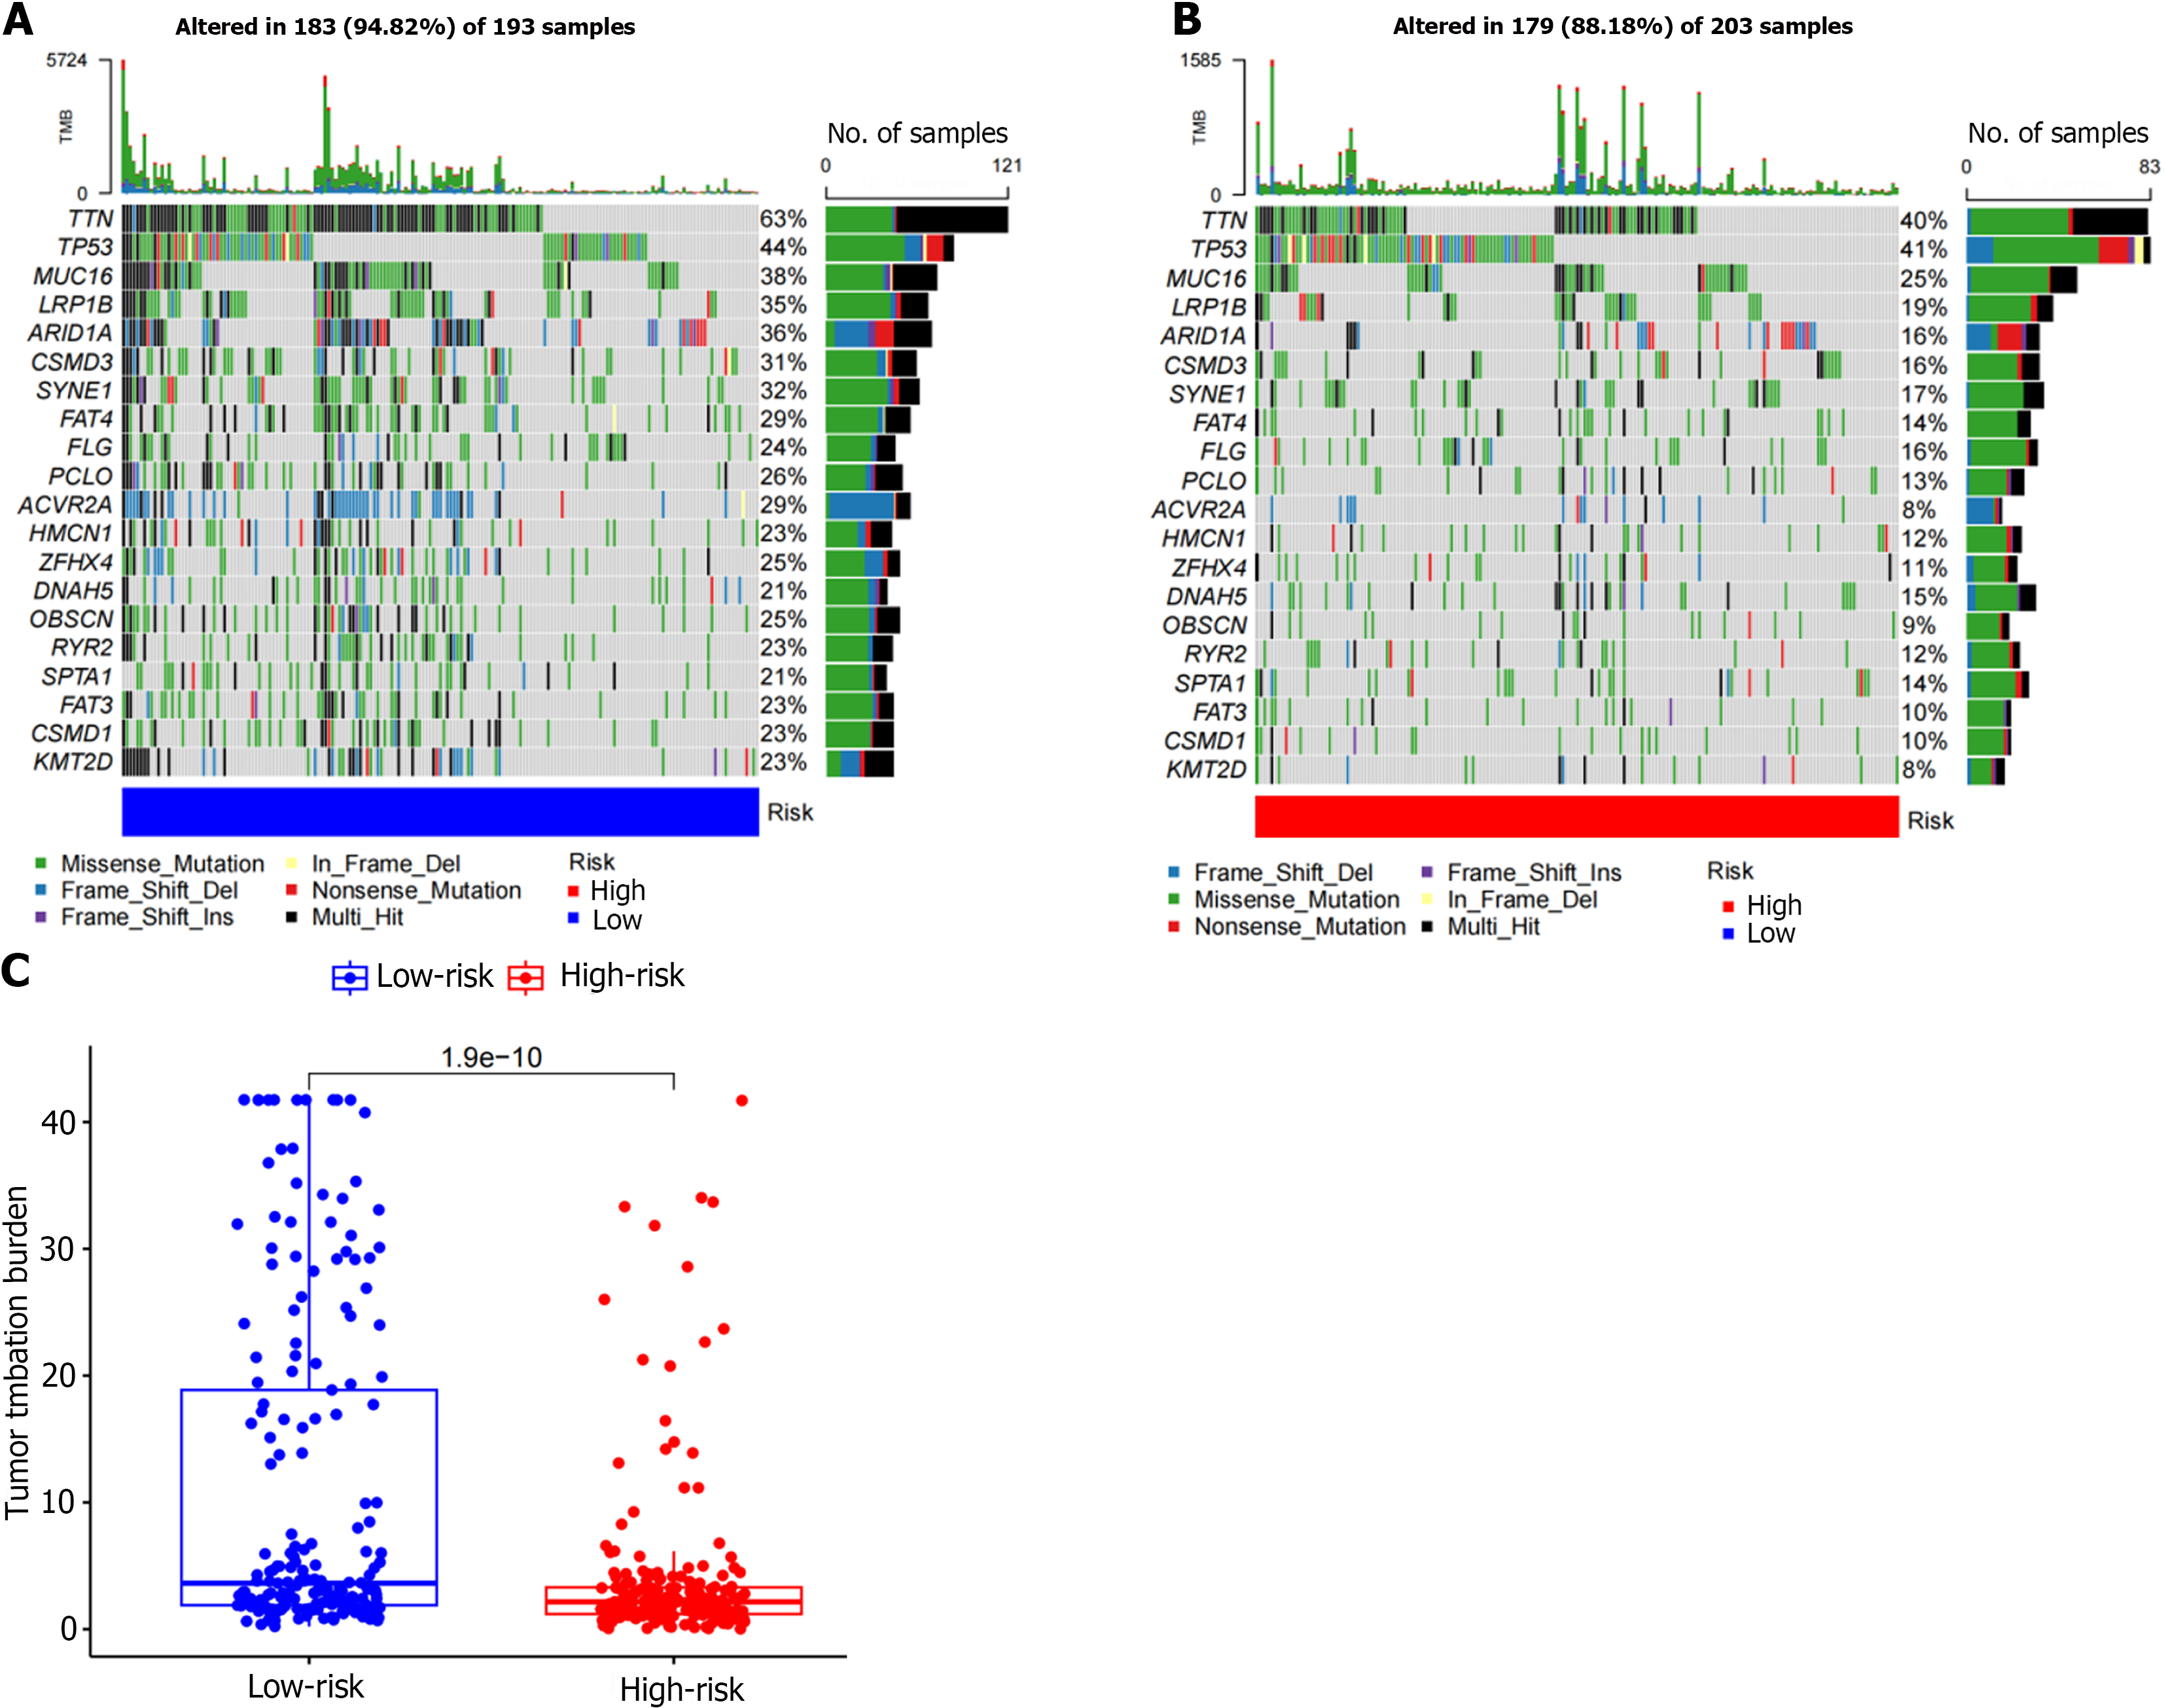
The TMB count of each GC patient was determined by the mutated gene data retrieved from the TCGA, and mutation analysis of diagnostic genes was performed. The results showed that the most common mutation types in both the low- and high-risk groups were Missense_Mutation, Multi_Hit and Frame_Shift_Del (Figure 8A and B). The top five mutant genes with mutation frequency in the two groups were TTN, TP53, MUC16, LRP1B, and ARID1A (Figure 8A and B). We subsequently evaluated the correlation between risk score and TMB. The results showed a significant correlation between risk score and TMB (P = 1.9e-10), and the level of TMB was higher in the low-risk group (Figure 8C).
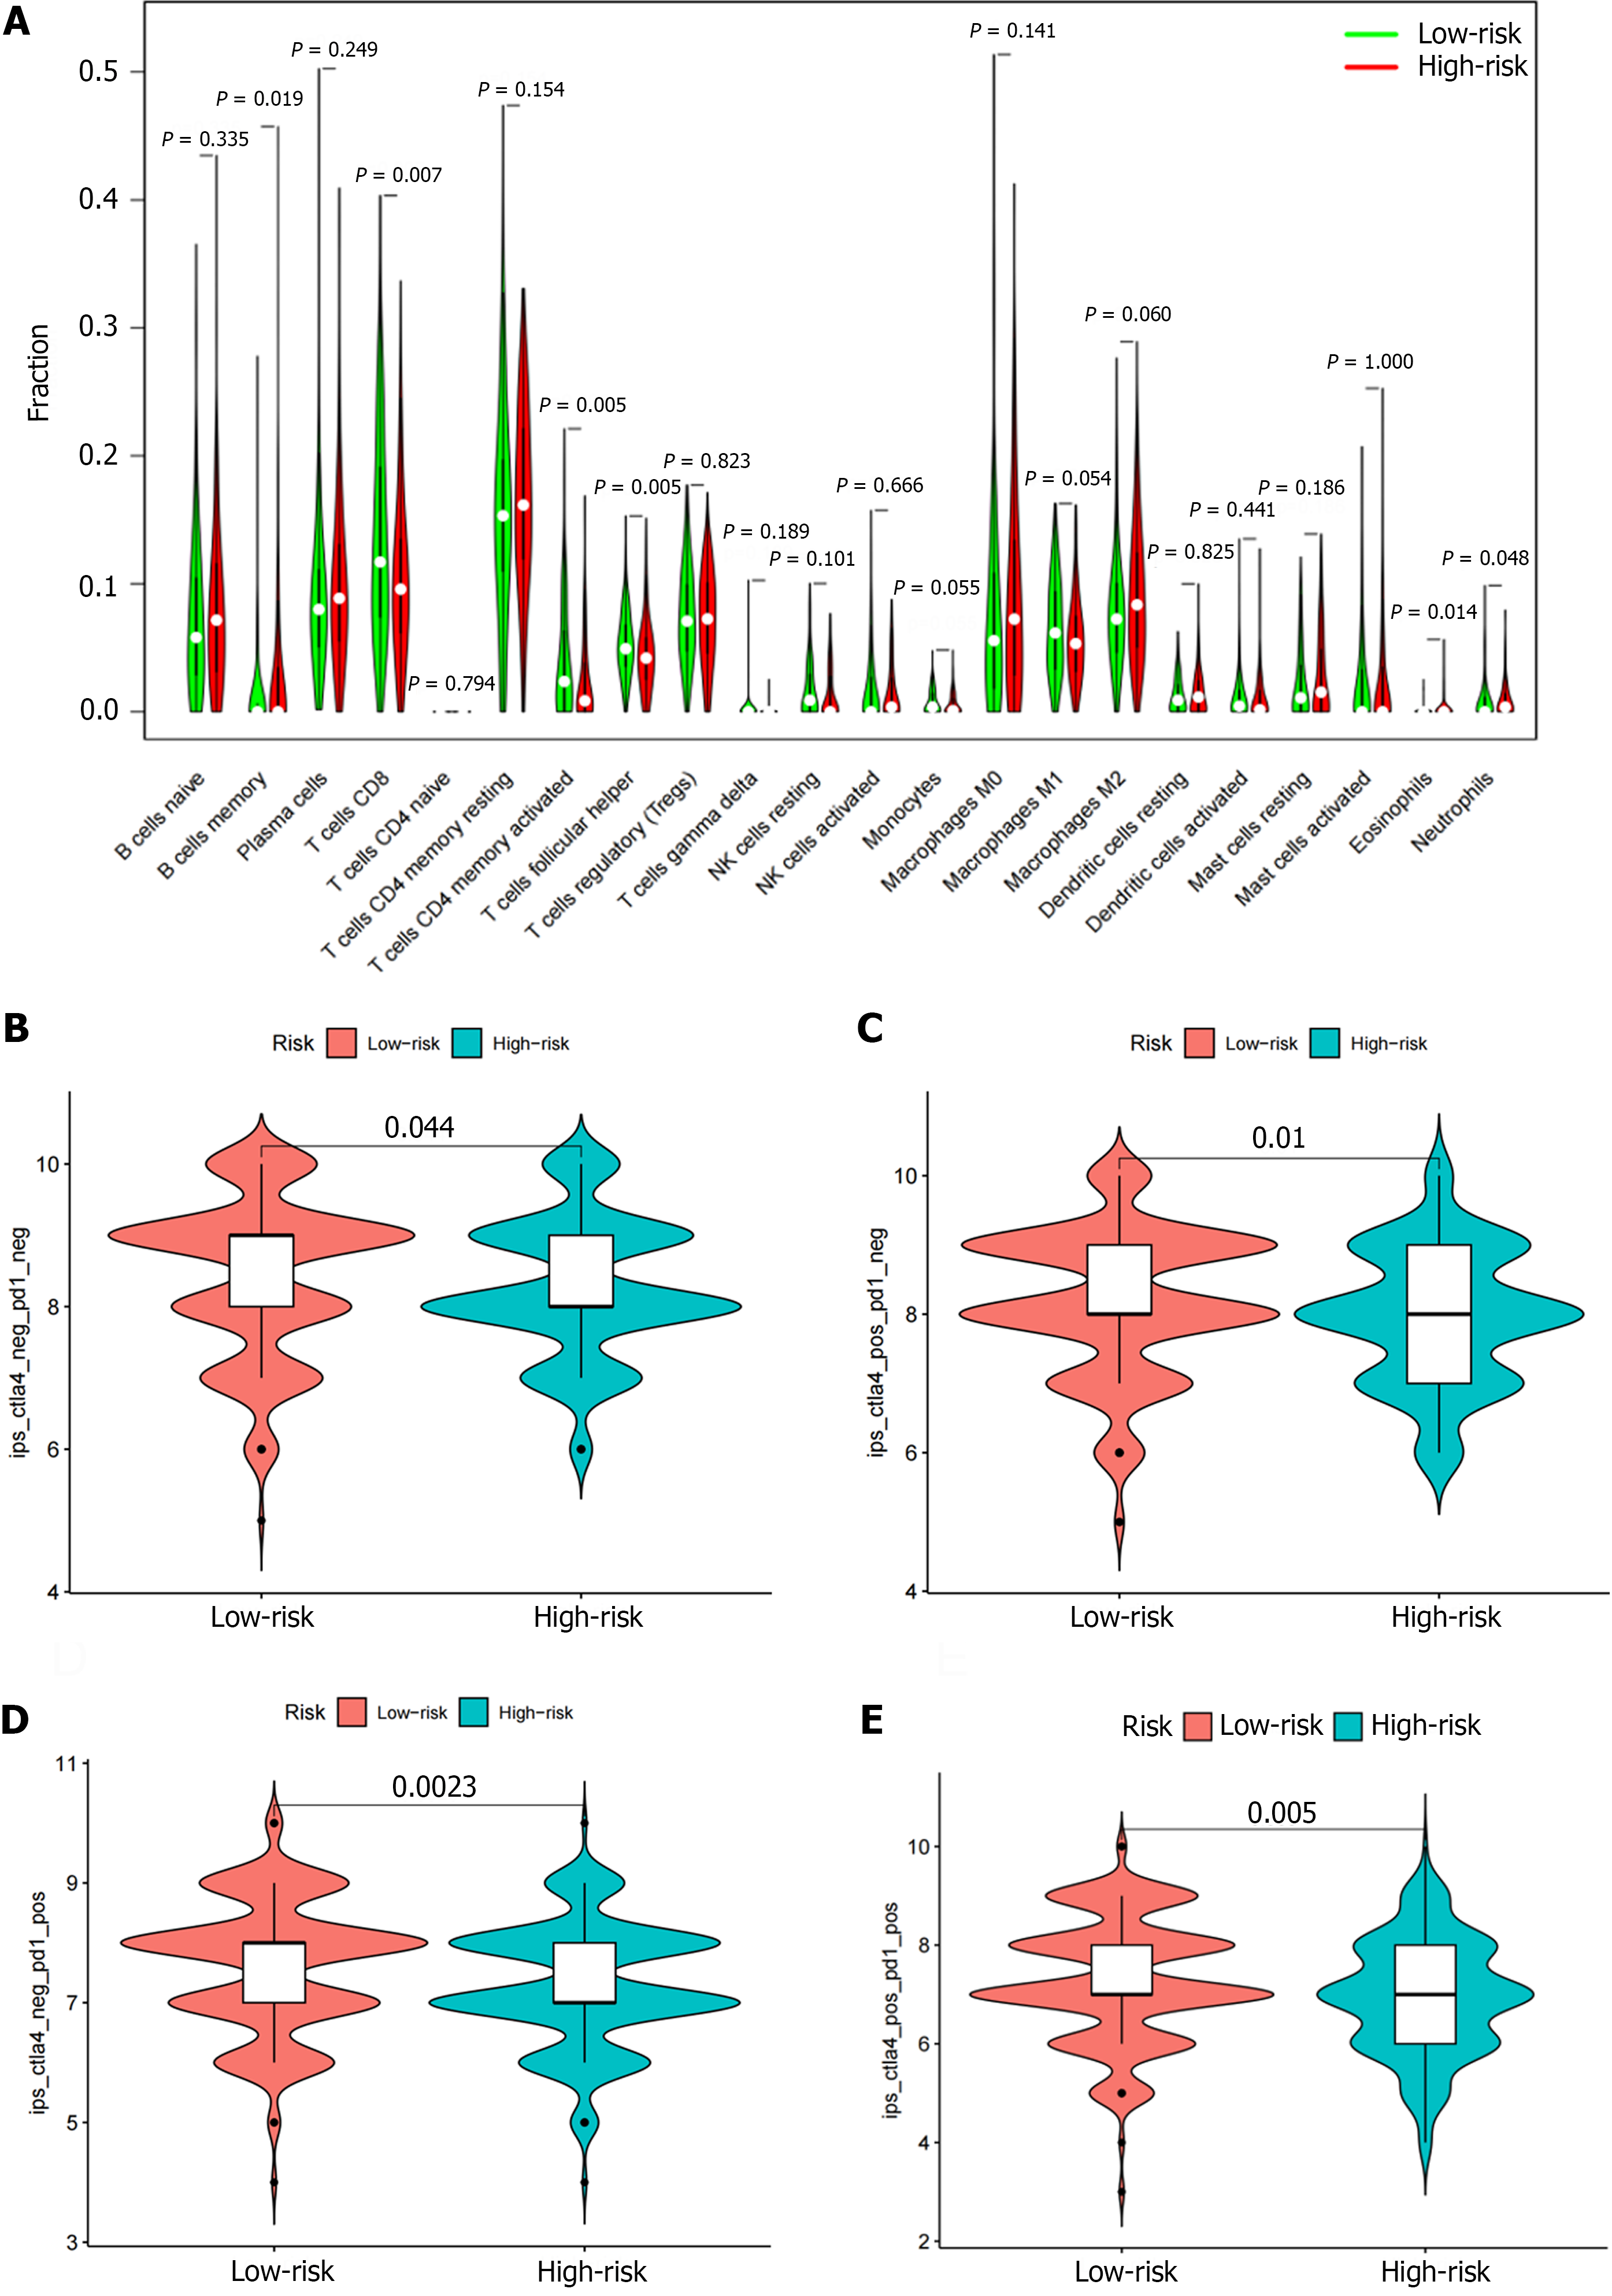
We used ‘CIBERSORT’ to determine the proportion of 22 immune cells in different risk groups to assess immune infiltration in each TCGA sample. We found that the levels of B cell memory, CD8 T cell, activated CD4 memory T cells, follicular helper T cells, and neutrophils were significantly correlated with the risk score. The percentages of CD8 T cells, activated CD4 memory T cells, follicular helper T cells, and neutrophils in the low-risk group were higher than those in the high-risk group (Figure 9A). The proportion of memory B cells and eosinophils in the high-risk group was higher than those in the low-risk group (Figure 9A).
To evaluate the immune response among GC patients, we calculated the immunophenotype (IPS) score to predict the patient's ability to respond (Figure 9B-E). The higher IPS score in the low-risk group suggests that low-risk patients may be more sensitive to immunotherapy. Above findings suggest that risk score may be a viable biomarker for predicting ICI treatment response.
GC is one of the cancers with the highest incidence rate in the world. The clinical characteristics of GC include strong invasion, high malignancy, high recurrence and metastasis rates, and short survival periods[8]. The early detection and diagnosis of a GC are crucial for comprehensive treatment and can prolong patient survival[9]. We found that the differential expression of multiple genes was associated with the occurrence, development, and prognosis of GC[10]. Although the relationship between IRGs in the microenvironment of GC and disease progression and patient prognosis have not been fully established, current high-throughput gene sequencing technology provides sufficient objective data for further systematic analysis of immune-related factors in clinical samples.
We established a risk prognostic model for GC based on 10 DEIRGs, including 9 risk genes (LCN1, LEAP2, TMSB15A mRNA, DEFB126, PI15, IGHD3-16, IGLV3-22, CGB5, and GLP2R) and 1 protective gene (LGR6). Patients were divided into high- and low-risk groups using a median risk score. The population of GC patients was divided into training and test cohorts for internal verification. Kaplan Meier survival, ROC, and risk curve analyses indicated that our risk model has good predictive ability. The identified DEIRGs have also been partially confirmed to be associated with the occurrence and development of tumors. TMSB15 belongs to a highly-conserved 5-kDa protein β thymosin family, and is the least studied member of the family. Increasing evidence suggests that TMSB15 has an important role in tumor progression. TMSB15 has been shown to be upregulated in various cancer cell lines and is associated with the migration and proliferation of cancer cells. The level of TMSB15A mRNA has been confirmed to be a reliable predictive indicator in triple-negative breast cancer[11]. GLP2R has been reported to be associated with gastrointestinal tumors[12]. Studies have shown that GLP2R knockdown significantly inhibits the proliferation and migration of GC cells[13]. LGR6 has been confirmed to be at high levels in GC cell lines and gastric adenocarcinoma tissues. Silencing LGR6 inhibits the proliferation and migration of MN45 and BGC-823 cells, and simultaneously inhibits the expression of MMP-9, β-catenin, CCNA2, CDK-2, and ERK1/2[14].
We further compared several clinical variables to evaluate the predictive ability of our risk model. Age, stage, and risk score were identified as three independent prognostic factors. Previous studies have confirmed that age and stage are the main prognostic factors for various tumors, including GC. Further analysis indicated that the predictive ability of this model also serves as an independent risk factor, showing high predictive ability. At the same time, there was a significant correlation between the risk score and the clinical pathologic characteristics of GC. On this basis, we further constructed a nomogram prediction model to improve the application value of this risk score.
Immune cell infiltration is an important feature of TME and has an important role in the development of tumors. In various types of cancer, the tumor-induced inflammatory response has been shown to be an effective prognostic biomarker. Zheng et al[15] reported that an imbalance in the immune microenvironment promotes the malignant development of tumors. Pernot et al[16] showed that the infiltration of various immune cells in the GC microenvironment is closely related to the clinical prognosis of patients. Therefore, we calculated the immune cell infiltration rate between the high- and low-risk groups in the GC sample. We found that multiple levels of immune cell infiltration increased, indicating that the risk model may determine which patients have a better response to ICI. Compared to the high-risk group, the proportion of CD8+ T cells, activated CD4 memory T cells, follicular helper T cells, and neutrophils were significantly increased in the low-risk group. In addition, the number of memory B cell and eosinophils in the high-risk group were significantly increased. This finding was consistent with previous research results. Zeng et al[17] found a significant positive correlation between CD8+T cell infiltration levels in TME of GC patients and prognosis. Inducing tumor cell death is the main function of CD8+ T cells[18]. Interleukin (IL) 12 mobilizes the proliferation of CD4+ memory T cells and kills tumor cells in the TME[19]. Niogret et al[20] reported that follicular helper T cells exert anti-tumor immune effects in a CD8+ T cell-dependent manner by promoting the production of IL-21; however, the role of B cells in the occurrence and development of tumors is controversial. Under certain conditions, B cells can resist tumors, mainly by producing tumor-specific antibodies and presenting tumor antigens, but some B cell subgroups and specific antibodies also inhibit anti-tumor immunity and promote tumor growth. Our findings with respect to neutrophils and eosinophils contradict previous studies. Using Vioplot, we also showed that the fraction of these two types of cells was very low, which may be account for the inconsistent results.
Immunotherapy has shown good results in the treatment of GC, and a variety of PD-1 inhibitors have been recommended for standard treatment; however, only 11%-25% of GC patients benefit from PD-1 inhibitor therapy[21-23]. It is currently thought that tumors with a greater number of mutated genes tend to produce more mutant RNA and proteins. It is more likely to activate the immune system and respond well to immunotherapy. Therefore, we also analyzed the differences in TMB between the two risk groups. The TMB in the low-risk group was significantly higher than the high-risk group. Among the high- and low-risk groups, the most frequently mutated genes included TTN, TP53, MUC16, LRP1B, and ARID1A. At the same time, we found that the low-risk group achieved higher IPS scores, which can be used to predict the response to ICIs. Both CTLA4+ and PD-1+ patients with low-risk scores were more sensitive to immunotherapy. Therefore, through our established risk model, we found that immunotherapy may be an option for GC patients with low-risk scores.
The current study had certain limitations. First, the data in this study is sourced from public databases, and inherent selection bias may affect the final results. Second, we successfully validated our prognostic model using internal datasets as a test cohort, but further validation of this risk model in the diagnosis and treatment of GC still requires multiple large external datasets and prospective clinical studies. Finally, we did not explore the function and mechanism of the 10 DEIRGs in this prognostic model, and the mechanism of action needs to be further elucidated.
In this study a new prognostic model consisting of 10 DEIRGs was constructed based on the tumor immune microenvironment. While providing risk factor analysis and prognostic information, our risk model can provide new directions for immunotherapy in GC patients.
In this study, we established a risk score model for differentially expressed immune-related genes (DEIRGs) to determine the impact on the development, prognosis, tumor microenvironment (TME), and treatment response of gastric cancer (GC) patients and to provide a new biomarker for personalized treatment of GC populations.
In this study we determined the impact of DEIRGs on the development, prognosis, TME, and treatment response of GC patients. In addition, we obtained a risk score that predicts clinical outcomes and immunotherapy efficacy in GC patients, and analyzed immune cell infiltration, immune checkpoints, tumor mutation burden (TMB), and immunotherapy between high- and low-risk patients. Based on the findings of the current study, we expect to provide novel biomarkers for personalized treatment of GC populations.
To explore the effects of DEIRGs on the development, prognosis, TME and treatment response of patients with GC, and establish a risk model to provide new biomarkers for personalized treatment of GC.
We used public data for analysis, established a risk model for DEIRGs, and divided the data into two groups: the training cohort and the test cohort. The Kaplan Meier survival analysis, receiver operating characteristic curve analysis, and risk curve confirmed that the risk model has good predictive ability. Simultaneously predict the response of immune checkpoint inhibitors based on TMB and immunophenotype (IPS) scores.
We obtained an immune-related signature based on 10 genes, including 9 risk genes (LCN1, LEAP2, TMSB15A mRNA, DEFB126, PI15, IGHD3-16, IGLV3-22, CGB5, and GLP2R) and 1 protective gene (LGR6). Meanwhile, patients in the low-risk group had higher TMB and IPS, which can be used to predict the immune checkpoint inhibitor response.
By developing a risk model, we aim to provide new biomarkers for personalized treatment of GC. The validity of the model is verified through many aspects.
In the future, we should further verify the effectiveness of this model in the population and confirm its clinical practicability.
Provenance and peer review: Unsolicited article; Externally peer reviewed.
Peer-review model: Single blind
Specialty type: Oncology
Country/Territory of origin: China
Peer-review report’s scientific quality classification
Grade A (Excellent): A
Grade B (Very good): 0
Grade C (Good): 0
Grade D (Fair): 0
Grade E (Poor): 0
P-Reviewer: Beg MMA, Kyrgyzstan S-Editor: Qu XL L-Editor: A P-Editor: Cai YX
| 1. | de Mello RA, Amaral GA, Neves NM, Lippo EG, Parini F, Xu S, Tolia M, Charalampakis N, Tadokoro H, Castelo-Branco P, Zhu J. Current and potential biomarkers in gastric cancer: a critical review of the literature. Future Oncol. 2021;17:3383-3396. [RCA] [PubMed] [DOI] [Full Text] [Cited by in Crossref: 24] [Cited by in RCA: 15] [Article Influence: 3.8] [Reference Citation Analysis (0)] |
| 2. | Sunakawa Y, Stremitzer S, Cao S, Zhang W, Yang D, Wakatsuki T, Ning Y, Yamauchi S, Stintzing S, Sebio A, El-Khoueiry R, Matsusaka S, Parekh A, Barzi A, Azuma M, Watanabe M, Koizumi W, Lenz HJ. Association of variants in genes encoding for macrophage-related functions with clinical outcome in patients with locoregional gastric cancer. Ann Oncol. 2015;26:332-339. [RCA] [PubMed] [DOI] [Full Text] [Full Text (PDF)] [Cited by in Crossref: 26] [Cited by in RCA: 31] [Article Influence: 3.1] [Reference Citation Analysis (0)] |
| 3. | Gentles AJ, Newman AM, Liu CL, Bratman SV, Feng W, Kim D, Nair VS, Xu Y, Khuong A, Hoang CD, Diehn M, West RB, Plevritis SK, Alizadeh AA. The prognostic landscape of genes and infiltrating immune cells across human cancers. Nat Med. 2015;21:938-945. [RCA] [PubMed] [DOI] [Full Text] [Cited by in Crossref: 2244] [Cited by in RCA: 2348] [Article Influence: 234.8] [Reference Citation Analysis (0)] |
| 4. | Gonzalez H, Hagerling C, Werb Z. Roles of the immune system in cancer: from tumor initiation to metastatic progression. Genes Dev. 2018;32:1267-1284. [RCA] [PubMed] [DOI] [Full Text] [Full Text (PDF)] [Cited by in Crossref: 765] [Cited by in RCA: 1427] [Article Influence: 203.9] [Reference Citation Analysis (0)] |
| 5. | Turley SJ, Cremasco V, Astarita JL. Immunological hallmarks of stromal cells in the tumour microenvironment. Nat Rev Immunol. 2015;15:669-682. [RCA] [PubMed] [DOI] [Full Text] [Cited by in Crossref: 575] [Cited by in RCA: 808] [Article Influence: 80.8] [Reference Citation Analysis (0)] |
| 6. | Hegde PS, Karanikas V, Evers S. The Where, the When, and the How of Immune Monitoring for Cancer Immunotherapies in the Era of Checkpoint Inhibition. Clin Cancer Res. 2016;22:1865-1874. [RCA] [PubMed] [DOI] [Full Text] [Cited by in Crossref: 462] [Cited by in RCA: 685] [Article Influence: 76.1] [Reference Citation Analysis (0)] |
| 7. | Hegde PS, Chen DS. Top 10 Challenges in Cancer Immunotherapy. Immunity. 2020;52:17-35. [RCA] [PubMed] [DOI] [Full Text] [Cited by in Crossref: 567] [Cited by in RCA: 1327] [Article Influence: 265.4] [Reference Citation Analysis (0)] |
| 8. | Melloni M, Bernardi D, Asti E, Bonavina L. Perforated Gastric Cancer: A Systematic Review. J Laparoendosc Adv Surg Tech A. 2020;30:156-162. [RCA] [PubMed] [DOI] [Full Text] [Cited by in Crossref: 3] [Cited by in RCA: 13] [Article Influence: 2.2] [Reference Citation Analysis (0)] |
| 9. | Rosa F, Tortorelli AP, Quero G, Galiandro F, Fiorillo C, Sollazzi L, Alfieri S. The impact of preoperative ASA-physical status on postoperative complications and long-term survival outcomes in gastric cancer patients. Eur Rev Med Pharmacol Sci. 2019;23:7383-7390. [RCA] [PubMed] [DOI] [Full Text] [Cited by in RCA: 4] [Reference Citation Analysis (0)] |
| 10. | Boonyanugomol W, Rukseree K, Kongkasame W, Palittapongarnpim P, Baik SC, Manwong M. Genetic Polymorphisms of CXCL8 (-251) Are Associated with the Susceptibility of Helicobacter pylori Infection Increased the Risk of Inflammation and Gastric Cancer in Thai Gastroduodenal Patients. Iran J Allergy Asthma Immunol. 2019;18:393-401. [RCA] [PubMed] [DOI] [Full Text] [Cited by in Crossref: 3] [Cited by in RCA: 4] [Article Influence: 0.7] [Reference Citation Analysis (0)] |
| 11. | Darb-Esfahani S, Kronenwett R, von Minckwitz G, Denkert C, Gehrmann M, Rody A, Budczies J, Brase JC, Mehta MK, Bojar H, Ataseven B, Karn T, Weiss E, Zahm DM, Khandan F, Dietel M, Loibl S. Thymosin beta 15A (TMSB15A) is a predictor of chemotherapy response in triple-negative breast cancer. Br J Cancer. 2012;107:1892-1900. [RCA] [PubMed] [DOI] [Full Text] [Full Text (PDF)] [Cited by in Crossref: 12] [Cited by in RCA: 21] [Article Influence: 1.6] [Reference Citation Analysis (0)] |
| 12. | Lu Y, Kweon SS, Tanikawa C, Jia WH, Xiang YB, Cai Q, Zeng C, Schmit SL, Shin A, Matsuo K, Jee SH, Kim DH, Kim J, Wen W, Shi J, Guo X, Li B, Wang N, Zhang B, Li X, Shin MH, Li HL, Ren Z, Oh JH, Oze I, Ahn YO, Jung KJ, Conti DV, Schumacher FR, Rennert G, Jenkins MA, Campbell PT, Hoffmeister M, Casey G, Gruber SB, Gao J, Gao YT, Pan ZZ, Kamatani Y, Zeng YX, Shu XO, Long J, Matsuda K, Zheng W. Large-Scale Genome-Wide Association Study of East Asians Identifies Loci Associated With Risk for Colorectal Cancer. Gastroenterology. 2019;156:1455-1466. [RCA] [PubMed] [DOI] [Full Text] [Cited by in Crossref: 111] [Cited by in RCA: 118] [Article Influence: 19.7] [Reference Citation Analysis (0)] |
| 13. | Fu M, Huang Y, Peng X, Li X, Luo N, Zhu W, Yang F, Chen Z, Ma S, Zhang Y, Li Q, Hu G. Development of Tumor Mutation Burden-Related Prognostic Model and Novel Biomarker Identification in Stomach Adenocarcinoma. Front Cell Dev Biol. 2022;10:790920. [RCA] [PubMed] [DOI] [Full Text] [Full Text (PDF)] [Cited by in Crossref: 1] [Cited by in RCA: 11] [Article Influence: 3.7] [Reference Citation Analysis (0)] |
| 14. | Fan M, Liu S, Zhang L, Gao S, Li R, Xiong X, Han L, Xiao X, Zhao L, Tong D, Yang J. LGR6 Acts as an Oncogene and Induces Proliferation and Migration of Gastric Cancer Cells. Crit Rev Eukaryot Gene Expr. 2022;32:11-20. [RCA] [PubMed] [DOI] [Full Text] [Cited by in RCA: 6] [Reference Citation Analysis (0)] |
| 15. | Zheng Z, Mao S, Zhang W, Liu J, Li C, Wang R, Yao X. Dysregulation of the Immune Microenvironment Contributes to Malignant Progression and Has Prognostic Value in Bladder Cancer. Front Oncol. 2020;10:542492. [RCA] [PubMed] [DOI] [Full Text] [Full Text (PDF)] [Cited by in Crossref: 22] [Cited by in RCA: 20] [Article Influence: 4.0] [Reference Citation Analysis (0)] |
| 16. | Pernot S, Terme M, Radosevic-Robin N, Castan F, Badoual C, Marcheteau E, Penault-Llorca F, Bouche O, Bennouna J, Francois E, Ghiringhelli F, De La Fouchardiere C, Samalin E, Baptiste Bachet J, Borg C, Boige V, Voron T, Stanbury T, Tartour E, Gourgou S, Malka D, Taieb J. Infiltrating and peripheral immune cell analysis in advanced gastric cancer according to the Lauren classification and its prognostic significance. Gastric Cancer. 2020;23:73-81. [RCA] [PubMed] [DOI] [Full Text] [Cited by in Crossref: 47] [Cited by in RCA: 84] [Article Influence: 16.8] [Reference Citation Analysis (0)] |
| 17. | Zeng D, Zhou R, Yu Y, Luo Y, Zhang J, Sun H, Bin J, Liao Y, Rao J, Zhang Y, Liao W. Gene expression profiles for a prognostic immunoscore in gastric cancer. Br J Surg. 2018;105:1338-1348. [RCA] [PubMed] [DOI] [Full Text] [Full Text (PDF)] [Cited by in Crossref: 125] [Cited by in RCA: 164] [Article Influence: 23.4] [Reference Citation Analysis (0)] |
| 18. | Henning AN, Roychoudhuri R, Restifo NP. Epigenetic control of CD8(+) T cell differentiation. Nat Rev Immunol. 2018;18:340-356. [RCA] [PubMed] [DOI] [Full Text] [Cited by in Crossref: 341] [Cited by in RCA: 377] [Article Influence: 53.9] [Reference Citation Analysis (0)] |
| 19. | Broderick L, Yokota SJ, Reineke J, Mathiowitz E, Stewart CC, Barcos M, Kelleher RJ Jr, Bankert RB. Human CD4+ effector memory T cells persisting in the microenvironment of lung cancer xenografts are activated by local delivery of IL-12 to proliferate, produce IFN-gamma, and eradicate tumor cells. J Immunol. 2005;174:898-906. [RCA] [PubMed] [DOI] [Full Text] [Cited by in Crossref: 47] [Cited by in RCA: 54] [Article Influence: 2.7] [Reference Citation Analysis (0)] |
| 20. | Niogret J, Berger H, Rebe C, Mary R, Ballot E, Truntzer C, Thibaudin M, Derangère V, Hibos C, Hampe L, Rageot D, Accogli T, Joubert P, Routy B, Harker J, Vegran F, Ghiringhelli F, Chalmin F. Follicular helper-T cells restore CD8(+)-dependent antitumor immunity and anti-PD-L1/PD-1 efficacy. J Immunother Cancer. 2021;9. [RCA] [PubMed] [DOI] [Full Text] [Full Text (PDF)] [Cited by in Crossref: 13] [Cited by in RCA: 81] [Article Influence: 20.3] [Reference Citation Analysis (0)] |
| 21. | Shitara K, Van Cutsem E, Bang YJ, Fuchs C, Wyrwicz L, Lee KW, Kudaba I, Garrido M, Chung HC, Lee J, Castro HR, Mansoor W, Braghiroli MI, Karaseva N, Caglevic C, Villanueva L, Goekkurt E, Satake H, Enzinger P, Alsina M, Benson A, Chao J, Ko AH, Wainberg ZA, Kher U, Shah S, Kang SP, Tabernero J. Efficacy and Safety of Pembrolizumab or Pembrolizumab Plus Chemotherapy vs Chemotherapy Alone for Patients With First-line, Advanced Gastric Cancer: The KEYNOTE-062 Phase 3 Randomized Clinical Trial. JAMA Oncol. 2020;6:1571-1580. [RCA] [PubMed] [DOI] [Full Text] [Cited by in Crossref: 821] [Cited by in RCA: 867] [Article Influence: 173.4] [Reference Citation Analysis (1)] |
| 22. | Kang YK, Boku N, Satoh T, Ryu MH, Chao Y, Kato K, Chung HC, Chen JS, Muro K, Kang WK, Yeh KH, Yoshikawa T, Oh SC, Bai LY, Tamura T, Lee KW, Hamamoto Y, Kim JG, Chin K, Oh DY, Minashi K, Cho JY, Tsuda M, Chen LT. Nivolumab in patients with advanced gastric or gastro-oesophageal junction cancer refractory to, or intolerant of, at least two previous chemotherapy regimens (ONO-4538-12, ATTRACTION-2): a randomised, double-blind, placebo-controlled, phase 3 trial. Lancet. 2017;390:2461-2471. [RCA] [PubMed] [DOI] [Full Text] [Cited by in Crossref: 1283] [Cited by in RCA: 1714] [Article Influence: 214.3] [Reference Citation Analysis (0)] |
| 23. | Chen DS, Mellman I. Elements of cancer immunity and the cancer-immune set point. Nature. 2017;541:321-330. [RCA] [PubMed] [DOI] [Full Text] [Cited by in Crossref: 2373] [Cited by in RCA: 3603] [Article Influence: 450.4] [Reference Citation Analysis (0)] |


